BTCUSD Technical Analysis – Is a Pullback Coming Soon?BITSTAMP:BTCUSD is currently trading within a clearly defined ascending channel, with price action now testing the upper boundary. This level may act as a dynamic resistance, and rejection here could trigger a corrective move towards the $98,000 support zone.
If buyers defend this support level, the bullish structure remains intact, with potential to move back toward higher levels. However, if price breaks below this zone, there will be little to stop it from falling further.
Monitoring candlestick patterns and volume at this key area is essential to identify potential buying opportunities. Risk should be managed properly—always confirm your setups and trade with solid risk management.
If you have any thoughts on this setup or additional insights, feel free to share them in the comments!
Intradaytrade

BANKNIFTY 52700 PE (29 May 2025 Expiry) – Intraday Options Type: Intraday | Put Option (PE)
Strike: 52700
CMP: ₹635.00Recommended Buy Range: ₹626.00 – ₹631.00
Target Achieved: ₹730.00 ✅
Stop Loss: ₹570.00
Profit Booked: ₹94.35 / +18.45% 🟢
⏱️ Timeframes: 15min & 1H
This was a quick momentum scalp based on:
🔻 Weakness in BankNifty index with rejection near key resistances
📉 Bearish candles on 15min + volume confirmation
🔄 Entry near VWAP zone, breakout of structure support
For Education Purposes Only

Equity Research Report – Polycab India Ltd.✅ Buy Levels
Buy Above: ₹5,800 (post breakout confirmation)
Ideal Entry on Dip: ₹5,765–₹5,785
🎯 Targets
Timeframe Target 1 Target 2 Target 3
15-min ₹5,870 ₹5,950 ₹6,070
1-hour ₹6,070 ₹6,220 ₹6,427 (Fib 61.8%)
🔻 Stop Loss
Intraday SL: ₹5,720
Positional SL: ₹5,650 (below trendline support and 20 EMA)
For Education purposes only

XAUUSD Downtrend Continues- Is 3,175 the Next Stop?OANDA:XAUUSD is currently trading within a well-defined descending channel, with price action consistently forming lower highs and lower lows. This structure reflects sustained bearish momentum, and sellers continue to dominate the overall direction.
The recent upward move appears to be a technical rebound, with price approaching a potential resistance zone near the upper boundary of the channel. This area may now serve as a supply zone after acting as previous support, making it an important region for potential rejection.
If the resistance holds, a rejection here could lead to the continuation of the bearish trend, with a potential move targeting the support area around 3,175, aligning with the lower boundary of the descending channel.
However, failure to hold below this level could invalidate the bearish scenario and increase the likelihood of a retest toward the upper boundary of the channel.
Traders should monitor for clear rejection signals at resistance, such as bearish engulfing candles or strong rejection wicks, or alternatively, wait for breakout confirmation before considering a trend shift. As always, proper risk management remains essential.

USDJPY - Analysis and Potential Setups (Intraday- 25.04.25)Overall Trend & Context:
This pair is in an overall uptrend and has reacted off the 140.00 support levels (as well as the 200 EMA on the Daily chart).
Technical Findings:
Price is trading above 25, 50,100 and 200 EMA's on intraday charts.
Powerful break of structure which leaves no question about bullish force.
Current consolidation - Demand needs to be built before continuation.
Notes:
Price is currently at a historic support level however has not closed above daily supply, we are still in the area of doing so.
Manage your risk, take the trade with confirmations only.

US30 – Descending Channel intact after False BreakoutFX:US30 is currently trading within a clearly defined descending channel, with price action continuously being restricted by the upper trendline. The recent decline indicates that sellers are in control, suggesting the possibility of continuation.
Price has recently broken through a key support area and may come back to retest it. If this level holds as support, it will reinforce the bearish structure and increase the likelihood of a move toward the 34,100 target, which aligns with the boundary of the channel.
As long as price remains below this support area, the bearish outlook remains intact. A false breakout may occur to "trap" buyers, so it is necessary to wait for clear reversal candle confirmation before entering a trade.
Remember, always confirm your setup and use appropriate risk management.

ATOM Breaks Falling Trendline – Eyes on $8.80 TargetATOM/USDT has broken out of a long-term falling resistance trendline on the daily chart, signaling a potential bullish reversal.
The price is currently testing a key resistance zone around $4.90–$5.20. A strong breakout above this level could open the path toward the $8.80 target, offering solid upside potential.
Immediate support lies near $4.40, with stronger support at $4.18. As long as the price holds above these levels, the bias remains bullish, with a favorable risk-reward setup for continuation.
Found this analysis helpful? Don’t forget to like, drop a comment, and follow us for more insights. Thanks for the love!

Nasdaq Intraday TradeWith the overnight GAP, price jumped above the white Centerline, just to come back in the Asia session.
We see that price broke the white CL and halted afterwards. Do yo see where it halted? Yes, at the Centerline of the yellow Momentum Fork!
And currently it's pushing up through the white CL again...hmmm...
So, we have momentum, clear support at the yellow CL, a potential new push through the white CL and a loooooot of Air...and stop/losses above to be sucked in §8-)
I'm long with a stop below the yellow CL low, and with multiple targets to the upside.
Let's have fun!

GOLD → Strong consolidation. What’s Next?OANDA:XAUUSD is consolidating within the 2926 - 2890 range. The overall market remains bullish, but there are signs of short-selling or pre-news selling ahead of the major economic data release scheduled for Wednesday.
Accordingly, the market is eagerly awaiting U.S. inflation and employment data, which could play a crucial role in shaping the Federal Reserve’s next move. Despite a weaker dollar and rising expectations of monetary easing, Fed Chair Jerome Powell remains cautious, signaling a measured approach to policy adjustments.
Meanwhile, gold demand remains strongly supported by China as the country ramps up its purchases. Additionally, growing concerns over stagflation in the U.S. further strengthen gold’s appeal as a safe-haven asset. However, traders are keeping a close watch on upcoming economic reports and the potential impact of China's tariffs on U.S. goods, which could introduce further market volatility.
The key focus now is 2926, where price action is shaping a potential accumulation phase before a breakout. If price stabilizes above this resistance, it could trigger a significant bullish impulse, signaling a continuation of the uptrend.
However, a major challenge remains—if the price accelerates too quickly toward resistance, the risk of a false breakout increases. In such a scenario, the market may pull back to 2890 to test liquidity zones, ensuring structural confirmation before making a legitimate move back toward 2926 and beyond.
What are your thoughts on gold?
Best regards, Bentradegold!

USDCHF: The battle of 0.9000 - Sell or wait?Hello everyone, Ben here!
USDCHF previously broke its uptrend as the fundamental landscape shifted, and the dollar entered a correction phase. Clearly, sellers are in control, as illustrated on the chart.
Fundamentally, the situation is becoming more complex due to the tariff war initiated by Trump, with European countries responding in kind. Economic risks are rising. Additionally, with rumors of rate cuts from Trump and Powell, the dollar has entered a correction phase, which has had a positive impact on the forex market.
From a technical perspective, the 0.9000 level plays a crucial role, as it represents a strong zone. If sellers manage to keep the price below this level, within the selling zone, it will confirm further downside movement.
I also cannot rule out the possibility of a retest of the previous breakout range before a deeper decline. Emphasizing the 0.9000 level!
Best regards,
Bentradegold!

EURUSD: Attempting to change the trendHello dear friends, Ben here!
Currently, EURUSD is attempting to capture recovery due to the dollar's adjustment. The price is forming a reaction from the resistance channel consolidation before breaking out and growing further.
Accordingly, after breaking through the trend channel resistance level, the price has moved into a consolidation phase around the range of 1.053 to 1.021. Within this, the price is testing the resistance level of 1.038. From this, we can argue that the market is still working to change its trend and become stronger against the dollar's adjustment.
Resistance levels: 1.038, 1.053
Support levels: 1.033, 1.021
Emphasizing the resistance level of 1.038, with confirmation of consolidation above this level, there will be nothing stopping EURUSD from further growth.
Best regards, Bentradegold!

GOLD → Consolidating around 2921 — Poised for a Breakout!OANDA:XAUUSD continues its upward trajectory amid rising economic risks and a weakening dollar. The metal is currently testing resistance at 2921 and appears poised for further gains.
The U.S. dollar has broken its bullish structure, driven by comments from the U.S. Treasury regarding potential rate cuts. This intervention has significantly influenced market sentiment. Theoretically, gold is unlikely to decline further due to trade war risks and expectations of a dovish Fed policy. Additionally, weak ADP employment data and PMI figures could provide further bullish momentum for gold.
Key levels to watch are 2913 and 2903, which have already been tested and tapped into liquidity zones. Now, all eyes are on 2927—if this level holds, gold could retreat back to the 2913-2903 support zone. However, a breakout above 2927 could fuel further upside, with the next targets at 2942-2956.
Share your thoughts, opinions, and questions—let's discuss what’s unfolding in the market!

#TITANCOMPANY Demand ZoneTitan Company Limited, a leading Indian consumer goods company, is primarily known for its watches, jewelry, eyewear, and other lifestyle accessories. The concept of a "demand zone" for Titan Company can be analyzed across various dimensions, including market demand, product portfolio, distribution channels, and customer engagement strategies.

GOLD → The calm before the NFP torm! What’s next?OANDA:XAUUSD is currently trading within the 2926 - 2894 range, signaling a pause after its recent strong uptrend. If a false support breakdown occurs, the market could quickly revert, especially amid signs of a recovering USD.
However, a weaker dollar and expectations of a Federal Reserve policy shift toward easing continue to support gold demand. Despite the temporary suspension of Trump’s tariff measures, the precious metal remains in focus as a safe-haven asset.
Traders are now closely watching the NFP report, which could dictate the dollar’s future trajectory and influence Fed policy decisions. In the short term, attention will be on Initial Jobless Claims data, which may provide early signals about the U.S. labor market.
Technical Outlook
-Gold remains within the 2926 - 2894 range, potentially testing liquidity near the 2894 support zone.
-An unfilled fair value gap (FVG) below 2894 could lead to a brief dip before a rebound.
-Given the bullish long-term trend in gold and the ongoing dollar weakness, the probability of a price recovery remains high.
In this scenario, gold may fake out a breakdown, grab liquidity near support, and then resume its broader uptrend.
Best regards, Bentradegold!

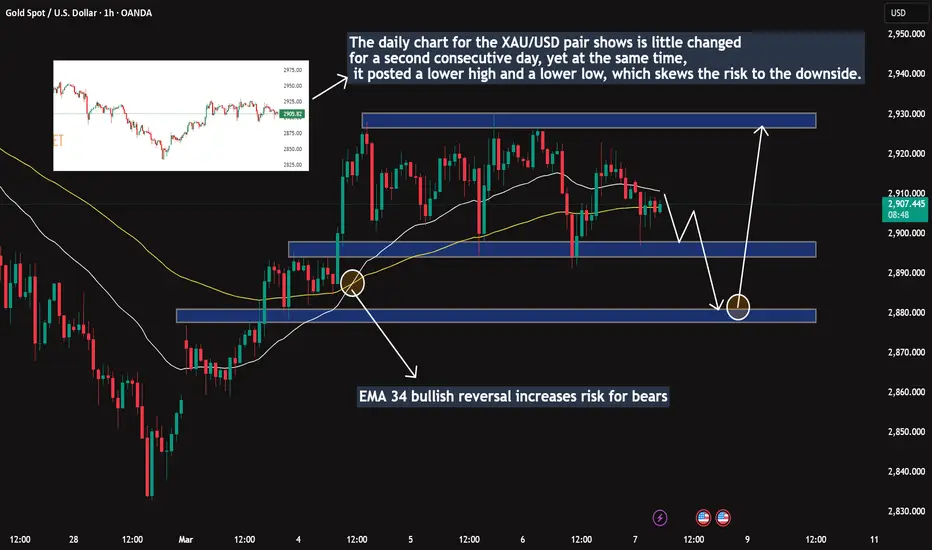
Gold purchase strategy continues to prioritize. Target 500 pips!Dear friends!
Gold continues to trade negatively for the second consecutive day, despite a combination of factors still acting as key drivers ahead of the crucial U.S. NFP report at the end of this Friday. Rising trade tensions continue to put pressure on investor sentiment.
As mentioned on the 1-hour chart, the daily chart for XAU/USD shows little change for the second consecutive day. However, at the same time, it also records lower highs and lower lows, shifting the risk bias to the downside. Nevertheless, the short-term picture indicates that buyers are struggling to maintain control, with the 34 EMA having reversed, increasing the risk for sellers. As a result, the downside potential remains limited, with dips likely to continue attracting buyers.
Key short-term levels to consider:
Support: 2,894 | 2,876
Resistance: 2,911 | 2,927
Gold price breakout – What’s Next?The XAU/USD 2-hour chart reveals an exciting breakout from the previous downtrend channel, signaling a potential trend reversal. The 34 EMA and 89 EMA continue to provide solid support, while buyers are holding firm within the consolidation zone.
Two Key Scenarios Ahead:
✅ Case 1: If gold breaks out of this consolidation box, we could see a strong bullish continuation toward $2,950 - $2,970, and possibly even higher.
⚠️ Case 2: However, if price fails to sustain above this range, a retracement to $2,880 - $2,850 is on the table.
With geopolitical tensions rising and economic uncertainty driving investors toward safe-haven assets, will gold break higher, or are we in for a deeper pullback?
📉📈 What’s your outlook on gold? Bullish or bearish? 🚀👇

USDJPY: Consolidating below the uptrend channel!Dear Traders!
Recently, USDJPY has made a strong breakout, completely exiting the uptrend and stabilizing below a new support level, as highlighted on the 1-hour chart. The pair is currently trading around 149.20.
This stability above the new support is driven by U.S. President Donald Trump's tariff policies, which have boosted risk-off sentiment and increased demand for the U.S. Dollar as a safe-haven asset. However, expectations of a BoJ rate hike and concerns over a global trade war continue to support the Japanese Yen, keeping gains limited below the lower boundary of the previous uptrend channel.

GOLD → Breaks 2881. Buyers are ready…OANDA:XAUUSD breaking through the resistance threshold of the downward trend and attempting to seek gains above the critical resistance zone of 2881. A consolidation before the breakout is forming relative to 2894, signaling potential growth on the dollar's correction foundation.
Previously, Trump confirmed the possibility of imposing 25% tariffs on Canada, Mexico, and China, triggering retaliatory measures and increasing the risk of U.S. recession. Declining PMI and Atlanta Fed's GDP led to a sell-off on Wall Street and increased demand for gold as a protective asset.
Geopolitical tensions persist as Trump suspends military aid to Ukraine, sparking European discontent. Market focus will remain on the release of detailed U.S. monthly employment information - commonly known as the Non-Farm Payroll (NFP) report on Friday. This crucial data will impact both USD and gold metal.
Technically, the price surpassing the 2881 resistance level divides the market into two planes. A consolidation before breakthrough is forming relative to 2895. The resistance breakthrough and price consolidation above 2895 could reinforce growth. The buyers' main focus is maintaining defensive positions above 2885 - 2895.
In the context of increasing economic risks and declining dollar, gold has every opportunity to continue its growth following the local trend change. The targets in this scenario are 2915, 2921, 2929.
Best regards, Bentradegold!

Gold price today: Extend the momentum!Gold prices continued their upward momentum today, hovering around the $2,910 level. The last recorded trade for gold stood at $2,928 per ounce, marking a 270-pip increase compared to early yesterday morning.
Accordingly, gold prices are currently experiencing strong impacts from USD fluctuations and US tariff policies. Meanwhile, President Donald Trump continues to raise concerns by threatening to impose tariffs on imports from Mexico and Canada. These factors could determine whether gold can reach the $3,000 per ounce mark or not.
Currently, investors are awaiting the US payroll report, expected to be released at the end of this week. The report's results could influence the monetary policy of the Federal Reserve (FED).
On the technical chart, the precious metal has broken out of the descending price channel and made adjustments to create new highs. Bullish factors are driven by the crucial support level at 2885 and the two EMA lines at 34 and 89. All expectations are focused on gold's long-term price appreciation because any signs of US economic slowdown will support calls for Fed rate cuts and provide support for OANDA:XAUUSD .

Gold price today: Strong rebound!Dear traders!
At around 6 AM on March 4, the spot gold price stood at $2,894 per ounce, marking a $36 increase from the previous day's opening price of $2,858 per ounce.
The primary reason for this rise is the increased risk aversion among investors, driving higher demand for safe-haven assets like gold amid escalating geopolitical tensions. Over the weekend, a heated exchange between U.S. President Donald Trump and Ukrainian President Volodymyr Zelensky raised concerns that efforts to end the Ukraine-Russia military conflict could reach an impasse.
Additionally, U.S. trade tariffs on Mexico, Canada, and China take effect today, March 4, sparking fears of potential financial market instability. This uncertainty has pushed many investors toward gold as a wealth preservation asset.
Meanwhile, a sudden decline in the U.S. dollar has made gold more attractive to investors holding other currencies. As a result, today's gold price outlook remains positive. Keep an eye on the $2,892 resistance level, as a breakout above this point could signal further upside momentum.
What are your thoughts?

EUR/USD: Bearish reversal signal!EUR/USD is showing signs of a bearish reversal around 1.04900, completing a Harmonic pattern.
Strategy:
Sell below 1.04800
Stop loss: 1.05039
Take profit: 1.04240
Wait for bearish confirmation before entering!

#TATAMOTORS Demand ZoneBuying pressure is strong enough to overcome selling pressure.
The price has historically reversed upward from this zone.
Traders expect the price to bounce back if it reaches this zone again.

Update gold today!Dear traders!
During the Asian session on Monday, gold is attracting some buyers, aiming for the $2,900 level. Geopolitical uncertainty surrounding the Russia-Ukraine conflict continues to support the precious metal while putting pressure on the US dollar, further aiding gold’s short-term recovery.
However, from a technical perspective, gold remains below the EMA 34 and EMA 89, indicating that the bearish trend is still in control. The key resistance zone at $2,892 - $2,895 could be a crucial area where sellers re-enter the market. If gold fails to break above this level, we may see a renewed downward move, reinforcing the dominance of the bears.
