Learning#03 : VWAP in Intraday TradingLearning#03 : VWAP in Intraday Trading
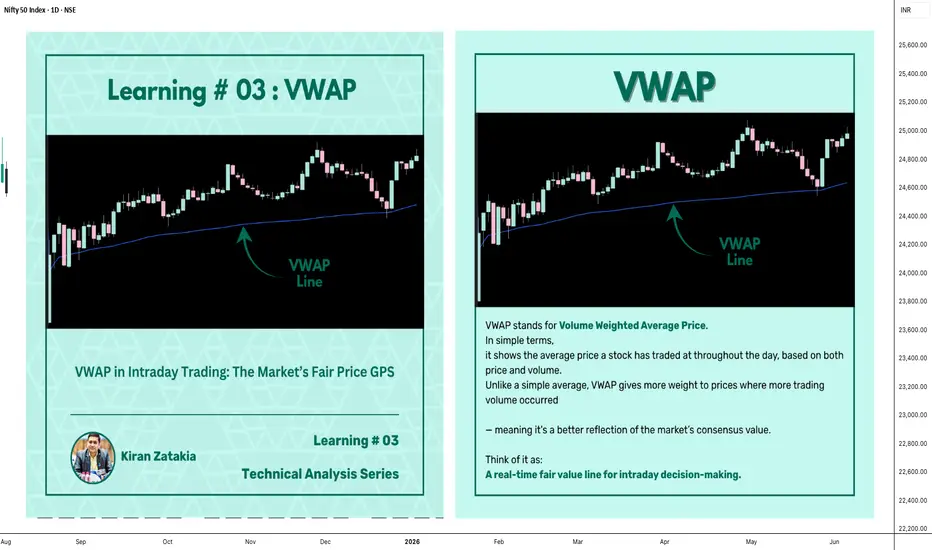
📊 VWAP in Intraday Trading: The Market’s Fair Price GPS
Ever wondered if there’s a level that shows where the real trading action is happening? That’s exactly what VWAP does — it’s like a volume-weighted compass that intraday traders use to orient themselves in the market.
It’s not just another line on your chart. VWAP reflects where institutions and volume-heavy participants are active. That’s why understanding how price interacts with it can give you a serious edge.
Let’s break it down 👇
🧠 What is VWAP?
VWAP stands for Volume Weighted Average Price.
In simple terms, it shows the average price a stock has traded at throughout the day, based on both price and volume.
Unlike a simple average, VWAP gives more weight to prices where more trading volume occurred — meaning it's a better reflection of the market’s consensus value.
Think of it as:
A real-time fair value line for intraday decision-making.
📈 Why VWAP Matters for Intraday Traders
VWAP acts as an intraday anchor. It tells you whether the price is currently trading above or below the day’s volume-weighted average — giving you quick insight into who's in control.
Here’s how to interpret it:
When price is above VWAP, buyers are in control and the bias is bullish.
When price is below VWAP, sellers are dominating and the bias is bearish.
When price is hovering near VWAP, the market is undecided, consolidating, or lacking direction.
In short, VWAP tells you who’s winning the intraday tug of war — and whether it’s even worth stepping in.
⚙️ How to Use VWAP in Your Intraday Strategy
1️⃣ VWAP as a Trend Filter
Before entering a trade, check where price is relative to VWAP:
Price above VWAP with higher lows → Focus on long setups
Price below VWAP with lower highs → Focus on short setups
🔁 Skip counter-trend trades. Stay with the flow.
This helps in trending markets by keeping you aligned with momentum.
2️⃣ VWAP as Dynamic Support or Resistance
VWAP behaves like a magnet. Price often pulls back to it and either:
Rejects (respects the level as support/resistance), or
Breaks and reclaims (signaling a potential reversal)
Use it alongside:
Flag patterns
Inside bars
Break-and-retest structures
3️⃣ VWAP Reversion Play (Snapback Trade)
This is a mean-reversion setup:
Price moves quickly away from VWAP at open
No strong follow-through, signs of exhaustion
Take a counter-trend trade back to VWAP
⚠️ Avoid this in strong trending markets — best used in choppy or fading environments.
4️⃣ VWAP with Price Action for Structure
Pair VWAP with clean price action:
Mark support and resistance zones
Observe price behavior near VWAP
Look for confirmation: inside bars, rejection wicks, engulfing candles
🎯 This adds logic and clarity to your entries — no random trades.
🔍 Bonus VWAP Tips
Combine VWAP with:
CPR (Central Pivot Range) for confluence zones
Opening range for breakout bias
Volume profile to spot high interest areas
These combos create strong, repeatable trade setups.
✅ VWAP Recap: Why It Matters
Here’s a quick breakdown of how VWAP can sharpen your intraday trading game:
Bias Building: VWAP helps confirm whether the market structure is bullish or bearish, giving you a reliable directional bias.
Trend Filtering: It keeps you aligned with the current momentum by filtering out counter-trend trades.
Pullback Entries: VWAP acts as a dynamic support or resistance level, offering clean zones to enter trades during pullbacks.
Mean Reversion: In sideways or fading markets, VWAP becomes a natural magnet — allowing you to target price reversions.
Risk Management: It provides logical reference points for placing stop-losses and defining entry zones, adding clarity to your risk-reward planning.
✍️ Final Thoughts
VWAP may sound simple, but it brings real structure to intraday trading.
It tells you where volume met price, and that’s powerful. When used with price action, it creates a solid framework for:
Building directional bias
Finding clean entries
Managing risk like a pro
VWAP doesn’t predict — it reflects. And in trading, reflection is more useful than prediction.
🛎️ Respect VWAP. Trade with structure.
— Kiran Zatakia
Intradaytrading
XAU/USD Intraday Plan | Support & Resistance to WatchGold broke above the 3,362 resistance and extended its rally into the 3,400 resistance zone, currently trading around 3,386. Price remains comfortably above both the 50MA and 200MA, which are sloping upward and acting as dynamic support—keeping short‑term structure bullish.
A confirmed break and hold above 3,400 would open the path toward the next upside targets at 3,416 and 3,440, with 3,458 as a higher‑timeframe extension if momentum continues.
If price fails to sustain above 3,383–3,400 and begins to fade, watch the initial pullback toward 3,362.
A deeper move below that would shift focus to the Pullback Support Zone.
Failure to hold there could expose price to the Support Zone and potentially the HTF Support Zone if bearish pressure builds.
📌 Key Levels to Watch
Resistance:
3,383 ‣ 3,400 ‣ 3,416 ‣ 3,440
Support:
3,362 ‣ 3,336 ‣ 3,317 ‣ 3,302 ‣ 3,289
🔎 Fundamental Focus –
📌 Fed Chair Powell Speaks – key event that can move USD and gold sharply.

Gold (XAUUSD) – 21 July | M15 Pullback Within Bearish Structure🟠 Gold (XAUUSD) – 21 July Analysis | M15 Pullback in Bearish Trend
Gold is currently in a pullback phase within a bearish M15 trend .
The market structure is defined between the M15 lower high at 3377.650 and the previous low at 3310 .
On Friday, price retested the M15 supply zone near the lower boundary, and again today, it has reacted from the same area. This repeated rejection suggests that sellers are still defending this level.
🔍 Trend Context:
– M15: Bearish (Lower High → Lower Low structure intact)
– H4: Currently in a pullback phase
Unless the price breaks above the key 3377.650 level, the bearish structure remains valid. As such, our directional bias continues to favour shorts.
🟥 Key Supply Zone: 3358–3377.650
– Recent rejections seen from this zone
– Acts as the active short-term supply zone
– Watching for internal M15 bearish shift for possible entry
Preferred Scenario:
As price has already retested the M15 supply zone, if we now see a downside shift in internal M15 structure (e.g., ChoCH + BoS), we will look for a potential short entry aligned with the dominant M15 trend .
No confirmation, no entry. Always follow structure.
Alternate Scenario:
If the market breaks above the 3377.650 lower high, it would signal a potential bullish structure shift . In that case, we will step back from the short bias and re-evaluate long opportunities accordingly.
📌 Trade Plan:
– Wait for M15 internal structure to shift (ChoCh) bearish, followed by a Break of Structure (BoS)
– On the retest, mark the Point of Interest (POI) for potential short setup
– Only act on confirmation (e.g., M1 ChoCH + BoS)
– SL: 40 pips | TP: 120 pips | Risk-Reward: Always 1:3
Summary:
– Gold is in a pullback phase within a bearish M15 trend
– Key levels to watch: 3377.650 (lower high) and 3310 (previous low)
– Bias remains bearish unless structure flips
– Watch for internal structure shift for short opportunity
– Stay patient and aligned with the dominant trend
📘 Shared by @ChartIsMirror

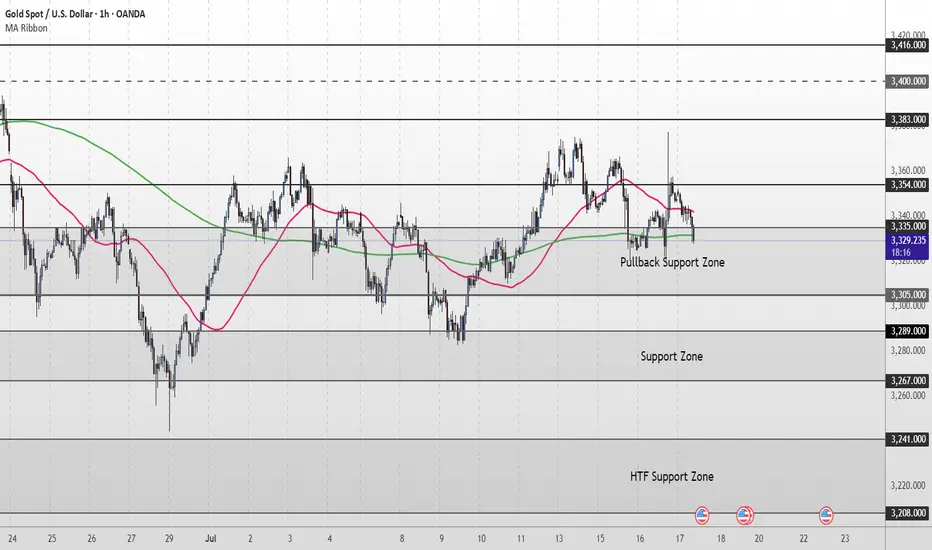
Gold Short Term OutlookYesterday, gold staged a strong rally, pushing up toward 3,377, which was followed by a strong rejection. Price has pulled back sharply and is now testing the Pullback Zone once again.
Currently trading around 3,329, price is caught between the 50MA overhead acting as dynamic resistance and the 200MA below offering dynamic support.
For the bullish structure to regain momentum, we need to see a clean break and hold back above 3,354. This would reopen the path toward 3,383 and 3,400, with 3,416 as a higher‑timeframe target.
If buyers fail to defend the Pullback Support Zone, and price breaks decisively below 3,305, attention shifts to the Support Zone (3,289–3,267). A deeper selloff could then expose the HTF Support Zone (3,241–3,208).
📌 Key Levels to Watch
Resistance:
‣ 3,354
‣ 3,383
‣ 3,400
‣ 3,416
Support:
‣ 3,335
‣ 3,305
‣ 3,289
‣ 3,267
‣ 3,241
🔎 Fundamental Focus – High‑Impact U.S. Data Today
A packed U.S. calendar could drive volatility:
📌Core Retail Sales m/m and Retail Sales m/m
📌Unemployment Claims
📌Philly Fed Manufacturing Index
These red‑folder releases can create sharp intraday swings.
Additionally, multiple FOMC member speeches later in the session could add headline‑driven moves.
Gold Short Term OutlookGold has extended its recovery after holding above the Pullback Support Zone and is now trading around 3,359, attempting to build momentum toward higher resistance levels.
The structure remains bullish with price trading above both the 50MA and 200MA , which are starting to slope upward and act as dynamic support.
A confirmed break and hold above 3,354 would open the path toward the next resistance cluster at 3,383 and potentially 3,400, with 3,416 and 3,440 as higher-timeframe resistance targets.
If price fails to hold above 3,354 and begins to fade, watch the Pullback Support Zone (3,335–3,305) closely for signs of renewed buying interest.
A clean break below that zone would shift focus to the deeper Support Zone (3,289-3,267) and potentially the HTF Support Zone (3,241–3,208) if selling pressure builds.
📌 Key Levels to Watch
Resistance:
‣ 3,364
‣ 3,383
‣ 3,400
‣ 3,416
Support:
‣ 3,354
‣ 3,335
‣ 3,305
‣ 3,289
‣ 3,267
‣ 3,241
‣ 3,208
🔎 Fundamental Focus
All eyes are on today’s U.S. CPI release

Learning#02 : Fractals⛰️ Learning#02 : Fractals
The Cleanest Clue on a Cluttered Chart
If you like clean charts and smart price behaviour, Fractals are one of those tools that give subtle but powerful signals. They’re not magic. They simply reflect what price is telling you—if you’re willing to listen.
Let’s unpack the concept and learn how to use Fractals like a pro.
🔍 What Is a Fractal in Trading?
In technical analysis, a Fractal is a five-candle pattern that marks a local top or bottom in price. It’s a pure price-action signal that doesn’t rely on lagging indicators.
There are two types of Fractals:
Bearish Fractal (Top): The 3rd candle has the highest high, surrounded by two lower highs on each side.
Bullish Fractal (Bottom): The 3rd candle has the lowest low, flanked by two higher lows on each side.
These formations are Price's way of saying: *"I tried to go further, but couldn't."
📊 What Do Fractals Indicate?
A shift in short-term control (bulls vs. bears)
Minor support or resistance zones
Useful markers for entries, exits, or trailing stop levels
They don't guarantee reversals but are excellent at highlighting where price momentum may pause, reverse, or build structure.
📈 How to Use Fractals – A Practical Guide
Let’s be clear: Fractals are not trade signals by themselves.
Instead, they work best when used in confluence with your strategy. Think of them as tools that:
Help confirm breakout levels
Refine pullback entries
Guide you in drawing cleaner trendlines, fib zones, and support/resistance levels
Assist in identifying swing highs and lows for Dow Theory-style trend analysis
🔗 Fractals + Strategy = Smart Trading
Whether you trade breakouts or mean reversion, Fractals help clarify:
Which highs or lows matter
Where to place stop losses with structure-based logic
How to trail SL as the trade progresses
They quietly organize your chart into readable, tradeable levels.
🚀 Practical Uses of Fractals
Fractals are the first tool I add to any chart—they instantly reveal structure and guide every step of my analysis.
1. Breakout Confirmation
Wait for a candle to close above a bullish fractal high or below a bearish fractal low.
Useful when the market is trending or forming structures like double bottoms/tops.
2. Pullback with Confirmation
Use the fractal zone as a short-term S/R level. If price returns and shows signs of rejection (like an inside bar, wick rejections, or low volume), consider entries based on confirmation.
Great in sideways or swing environments.
3. Trend Structure Validation
Fractals reveal clear pivot highs/lows, helping:
Confirm higher highs/higher lows
Mark structure for trendline drawing
Validate Fib levels or S/R zones
4. Trailing Stop Loss
Update your SL to trail behind the most recent opposite-side fractals.
In longs: SL below new bullish fractals
In shorts: SL above new bearish fractals
This lets you stay in the move while managing risk like a pro.
How it’s Look Like on Chart
snapshot
⚠️ Common Mistakes to Avoid
Trading every fractal blindly
Ignoring price context or trend
Relying on fractals in low-volume, choppy markets
📝 Final Thoughts
Fractals are like breadcrumbs left by price action. They quietly point to areas where the market faced resistance or found support. Alone, they’re not enough. But in the hands of a price-action trader, they’re incredibly useful.
Used alongside market structure, confirmation signals, and clean charting habits, Fractals become:
Trend identifiers
Entry enhancers
Stop loss trail markers
⭐ Bonus Tip
Next time you mark a level, Fibonacci or draw a trendline, check if a Fractal confirms it. You’ll be surprised how often it does.
Trade simple. Trade clean.
— Kiran Zatakia

Gold To The Basement? Week Ahead with Bearish Bias by PhoenixFX🌟 Welcome to Phoenix FX’s Intraday Pulse! 🌟
Hello, Phoenix FX family! 👋 I’m thrilled you’ve joined us for today’s TradingView chart breakdown. Our focus? Intraday opportunities—spotting those high-probability setups you can enter, manage, and leave to run whilst you concentrate on the things you love doing.
Here’s what you’ll find in this analysis:
Key Levels & Zones: Support, resistance, and Fair Value Gaps that matter on the smaller timeframes.
Price-Action Clues: Exact candlestick patterns and momentum signals to watch for your next entry.
Trade Triggers & Targets: Clear criteria for when to get in, where to take profits, and how to manage your risk.
Whether you’re hunting quick scalps or tactical swing moves, our goal is simple: help you trade with confidence, clarity, and community support. Got a different view or a fresh idea? Drop it in the comments—after all, “each one, teach one.” 😉
Let’s dive into the charts and make today’s market moves count! 🚀📈
Donald Trump’s presidency continues to exert outsized influence on gold through three main channels: trade policy uncertainty, fiscal stimulus (and resulting deficits), and shifts in safe-haven demand. Here’s how each factor has played out—and what it could mean for gold going forward:
1. Trade-War Uncertainty
What’s Happening: The Trump administration’s aggressive use of tariffs—including recent 25% duties on goods from Japan and South Korea—has periodically roiled markets and driven investors into gold as a safe haven. On July 7, gold pared losses after tariff news, as traders sought refuge despite a firm dollar.
Looking Ahead: If further tariff escalations or retaliations emerge, expect renewed spikes in gold. Conversely, any de-escalation or trade-deal breakthroughs could sap that safe-haven bid.
2. Fiscal Stimulus & Deficits
What’s Happening: Senate Republicans recently passed a Trump-backed tax‐and‐spending package projected to add $3.3 trillion to the U.S. deficit. Larger deficits—especially when financed by the Fed—tend to stoke inflation expectations, which bolsters gold’s appeal as an inflation hedge.
Looking Ahead: Continued large-scale stimulus or fresh tax cuts without offsetting revenue measures could keep real yields low (or negative), a classic tailwind for gold.
3. Safe-Haven Flows & Investor Positioning
What’s Happening: Despite peaking at record highs earlier this year, gold remains up roughly 30% since November, driven largely by investor fears around Trump’s policy unpredictability and geopolitical tensions.
Looking Ahead: Should Trump-era uncertainty persist—whether around trade, foreign policy, or domestic turmoil—gold is likely to retain its status as a portfolio diversifier and crisis hedge. A sustained drop in U.S. real rates or fresh bouts of market volatility would reinforce that trend.
🎯 Outlook Summary
Bullish Drivers: Ongoing trade-war rhetoric, larger deficits, and any new geopolitical flashpoints.
Bearish Risks: Clear resolution of major trade disputes, a pivot by the Fed toward earlier rate cuts (reducing real‐rate support for gold), or diminished investor fear.
------------------------------------------------------------------------------------------
PhoenixFX price action analysis based on the Daily time frame
🔴 Primary Resistance (Daily)
Zone: $3,348 – $3,400
Why It Matters:
Multiple daily closes have stalled here, leaving a clear Fair-Value Gap (dashed purple). Sellers are likely to defend this range until we see a decisive daily close above $3,400.
📉 Bearish Bias – Short Setups
Short at Resistance
Entry: Bearish daily reversal candle (engulfing, pin-bar) in $3,348–$3,400
Targets:
TP1: $3,290 (50% of Primary Buy Zone)
TP2: $3,250 (Primary Buy Zone low)
TP3: $3,172 (Secondary Buy Zone high)
Stop-Loss: Above $3,420
Breakdown Short
Trigger: Daily close below $3,250 (Primary Buy Zone low)
Entry: On the open of the next daily candle after close below $3,250
Targets:
TP1: $3,172 (Secondary Buy Zone)
TP2: $3,026 (Final Buy Zone 50% level)
Stop-Loss: Above $3,290
🔵 Potential Long Opportunities
Defensive Long (Aggressive)
Entry: Bullish daily rejection candle in $3,250–$3,290
Targets:
TP1: $3,348 (short-term resistance)
TP2: $3,400 (key resistance)
Stop-Loss: Below $3,230
Trend-Reversal Long (Ultra-Conservative)
Trigger: Daily close above $3,400
Entry: Open of the next daily candle after the close above $3,400
Targets:
TP1: $3,450
TP2: $3,500+
Stop-Loss: Below $3,360
📊 Week-Ahead Scenarios
Bearish Scenario (High Probability):
Price remains capped under $3,400.
Look for a bearish signal in $3,348–$3,400 to initiate shorts.
A break below $3,250 extends the move into deeper demand zones ($3,172 → $3,026).
Bullish Counter-Trend (Lower Probability):
Strong daily rejection candle in $3,250–$3,290 could spark a relief rally.
Short-term longs can target $3,348 and $3,400—ideal for quick swing trades.
Only a sustained daily close above $3,400 shifts the bias back to the upside.
Just a Heads-Up:
This is my take on the charts—not gospel, not financial advice, and definitely not a crystal ball 🔮.
Trading is part skill, part patience, and part “what just happened?” 😅
We all see things a little differently, and that’s the beauty of it. So if you’ve got a hot take, wild theory, or just want to drop some chart wisdom—hit the comments!
Let’s grow, learn, and laugh through the madness together. 🚀📈
Each one, teach one.
— Phoenix FX Team 🔥🦅

NIFTY 50 CHART ANALYSIS INTRADAYHere I give you a chart analysis on Nifty 50 for 8th July 2025. intraday trend is neutral and
mid trend is Berish but price to shifted to bullish trend. let's see what will happen in upcoming days.

GBPJPY I Intraday Short from Top of the ChannelWelcome back! Let me know your thoughts in the comments!
** GBPJPY Analysis - Listen to video!

GBPUSD London Session | Live Forex Analysis & Trade ideasIn today’s London session, we conducted a detailed intraday analysis on the GBPUSD currency pair using wave structure analysis on the 5-minute (M5) timeframe.
Price action confirmed a break below bullish market structure that had previously formed the Asian session high, signalling a potential shift in market sentiment to the downside. This breakdown confirmed short-term bearish momentum shift.
Following the completion of the bearish wave, the price retraced to form a structural pullback (trend reset), providing a discounted price zone for new short positions and offering profit-taking opportunities for earlier sellers.
Our trading plan for this session is to sell GBPUSD at 1.3488, anticipating a move below the midline (ML) support at 1.3462. The technical target for this trade, based on our London-New York session projection, is set at 1.3417.
The stop-loss for this setup is placed above MH of the bearish structure at 1.3505, maintaining proper risk management.
This trade idea aligns with our trend-following strategy and is supported by real-time price action analysis.
📉 Short Bias Confirmed
🎯 Entry: 1.3488
🛑 Stop Loss: 1.3505
✅ Take Profit: 1.3417
Trade safe, manage your risk, and stay blessed.

RENDER Bounces from Strong Confluence Zone$RENDER/USDT Update
RENDER is holding well above the key support zone after a clean retest of the area of confluence.
What’s interesting here is that the old resistance has now flipped into support, this is often a strong bullish signal on higher timeframes.
Price bounced exactly where you’d expect, at the intersection of horizontal support and the rising trendline.
As long as RENDER continues to respect this zone, the structure remains bullish.
DYOR, NFA
Thanks for following along — stay tuned for more updates!

GOLD (XAUUSD) Full Analysis – MMC Strategy in Action + Target🧠 What is Mirror Market Concepts (MMC)?
MMC is a psychological and technical framework that interprets market movements as mirrors of past behaviors, often using curves, rays, and emotional imprints to forecast price flow. It assumes that price reacts not just to levels but to memory zones left by institutional actions.
🧭 Chart Overview and Interpretation
1. Black Mind Curve Resistance:
The black curved line represents a dynamic resistance zone where the market previously showed sensitivity.
It aligns with psychological levels where institutional interest faded, marking a high-probability rejection point.
Note the smooth arc — MMC suggests such curves reflect subconscious market resistance.
2. Blue Ray – Institutional Reaction Line:
The blue ray points to a previous impulsive reaction zone near 3,320, marking an emotional high.
Price sharply rejected this area again, creating a mirror rejection.
This symmetry is key in MMC — the present move is reflecting the structure of the past.
3. SR Interchange Zone (Support-turned-Resistance):
Around the 3,290 level, price previously bounced from this zone (demand), but it has now flipped to act as resistance.
This SR Interchange is significant in MMC as it represents a "mental switch" — demand has turned into fear-based supply.
4. Break of Market Structure + Retest:
A clean break below the short-term bullish trendline followed by a rejection retest confirms the shift in structure.
This breakdown confirms bears are in control for now.
The recent candles show clear rejection wicks from the retest zone.
🎯 Trade Plan (Bearish Setup)
Entry Zone:
🔹 Enter between 3,275 – 3,285, where price is rejecting the SR flip and mind curve.
Target Zone:
🎯 First TP: 3,250 (MMC Support Zone – highlighted in purple below)
🛑 Optional Second TP: 3,240 if momentum continues post-news event.
Stop Loss:
🔺 Above 3,300 to allow space for false spikes, just beyond the curve rejection zone.
📉 Why This Setup Works (Psychological Flow)
The current price action is mirroring the left side of the chart — the same way price impulsively rose from a zone, it's now impulsively falling back into it.
The rejection from the Black Curve and Blue Ray are not just technical — they are emotional resistance zones, meaning institutions remember the reaction.
This creates internal balance that MMC traders look to exploit, riding the memory of the market.
🔔 Risk Factors & Considerations
Watch for the USD-related news event on the calendar (noted on chart). If high-impact, it can cause volatility and short-term spikes.
If price breaks and holds above 3,300, the bearish idea becomes invalid — don’t fight the market.
🧵 MMC Concepts Highlighted in This Chart
Black Mind Curve Zone – Dynamic psychological resistance
Blue Ray – Emotional ray from institutional rejection
SR Interchange – Support becomes resistance
Mirror Symmetry – Price behavior is reflecting the past
Emotional Imprint Zones – Past reactions leave future footprints
🗨️ Community Call-to-Action (CTA)
💬 What’s your view on GOLD today? Are you using Mirror Market Concepts in your trading?
Drop your thoughts, charts, or alternate views below — let’s build solid MMC case studies together!

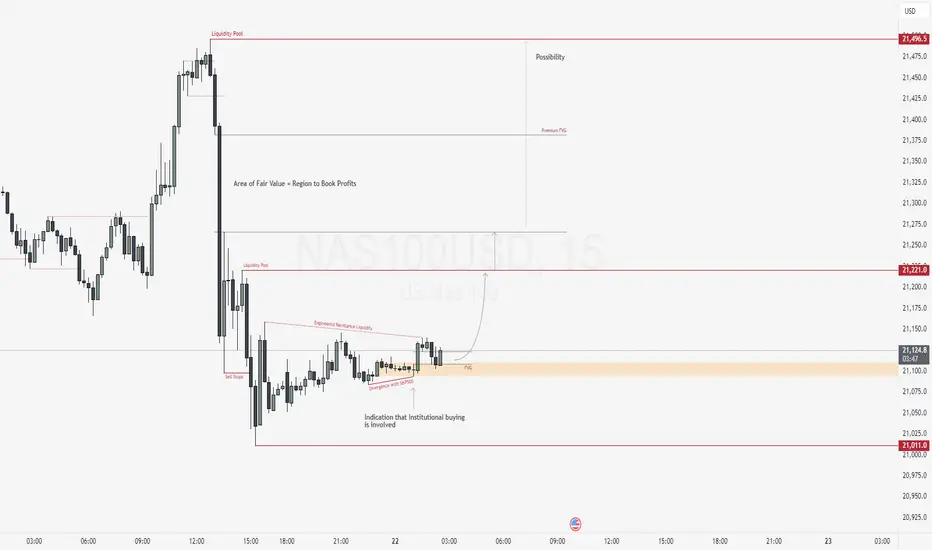
NAS100USD: SMT Divergence Signals Reversal from Discount PricingGreetings Traders,
In today’s analysis, we are closely monitoring NAS100USD for a potential reversal of bearish institutional order flow. While the broader trend has been bearish, current price action presents strong confluence for a bullish shift, suggesting an opportunity to align with a possible upside move.
Market Context:
NAS100USD is currently trading in deep discount territory, which historically presents favorable conditions for institutional accumulation. We’ve observed a liquidity sweep—price took out previous sell stops—suggesting institutions may have order-paired against willing sellers at these discounted levels.
Key Observations:
SMT Divergence with S&P500: While the S&P500 took out its previous low, NAS100USD remained above its corresponding low. This divergence signals underlying strength and institutional buying on NAS100USD, offering a strong indication of a reversal.
Bullish Structure Hints: Minor breaks in market structure to the upside are emerging, further validating the bullish narrative.
Institutional Support Zone: Price is currently trading inside a bullish order block that is also aligned with a Fair Value Gap (FVG)—a strong confluence zone that may act as support for continued upside movement.
Trading Strategy:
Await confirmation of support holding within the order block and FVG zone.
Target 1: Relatively equal highs just above current price action—an engineered liquidity pool where buy stops are likely resting.
Target 2: The premium FVG, a key area of institutional interest where longs accumulated at a discount will be offloaded for profit. The area of fair value is an region where the institutions start to book their profits.
By reading the divergence, price action, and institutional behavior, we can strategically position ourselves to capitalize on a high-probability reversal.
Happy Trading,
The Architect 🏛📊
PEL | Breakout Setup | Short-Term Buy | Target ₹1100🟩 Trade Plan:
Buy Zone: ₹1059 – ₹1060
Target: ₹1100 (approx. 3.77% upside)
Stop Loss: ₹1037
Risk-Reward Ratio: ~2:1
Setup Type: Breakout above resistance zone (marked on chart)
Volume Confirmation: Strong bullish candle with high volume
RSI Confirmation: RSI bouncing above 60, momentum building
📈 Chart Annotations (TradingView Tips):
Draw resistance zone on 1H around ₹1060 – ₹1070 (breakout zone)
Plot EMA (9 & 21) or EMA crossover to confirm short-term bullish trend
Use RSI (14) to highlight momentum breakout
Highlight entry point, stoploss, and target with labels
Use TradingView’s “Long Position Tool” to visually display RR
For Education Purposes only

Pullback's Almost Over — Get In Before It RunsThe best time to enter in a bull market is during a pullback — when price temporarily retraces before continuing its upward trend.
In the case of BINANCE:SUPERUSDT , price is currently pulling back into a demand zone between 0.7178 – 0.7109. The overall structure remains bullish, with the blue arrows showing a series of higher lows and the red arrows indicating higher highs.
We expect the price to bounce from this demand zone and potentially break the previous high, continuing the bullish trend.
To confirm the pullback is ending and a reversal is underway, we’ll watch for candlestick patterns. Here are two possible bullish confirmation scenarios:
Price breaks and closes above the high of the last red candle — a bullish engulfing setup.
Price dips deeper into the demand zone, then forms a bullish pattern such as:
Bullish Engulfing
Bullish Harami
Other reversal signals, like a close above the high of the previous two candles.
These are the scenarios I’m watching for on $SUPERUSDT.
Let me know your thoughts!

Gold Levels So Clean, They Might Just Slap Your Algo🔥 “Gold Levels So Clean, They Might Just Slap Your Algo 🤖💥”
📅 Daily XAUUSD Plan – April 23, 2025
🎯 Structure & Key Levels Only – Just Real Market Logic
🧭 MARKET CONTEXT
HTF Bias: Still bullish, but currently in corrective phase after blow-off at ATH
LTF Flow: Bearish (M30–H1 CHoCH + BOS confirm premium-to-discount transition)
Current Price: 3379
Macro: No major USD catalyst today – price driven by structure, liquidity, sentiment
🔻 SELL ZONES – PREMIUM
Zone Price Range Type Confluences
💣 3448–3455 Major HTF OB Zone Extension Trap Fibo 1.618 + Premium OB + Liquidity above Weak High
🧨 3415–3422 LTF OB + Trap Zone Retest Area Last mitigated OB + NY Session liquidity grab
⚠️ 3385–3395 Intraday Flip Zone Bull/Bear Pivot EMA5 Lock + Rejection Block + Mid-Structure Flip
🟢 BUY ZONES – DISCOUNT
Zone Price Range Type Confluences
🟢 3365–3372 LTF Demand Zone Current Price Demand + RSI bounce + Reaction Box
💚 3333–3340 Valid HTF OB High Confidence Unmitigated OB + HTF FVG + Historical Support
🔋 3284–3288 Sniper Reentry HTF Demand Base Previous buy zone + Structure Support + Clean OB
🧱 3220–3235 HTF Reversal Area Extreme Discount Long-term support + Weekly structure demand
🔍 STRATEGY INSIGHT
3385–3395 = the line between bull & bear → key for session reclaim or rejection
3415–3422 is the best intraday sell if price spikes fast — protect with structure
3333–3340 holds real weight → HTF bounce territory for potential reversal
If price nukes to 3284, expect serious buy interest (structure-supported reentry zone)
💬 Final words :
“Clean structure. Clean zones. Clean mind.
Gold doesn’t wait. Know your levels. React smart. 🧠✨
If this helped, drop a comment or follow – more sniper plans daily.”

Bitcoin Cash Bounces from $309 – Eyes on $500 and BeyondSET:BCH is showing a strong reversal from the long-term ascending support trendline, holding above a key zone around $309. This bounce aligns with a historical support level and confirms buyer interest.
The structure remains intact within a descending wedge, with a potential upside move toward the long-term resistance near $480–$500. As long as price holds above $309, momentum favors bulls, and a breakout could lead toward the $600–$1,200 zone mid-term.
DYOR, NFA

Why This Bearish Trend Is Actually a Bullish Opportunity?Understanding the Multi Timeframe Analysis – Part 1 of 2
Have you ever felt overwhelmed when using multiple timeframes in your analysis? Not sure which timeframes to choose or how to combine them effectively?
In this post, I’ll share my thoughts on how to use multi-timeframe analysis with real chart examples.
Let’s take a look at the movement from the first red and blue arrows – we can clearly see that buyers were not in control at that point. But if we compare it to the next red and blue arrows, it’s clear that buyers took control of the market.
This tells us something important:
➡️ The recent price drop from the last red arrow is likely just a corrective move, not a reversal.
Based on the 4-hour timeframe, we can identify the corrective target zone around 0.5593 - 0.5369.
So what’s next?
In smaller timeframes like the 1-hour chart, this corrective move might appear as a short-term bearish trend. But from a higher timeframe perspective, it’s just a pullback – and that can create an opportunity for a precise entry using a strategy like bottom fishing.
In the next post (Part 2), I’ll show you how this works on the 1-hour chart – including the before and after, and how I plan my entry.
Stay tuned!
Do you usually check the bigger timeframe before taking entries? Let me know your approach in the comments.

Scalping with ATM Options Using Candle + OI Confirmation!Hello Traders!
If you love quick entries and fast exits with defined logic, then ATM Option Scalping is your game. But scalping without confirmation often leads to stop-loss hits. That’s why combining candlestick structure with live Open Interest (OI) data gives you a serious edge. Let’s break down the exact setup I use to scalp with ATM options in Nifty & BankNifty .
Why ATM Options for Scalping?
Better Liquidity: ATM strikes have tight spreads and high volumes, making execution quick and efficient.
Quick Premium Movement: Even small index moves reflect fast in ATM premiums.
Less Theta Decay (Intraday): Within first half of day, theta doesn’t hurt much. Scalping avoids time decay traps.
Scalping Strategy: Candle + OI Confirmation
Step 1 – Watch 5-Min Candle Setup:
Look for strong breakout candles, bullish/bearish engulfing, or reversal candles at key zones like VWAP/PDH/PDL.
Step 2 – Confirm with OI Shift:
Check ATM strikes on option chain.
Put OI rising + Price sustaining = bullish confirmation.
Call OI rising + Price rejecting = bearish confirmation.
Step 3 – Take Trade in ATM Option:
Enter CE or PE near breakout candle close with proper SL below/above that candle.
Step 4 – Exit Fast (Scalp Mode):
Book partial profits at 30–40% or when next resistance/support is hit. Avoid overholding!
Bonus Risk Management Tips
Avoid Trading Near News or Events: OI gives false signals in high volatility zones.
1 Trade = 1 Risk Unit Only: Do not revenge trade. Scalping is about accuracy, not frequency.
Trade only when both candle + OI align: No confirmation = no entry.
Rahul’s Tip
Let the chart speak, but let the OI validate. When both agree — that’s where scalpers win big.
Conclusion
Scalping with ATM options using candle structure + OI shift is a powerful setup if executed with discipline. It’s fast, clean, and logical. Focus on 1–2 setups a day — and make them count.
Do you scalp ATM options? Share your entry rules or struggles in the comments below!

ONDO Range Play: Breakout Confirmed, Eyes on $1.20+ONDO/USDT – 2D Chart Analysis
ONDO has broken above a falling trendline while continuing to trade within a broader sideways range. The breakout occurred near the mid S/R zone around $0.90–$0.95, which is now acting as a potential pivot level.
The price is attempting to reclaim momentum after a period of lower highs and sideways compression. A sustained move above the mid-range could open the path toward the upper resistance zone near $1.20–$1.30. However, if the breakout fails and price falls back below $0.90, it may revisit the lower range support around $0.70.
This is a key zone to watch for continuation or rejection.
DYOR, NFA

BTCUSD Daily View Based on your 15-minute BTC/USD chart, here’s a structured technical analysis for **April 10, 2025**:
---
### 🧠 **Chart Breakdown**
- **Break of Structure (BOS)**: Bullish BOS occurred earlier, indicating short-term upward momentum.
- **Strong High**: Marked at **$83,568** — this is a **liquidity point** that could act as a magnet if bullish momentum resumes.
- **Weak Low Zone**: Around **$81,451** — a key liquidity area that might be swept before any significant move up.
- **Current Price**: **$81,814**, sitting just above the weak low zone and in a minor consolidation phase.
---
### 🔍 **Market Context**
- After a strong impulsive move up, BTC started pulling back with lower highs and lower lows, indicating **retracement** or **distribution**.
- The price is holding slightly above the weak low, meaning:
- Smart money may be trying to **trap shorts or induce longs** before a deeper sweep or reversal.
- There's potential for **liquidity sweep below $81,451** before heading back up to test the strong high ($83,568).
---
### 🔮 **Today's Bias: Neutral-to-Bullish (Scalp or Swing)**
#### 🎯 **Bullish Scenario (Preferred if $81,451 holds)**
- Price holds above or sweeps $81,451 and **reclaims the zone quickly**.
- Expect a bounce toward:
- **$82,500** (intermediate resistance)
- **$83,568** (strong high / liquidity target)
#### 🛑 **Bearish Scenario (Only if clean break below $81,451)**
- Price breaks and holds below **$81,451** → retest failure = bearish.
- Target downside levels:
- **$80,500**
- Potentially **$79,500** if momentum is strong.
---
### 🧭 **Action Plan for Today**
| Type | Strategy |
|-------------|----------------------------------------------------------|
| Intraday Long | Buy near $81,451 zone with tight SL below $81,200 |
| Confirmation Entry | Wait for 15m bullish engulfing / BOS above GETTEX:82K |
| Short Setup | Only valid on clear 15m breakdown + retest below $81,451 |
---

Learn 3 Best Time Frames for Day Trading Forex & Gold
If you want to day trade Forex & Gold, but you don't know what time frames you should use for chart analysis and trade execution, don't worry.
In this article, I prepared for you the list of best time frames for intraday trading and proven combinations for multiple time frame analysis.
For day trading forex with multiple time frame analysis, I recommend using these 3 time frames: daily, 1 hour, 30 minutes.
Daily Time Frame Analysis
The main time frame for day trading Forex is the daily.
It will be applied for the identification of significant support and resistance levels and the market trend.
You should find at least 2 supports that are below current prices and 2 resistances above.
In a bullish trend, supports will be applied for trend-following trading, the resistances - for trading against the trend.
That's the example of a proper daily time frame analysis on GBPCHF for day trading.
The pair is in an uptrend and 4 significant historic structures are underlined.
In a downtrend, a short from resistance will be a daytrade with the trend while a long from support will be against.
Look at GBPAUD. The market is bearish, and a structure analysis is executed.
Identified supports and resistances will provide the zones to trade from. You should let the price reach one of these areas and start analyzing lower time frames then.
Remember that counter trend trading setups always have lower accuracy and a profit potential. Your ability to properly recognize the market direction and the point that you are planning to open a position from will help you to correctly assess the winning chances and risks.
1H/30M Time Frames Analysis
These 2 time frames will be used for confirmations and entries.
What exactly should you look for?
It strictly depends on the rules of your strategy and trading style.
After a test of a resistance, one should wait for a clear sign of strength of the sellers : it can be based on technical indicators, candlestick, chart pattern, or something else.
For my day trading strategy, I prefer a price action based confirmation.
I wait for a formation of a bearish price action pattern on a resistance.
Look at GBPJPY on a daily. Being in an uptrend, the price is approaching a key resistance. From that, one can look for a day trade .
In that case, a price action signal is a double top pattern on 1H t.f and a violation of its neckline. That provides a nice confirmation to open a counter trend short trade.
Look at this retracement that followed then.
In this situation, there was no need to open 30 minutes chart because a signal was spotted on 1H.
I will show you when one should apply this t.f in another setup.
Once the price is on a key daily support, start looking for a bullish signal.
For me, it will be a bullish price action pattern.
USDCAD is in a strong bullish trend. The price tests a key support.
It can be a nice area for a day trade.
Opening an hourly chart, we can see no bullish pattern.
If so, open even lower time frame, quite often it will reveal hidden confirmations.
A bullish formation appeared on 30 minutes chart - a cup & handle.
Violation of its neckline is a strong day trading long signal.
Look how rapidly the price started to grow then.
In order to profitably day trade Forex, a single time frame analysis is not enough . Incorporation of 3 time frames: one daily and two intraday will help you to identify trading opportunities from safe places with the maximum reward potential.
❤️Please, support my work with like, thank you!❤️
I am part of Trade Nation's Influencer program and receive a monthly fee for using their TradingView charts in my analysis.
