NZDUSD 2H bullish reentry updateIf you took my setup on NZDUSD 2H bullish reentry please exit. Price obeyed my entry zone on 15M but it does not show any bullish momentum at that price zone so it'll most likely drop to go buy at a discount
Intradaytrading

Failed US100 setupHad posted this setup earlier but SL was hit though I had moved my SL lower. Still watching price action so that I can decide whether to close or hold

NZDUSD 2H bullish reentryNZDUSD still shows bullish momentum and has broken structure upwards on low timeframes. I believe that it has entered a consolidation range between 6288 and 6154 that we might take advantage of. My setup provides a 1:2 R:R bullish re-entry. NOTE: THIS SETUP DOES NOT GUARANTEE PRICE MOVEMENT. USE PROPER RISK MANAGEMENT

US100 1HFrom the setup I shared yesterday, Nasdaq obeyed our order block but price hasn't showed any bullish momentum. However, It has broken low time frame structure and created a new order block on 1H that we might use to take our buy chances. The setup holds up to 1:3 risk:reward. NOTE: PLEASE USE PROPER RISK MANAGEMENT AND NEVER RISK MORE THAN 2-4% OF YOUR EQUITY

NZDUSD 2H resultShared the setup yesterday. TP1 was already hit. Let's see how it'll play out. You can close or secure profits with SL if you intend to continue holding.

Gold 4H resultShared this gold setup yesterday and price obeyed the 4H order block to rally up. TP1 was realized. NOTE: ALWAYS APPLY PROPER RISK MANAGEMENT

ZYDUSLIFE LONG (INTRADY NOV 7)Hello TradingView community and my followers, please if you like the ideas, don't forget to support them with likes and comments, thank you very much and here we go.
.
ZYDUSLIFE is in uptrend on daily level and in 15 min it has made Ascending triangle pattern. now on breakout it could move upside. Thank You !

SANDUSDT - Price action UpdateHi there,
So many were calling for shorts and few were calling longs but in real what's gonna happen ? Well my answer no we can't say the least we can do is predict the possibility of happening but we can't sure it's gonna happen. So without any confirmations in price actions of the assets never take a trade based on the predetermined decisions, one must able to make decisions instantly according to changing conditions to be a successful trader.
Moving to analysis, here we are on SANDUSDT chart, what's the idea....
Well it's pretty simple the previous upward moment had been rejected from the resistance zone which is at $0.7941, so can we open short? well not so soon, let's draw out some pivot conditions to conclude our decision.
Volume : Well from the last three days the volume has been pretty much increasing and ofc volume during the rejection from it's resistance is also high.
RSI : well it's been in nice uptrend from the past three days, it oscillated between the range 40 -60, so it's too early to open short.
MACD : we can observe the downward strength is slowly decreasing, so yea definitely it's not the time to open short.
Resistance : $0.7941 has been acting as strong resistance unless it's got broken, we can't open long too.
Intraday Trade :
LTF - 5min : there's a pattern formation called descending triangle with local support $0.7671 - once it's broken we can open the short placing the target at $0.7948
Conclusion :
It's too soon to open short position we need to wait until the price heads to the range - $0.7845 to $0.7941 and got reject from there which is likely or to break the local support at $0.7671, so that we can open short. And if the resistance is broken we can draw constraints accordingly to go for long. Wait until the confirmation....Stay connected for updates and if any doubts comment in the comment section

Dollar Index Forecast (Intraday)We have a good amount of fundamentals coming this week ! We may see the dollar go back to its bullish ways since the saga on the federal rate hike is not over. Breaking down this analysis for educational purpose we can see a very clean bullish trend. Currently we did get a midsession reversal during the London session which could see us up for some buy opportunities in the New York Session.

EUR/USD Short 11/10/2022Intraday short, asian manipulation, BOS, 1:4 RR ratio. Volumes shift candle confimation. 1% risk as always, good luck

15 Min. Scalping Strategy I HIGH WIN RATE15 Min. Scalping & Intraday Strategy I HIGH WIN RATE - Live Demonstration in the Asian Session - USDJPY
About KiSS 2.0 Market Structure Method Trading Strategy:
1. It is a market structure based trading strategy (uses a naked chart and indicators for confluence)
2. Effective strategy for scalping and intraday trading
3. 93% win rate and its recommended to demo and record a minimum of 100-300 trades in a trading journal to find your unique edge
4. Use a unique risk management method to increase probability of wins
Please support this idea with a LIKE and COMMENT if you find it useful and Click "Follow" on our profile if you'd like these trade ideas delivered straight to your email in the future.
Thanks for your continued support!
Brian & Kenya Horton, BK Trading Academy

GBP/USD Long possibilityHello everyone,
I expect a long trade on this pair from the marked zones due to the collected liquidity from the recent fake OB and the formation of a new OB for 15 minutes, which I have marked with yellow.
In the case of arrival in a zone with a large volume of trade, it is not valid. In that case, I expect breaking through OB and getting to the next one.
1. Each of my analyses is a prediction of the market with what I see at the moment and is changeable during the day as the market reacts.
You decide on each trade and you are responsible for it.
Every trade idea needs care during the period when the trade is open and I do not open any trade with a pending order. Every trade I open with Market execution!!!
2. This trading idea is closely related to the DXY movement. I ask anyone who observes my trading ideas to follow DXY and therefore decide to enter the trade.

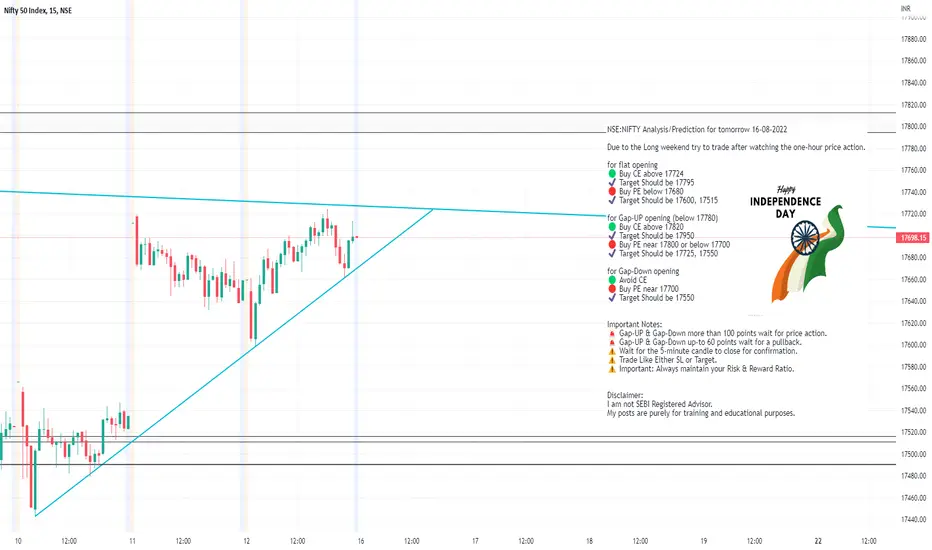
NSE:NIFTY Analysis/Prediction for tomorrow 16-08-2022NSE:NIFTY Analysis/Prediction for tomorrow 16-08-2022
Due to the Long weekend try to trade after watching the one-hour price action.
for flat opening
🟢 Buy CE above 17724
✔️ Target Should be 17795
🔴 Buy PE below 17680
✔️ Target Should be 17600, 17515
for Gap-UP opening (below 17780)
🟢 Buy CE above 17820
✔️ Target Should be 17950
🔴 Buy PE near 17800 or below 17700
✔️ Target Should be 17725, 17550
for Gap-Down opening
🟢 Avoid CE
🔴 Buy PE near 17700
✔️ Target Should be 17550
Important Notes:
🚨 Gap-UP & Gap-Down more than 100 points wait for price action.
🚨 Gap-UP & Gap-Down up-to 60 points wait for a pullback.
⚠️ Wait for the 5-minute candle to close for confirmation.
⚠️ Trade Like Either SL or Target.
⚠️ Important: Always maintain your Risk & Reward Ratio.
Disclaimer:
I am not SEBI Registered Advisor.
My posts are purely for training and educational purposes.
GOLD H1 Chart Analysis for 10th August 2022Gold is still in Ascending Channel for Intraday, but keep in mind today is the day of US CPI data.
I suggest you to keep an eye on data for further action !

Bitcoin Trend Analytics July 22 Yesterday BTC held the support and is ready to challenge the resistances above. The key resistance above is $24675.62. 2-week core resistance is at $28227.07.
The pull-back supports are between $22655.04-$22267.40. If these supports are not broken down, BTC will go up against the resistance above. If supports are broken, it will come back to consolidate.
The short-term supports are $21382; $20825.47. The key support of the month diverted to $18743.34.
Fed’s rate hike expectation: +75bp (72.7%) / +100bp (27.3%)
Previous stats: 1.75%; expected target rate: 2.5%-2.75%.

UNIUSDT Chart AnalysisWell how to start !! Everything is in green from the past few days so as UNI, it's in nice uptrend heading towards the resistance which is at around 6% above from here ( Resistance at $8.146).
Currently it's in middle of the river, so what to do now? IMO as $BTC is testing it's breakout zone, I see no reason to be bearish for short term atleast it doesn't mean that I'm suggesting you to go long here, you can trade UNI if you want but make sure you ready to take big risk cause may be the local support zone at $7.3 may hold but don't trade based on the expectations. Let the market to tell us what we need to do.
So what's next? My suggestion is to let it come to one of our zones, may be retracement towards $7.31 price zone, I'll update if I observe high interest there, with respect that you can plan your trade.
What if it headed towards straight away towards resistance well then we can observe again and based on the appearing interest at that time let's decide whether we have to be on long side or short side. See guys no need to rush planning is everything.
Disclaimer : Anything provided here are only my opinions and ideas. I am not giving any financial advices, trade at your risk.

0 lineIt is very important for bitcoin to cross the 0 line on MACD to change the bearish flag into a bull 🐂 run by the way if it fall again then the bitcoin will give us the real bottom.
Do scalping if you are good at scalping at current situation.
I would not suggest you the swing trading.
Make sure to manage your Risk.

Wait for the pull back Hi ĈŘŸPŤŌ traders
Bitcoin can toch 20250 at current volume
Again the main support is waiting for bitcoin at 19500/600
Wait for the super entry below 20000

Intraday & swing trade:- DeepakfertScalping Deepakfert
sell Deepakfert below 606
Target 600,594.
SL 607 (risk is 1 point)
If it falls it will touch the target within few minutes. so go with the momentum.
As on the chart, there is superb trendline support on the 1-hour chart. so, buy Deepakfert if it takes support above 608 for the target of 615, 625, 640,650 (Swing Trading).
For buying, you need to know price action & Candlestick analysis. If you find a proper set-up like hammer or dozi then take entry. It would be a significant risk: reward set up

US30 EXPECTED TO TRADE BEARISH INTRADAYHello traders, there has been a rejection at a supply on the us30, more bears are expected with target at 30700 price level intraday

GBPUSD buy opportunitywe have 2 way to buy gbpusd after it down to support level or after breakout 1.2340
our buy target
1- 2420
2- 2520

BITCOIN INTRADAY BULLbitcoin has been in a longterm drop. agressive correction expected. i expect an intaday bull correction to close the week. a break above 30290 price level should validate more bulls.

TODAY'S NATIONALUM - Intraday - Reversal Falling WedgeNATIONALUM - 15 MIN - REVERSAL FALLING WEDGE
Today's chart pattern analysis - target achieved.
TP - 1.25 and SL - 0.60
