Potential Bearish Setup for GBPUSDBearish Breakdown Setup
**Summary
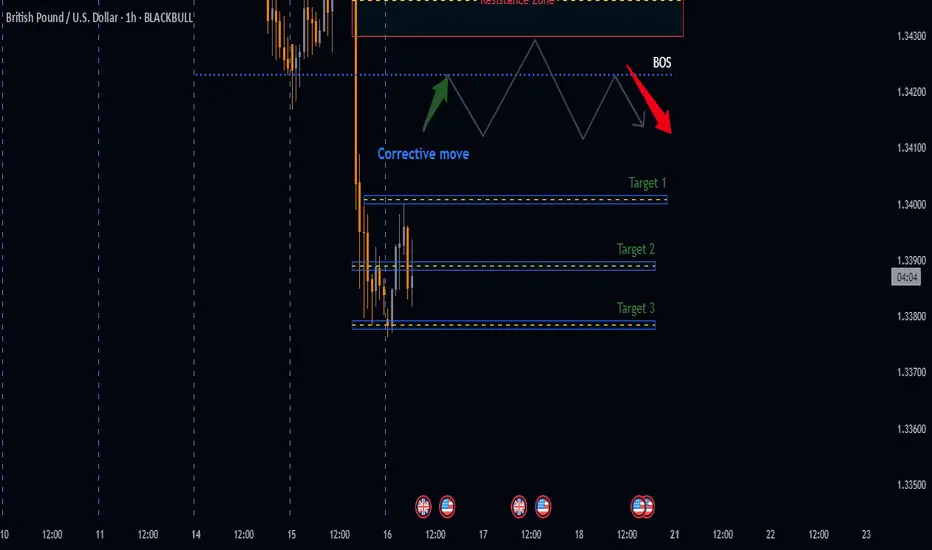
Analysing Price action from yesterday we have got a very nice distribution leg push that broke down below our accumulation zone a good indication of downside momentum, therefore the anticipation is that price will retest our BOS an ideal zone to look for bearish setups.
📉 GBPUSD Daily Breakdown Potential setup
🔴 Distribution leg: 1.34588 - 1.33785
📉 Sell level: 1.34230 (Confirmed Break)
🎯 Target 1: R:R 1:2
🎯 Target 2: R:R 1:3
🎯 Target 3: R:R 1:4
🛑 Stop Loss: Above Resistance Zone
🔍 Watch: Failure to break back in = Confirmation
LIKE or COMMENT if this idea sparks your interest, or share your thoughts below!
FOLLOW to keep up with fresh ideas.
Tidypips: "Keep It Clean, Trade Mean!"
Intradytrading
NIFTY INTRADAY LEVELS FOR 11/07/2024BUY ABOVE - 24350
SL - 24300
TARGETS - 24440,24500,24570
SELL BELOW - 24300
SL - 24350
TARGETS - 24230,24160,24060
NO TRADE ZONE - 24300 to 24350
Previous Day High - 24440
Previous Day Low - 24160
Based on price action major support & resistance's are here, the red lines acts as resistances, the green lines acts as supports. If the price breaks the support/resistance, it will move to the next support/resistance line. White lines indicates previous day high & low, high acts as a resistance & low acts as a support for next day.
Trendlines are also significant to price action. If the price is above/below the trendlines, can expect an UP/DOWN with aggressive move.
Please NOTE: this levels are for intraday trading only.
Disclaimer - All information on this page is for educational purposes only,
we are not SEBI Registered, Please consult a SEBI registered financial advisor for your financial matters before investing And taking any decision. We are not responsible for any profit/loss you made.
Request your support and engagement by liking and commenting & follow to provide encouragement
HAPPY TRADING 👍

Long setup H4 uptrend swing trade👋Hello Traders,
Our 🖥️ AI system detected that there is an ICT Long setup in USDCAD for scalping.
Please refer to the details Stop loss, FVG(Buy Zone),open for take profit.
For more ideas, you are welcome to visit our profile in tradingview.
Have a good day!
Please give this post a like if you like this kind of simple idea, your feedback will bring our signal to next better level, thanks for support!

XAU/USD 15 March 2024 Intraday AnalysisH4 Analysis:
Analysis/bias remains unchanged from yesterday's 14/03/2024) analysis
-> Swing: Bullish.
-> Internal: Bullish.
Price printed a swing BOS and subsequently a bullish iBOS.
Bearish CHoCH has been printed.
We are now trading within an internal range.
As mentioned 11/03/2024, bearish CHoCH, which is the first structural indication, but not confirmation that bearish pullback is underway, will indicate pullback initiation has now been printed.
Bearish iBOS will provide confirmation that pullback is underway.
Due to the bullish nature of the market, Intraday expectation is for price to target internal high, however, all HTF's are indicating the need for a pullback, therefore, a second potential scenario could be price targeting internal low to confirm pullback is now underway.
H4 Chart:
M15 Analysis:
-> Swing: Bullish.
-> Internal: Bearish.
Price has now printed a bearish iBOS which confirms comments made on 12 March 2024 that it would be useful to remember that all HTF's are requiring a pullback.
Price did try to target weak internal low, as per my comments made yesterda however, we saw price react at an M15 POI.
Intraday expectation is for price to react again at 50% EQ, which price is currently doing, or react in premium of 50% EQ, before targeting weak internal low.
M15 Chart:

USDCHF - SELLSELL USDCHF
setup based on my knowledge/analysis
I'M NOT RESPOSIBLE FOR ANY FINANCIAL LOSSES! THIS SETUP IS ONLY FOR EDUCATIONAL PURPOSE.
All The Best!

Homefirst Looking Bukllish Above 1167Homefirst Looking Bukllish Above 1167 will touch 1190-1230-1300 in coming days

pure price action.. rest all depends on sentiments.as we can witness the volatility are again high. uncertainty is again there in the market. all we have to maintain is our risk&reward ratio which is the only holy grail of the stock market. I will remain neutral. tomorrow and will see how the market will perform tommorrow.

chart itself telling us what to do......as we can see another beautiful chart pattern on nifty 50. although the market is full of negative news but this time i want to keep my bias neutral. I'm ready for both side opportunities . best of luck traders.

why i cant able to see any support..? I'm right that I cant figure out any support at those market levels. which means if it brokes its major levels it can fall down very quicly.
so my bias will remain short tomorrow.

not interested in going long r u..?well, my bias will remain short on bank nifty. not be interested in any buy signal tomorrow. we only will take action once our pattern is ready otherwise we will wait on the sidelines for an opportunity. no itchy trading.

important levels marked for bank niftyas u can see pure price action is on the charts. view for bank nifty will remain bullish for tommorw. do let me know your views guys.

another attempt to break the range will it break tomorrow..?as we can yet another attempt to break the main resistance. according to the option chain data market is likely to remain in this range. can't say much but will stay neutral until price action happens.

BE neutral till major levels are broken. levels markedas we can see technically. I'm worried about the sideways market tomorrow cause there are some major support&resistance levels are there. don't short or go long till the major levels are broken.

nothing else but pure price action ( important levels marked)will be another interesting morning tomorrow. important levels are marked. will follow market either short either long..
stay tuned

NIFTY LONG INTRADAY 9 AUG,2021Dear trader,
If u look at the chart of NIFTY (analysis based intraday only) the NIFTY support 1 at 16180 and support 2 at 16100 and resistance at 16360.
The chart clearly indicates Bullish Trend you can also see the candle stick patters for more indepth analysis.
In Intraday most important thing is to enter and exit points.
Our signals are based on analytics, algorithms, mathematical derivatives.
Always be a responsible trader, kindly trade only when you have maximum opportunity in the market with minimum risk and with keynotes like data, analysis and proper strategies.
Kindly message us for strategies and analysis.

AUDUSD MY TRADING PLANWe can see 4 hr trendline in downtrend , in one hr it showing a buy for me . But it is better to wait for that areas to break . after breaking the support or resistance we can expect a big move. maybe we can expect that on today or tomorrow.

NIFTY LONG INTRADAY 31 MAY,2021Dear trader,
If u look at the chart of NIFTY (analysis based intraday only) the NIFTY support 1 at 15380 and support 2 at 15300 and resistance at 15560.
The chart clearly indicates Bullish Trend you can also see the candle stick patters for more indepth analysis.
In Intraday most important thing is to enter and exit points.
Our signals are based on analytics, algorithms, mathematical derivatives.
Always be a responsible trader, kindly trade only when you have maximum opportunity in the market with minimum risk and with keynotes like data, analysis and proper strategies.
Kindly message us for strategies and analysis.

JSWSTEEL LONG INTRADAY 28 MAY,2021Dear trader,
If u look at the chart of JSWSTEEL (analysis based intraday only) the JSWSTEEL Buy at 680 and Target at 690
Best Buy at 678.
Our Best Buy is based on high quality research and when the instrument reaches this level , it’s a jackpot trade.
Best Buy level might be executed or might not be executed.
The chart clearly indicates Bullish Trend you can also see the candle stick patters for more indepth analysis.
In Intraday most important thing is to enter and exit points.
Our signals are based on analytics, algorithms, mathematical derivatives.
Always be a responsible trader, kindly trade only when you have maximum opportunity in the market with minimum risk and with keynotes like data, analysis and proper strategies.
Kindly message us for strategies and analysis.

CUMMINSIND LONG INTRADAY 8 APR,2021Dear trader,
If u look at the chart of CUMMINSIND (analysis based intraday only) the CUMMINSIND Buy at 901 and Target at 915
Best Buy at 895.
Our Best Buy is based on high quality research and when the instrument reaches this level , it’s a jackpot trade.
Best Buy level might be executed or might not be executed.
The chart clearly indicates Bullish Trend you can also see the candle stick patters for more indepth analysis.
In Intraday most important thing is to enter and exit points.
Our signals are based on analytics, algorithms, mathematical derivatives.
Always be a responsible trader, kindly trade only when you have maximum opportunity in the market with minimum risk and with keynotes like data, analysis and proper strategies.
Kindly message us for strategies and analysis.

SBIN INTRADAY 5 APR,2021Dear trader,
If u look at the chart of SBIN (analysis based intraday only) the SBIN support at 351 and Target at 346 and stop loss at 357.
The chart clearly indicates Bullish Trend you can also see the candle stick patters for more indepth analysis.
In Intraday most important thing is to enter and exit points.
Our signals are based on analytics, algorithms, mathematical derivatives.
Always be a responsible trader, kindly trade only when you have maximum opportunity in the market with minimum risk and with keynotes like data, analysis and proper strategies.
Kindly message us for strategies and analysis.

NIFTY LONG INTRADAY 1 APR,2021Dear trader,
If u look at the chart of NIFTY (analysis based intraday only) the NIFTY support 1 at 14780 and support 2 at 14700 and resistance at 14960.
The chart clearly indicates Bullish Trend you can also see the candle stick patters for more indepth analysis.
In Intraday most important thing is to enter and exit points.
Our signals are based on analytics, algorithms, mathematical derivatives.
Always be a responsible trader, kindly trade only when you have maximum opportunity in the market with minimum risk and with keynotes like data, analysis and proper strategies.
Kindly message us for strategies and analysis.

MINDAIND LONG INTRADAY 16 MAR,2021Dear trader,
If u look at the chart of MINDAIND (analysis based intraday only) the MINDAIND BUY around at 550 and TARGET at 565 and STOPLOSS at 540.
The chart clearly indicates Bullish Trend you can also see the candle stick patters for more indepth analysis.
In Intraday most important thing is to enter and exit points.
Our signals are based on analytics, algorithms, mathematical derivatives.
Always be a responsible trader, kindly trade only when you have maximum opportunity in the market with minimum risk and with keynotes like data, analysis and proper strategies.
Kindly message us for strategies and analysis.

Bank Nifty Intraday Trading SystemBank Nifty is extremely volatile index which comprises of 12 Banking Stocks.
It has the potential to give good profit if you can switch your positions swiftly when Bank Nifty suddenly changes its direction.
Many traders find it difficult to determine the current intraday trend of Bank Nifty and it is where a robust, and fast platform like TradingView.com coupled with Zeta Force indicator come to your rescue.
Zeta Force Indicator at TradingView.com is an invite-only indicator and when you apply this on your chart, it tracks all underlying stocks which are part of Bank Nifty, including swift changes in their volume and price every second. Whenever a sudden shift in the trend is seen, Zeta Force Indicator detects that and generates Buy or Sell Signals for you to follow.
In order to trade successfully with this system, a trader needs to follow 5-min. time frame for scalping and 10 or 15 Min. Time Frame for Bigger trades.
The system works like this: Once you see a 'Buy' Signal, take a 'Buy' position and hold it till either (1) you see an opposite signal (SELL in this case) or your Stop Loss or Trailing Stop Loss is hit. When you see an opposite signal, close your Buy position and take the 'Sell' position now and so on.
