Inverse relationship between DXY and BTCUSD coinbaseI'm a rookie at this but i have noted from several you tubers an inverse relationship between BTC and DXY (dollar index) as well as gold and silver with DXY. When playing with the chart and 1 hr candle sticks, i had DXY charted and then added BTCUSD from coinbase to compare. I zoomed in and out a bit but this pattern with about last 10 days shows interesting pattern. Since im a bit new, is this too specific of parameters or is this an indication of a good short term signal? If this pattern is good indication, seems like a good time to go long on BTC? Thanks all.
Inverse

10Y Yield vs GoldShould not be a surprising correlation as we are aware of gold & the 10Y from prior charts.

DXY vs. BTC Inverse correlation. BTC short setup for correctionAlong with many other indications that we may be due for bitcoin correction. He is a dollar btc comparison. With dollar nearing major support and BTC at resistance and looking like it might cool off. It is possible we have an inverse move to each other in the near or short term.
Targets for that are not exactly as where the arrows point at on the chart. and might be any of those levels if it were to play out within this month.

BVT - Inverse H&S long ideaInverted H&S on the hourly signals a long trade if it closes above R142. Full target is R154. Stop loss is a close below R138, then trend continues downwards.

SQQQ - This is where champions are madeSQQQ
- Currently sitting on the 1.618 (non-log) retracement from the last major swing low to high.
- RSI showing some macro divergences
- MACD as well
#NasdaqIsABubble

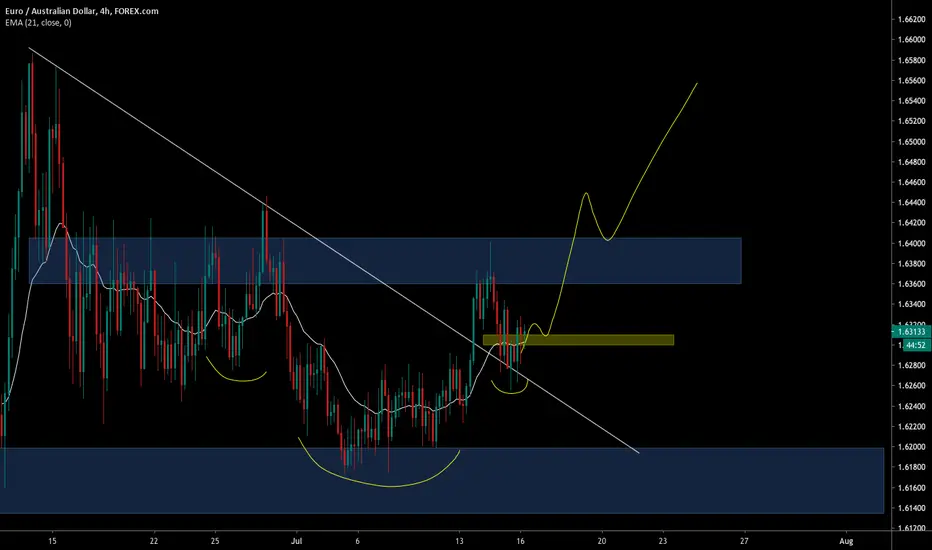
EURAUD broken triangle 🦐EURAUD broken triangle and is creating inverse head and shoulder on 4h structure, According to Plancton's strategy, we can set a nice order
–––––
Follow the Shrimp 🦐
Here is the Plancton0618 technical analysis, please comment below if you have any question.
The ENTRY in the market will be taken only if the condition of Plancton0618 strategy will trigger.
GBPNZD two possible scenariostwo possible scenarios on GBPNZD, let's see which one is going to get activated first and we will act accordingly.

$ES_F inverse h&s gap fill then dump$SPY $SPX $ES_F $QQQ $AAPL -- $ES_F looks to me as if $ES_F will inverse H&S into a gap fill and then dump bigtime afterwards.

#IDBIbank - Inverse head&shoulderpossible inverse head & shoulder in the making with right shoulder forming at .618 fib retracement of recent move, will enter this setup if get the PA I want, keep you guys posted in time line
Flipping the RED box/ Red Resistance line will be super bullish & invalidate the H&S so keen an eye on that resistance

EJTF: 2 Hr
Possible inverse H and S on the 2 hr and 4 hr TFs. Bullish divergence can be seen developing on the RSI and price has retraced and is currently trading in the golden zone (between the 0.50 and 0.618 levels).
May be see some buying here to complete the right shoulder and move up from there to ~123.
See my previous EJ forecast here:

$ES_F prediction$SPX $SPY $QQQ $NQ_F $AAPL -- the bear flag on the $ES_F 15 min chart broke down and is now forming an inverse head and shoulders. My guess is that it will likely inverse back towards that bear flag channel maybe re enter for a bit but ultimately it will reject one of the two channel lines and reverse imo.

Waiting for the "parabol" to ring & I wonder where she's been...The Inverse Parabol:
TIP is based on a reinterpretation of some parabolic basic chart patterns.
Hope you enjoy!!
Love & Good Luck, guys! Hard times are coming after the recovery... ;-(

INVERSE XRP INCOMING DROPthis long drawn out battle with .175 does not bode well for inverse XRP
currently below/above/below?/above? the 100 MA
the price action is looking more and more like a drop to the 2.75 is imminent
and if the 2.75 does not hold then watch out!

INVERSE DGB FALLING TO .05in this inverse view of DGB it is clear that many support levels have been lost
the price could not hold on to the channel bottom or the support at .165
if it cannot get back above .165 the unfortunate next support is .05
we can only wait and see if it holds
crashing upwards


SCOlooking at SCO for an entry around $16, not sure if this inverse WTI ETF will make it all the way down to the bottom of my triangle, but I will be monitoring this chart going forward as I think WTI
will most likely go negative futures again soon.

[XAUUSD] Buy Idea. Inverse head & shoulderAfter the wick rejection at the support zone, I believed gold will trend up towards the last resistance zone. Simple but profitable. You can catch buys anywhere between the two zone, as price makes it's way back up.

WES - Potential Inverse H+S - $9.00 TargetQuick pattern update here.
WES appears to have an Inverse H+S pattern forming on the lower timeframe.
A clean break from the pattern would target the $9.30 range, setting a conservative exit, with a close below the purported right shoulder would minimize potential for losses.
WES has been one on my list for a while lately and I recently closed a position for over 170% gain.
The news surrounding oil prices is negative, however WES is a refiner not a producer, so WES, if anything would have benefited (in the short-term) with the negative May contract prices.
I may look to do a more detailed write up on WES in the coming day or so, concerning position details.
-TradingEdge

How I Knew SPY Is Gonna Drop Today (VIX Magic!)Hi traders,
yes yes, the title is a little bit click-baity, but to be honest, SPY down was about an 80% probability for me today.
Now to be fair, I've been expecting this move lower for over a week now, so plenty of factors surely played their roles, but as soon as I saw VIX close out in a 1-2-3 Low formation yesterday (Monday), I had that final confirmation today is the day.
For beginners, VIX is what traders call a "Fear Index". Put plainly it takes into consideration markets' volatility, options volume ratios (whether there are more than usual people hedging) and gauges a "level of panic" traders are currently showing with their actions.
Its history is shown in the chart and therefore we can look for our standard patterns! Being inverted (High VIX values mean more fear and likelihood of markets crashing), a bottoming pattern such as 1-2-3 Low which appeared yesterday signalizes possible SPY reversal down.
And that's it!
Hope you learned something and be safe.
Tom | FINEIGHT

SH Hedge portfolio? GREEN OR RED?AMEX:SH This is an inverse ETF that is relatively safe. Do your research, but I am adding this to my portfolio as a small hedge. Green or RED to me doesn't really matter...at the least, it'll smooth some volatility out of my portfolio. IF YOU READ THIS, FOLLOW ME


Inverse Eve and Eve double top correctionExample of an inverse Eve and Eve double top correction, like an Eve and Eve double bottom which is a bullish reversal pattern, simply the opposite! A correction can be already seen to be underway.
