Understanding the Inverted Cup and Handle Chart PatternUnderstanding the Inverted Cup and Handle Chart Pattern
Understanding chart patterns is fundamental for market participants. This article delves into the inverted cup and handle formation, a bearish signal indicating a potential downward movement. Explore its identification, trading strategies, psychological underpinnings, common pitfalls, and more to boost your trading knowledge.
What Is the Inverted Cup and Handle Pattern?
The inverted cup and handle, sometimes called an upside-down cup and handle pattern, is a bearish chart pattern that may appear during up- and downtrends. It is the opposite of the traditional cup and handle pattern, which is bullish. The inverse formation consists of two main parts: the "cup," which is an inverted U-shape, and the "handle," a small upward retracement following the cup.
Identifying the Inverted Cup and Handle Pattern
Identifying the inverse cup and handle pattern involves recognising a specific sequence of market movements that signal a potential bearish move. Here's a step-by-step overview of identifying this formation:
Cup Formation
- Shape: The pattern begins with an inverted U-shaped "cup." The price gradually rises, consolidates, and then begins to decline, reflecting a shift from bullish to bearish sentiment.
- Depth: The cup should have a rounded top, not a sharp V-shape, indicating a gradual reversal. The depth of the cup can vary but typically represents a significant portion of the preceding movement.
Handle Formation
- Upward Retracement: After the cup's formation, prices usually experience a minor upward retracement or consolidation, forming the "handle." This movement should be relatively short and not exceed the initial high of the cup.
- Shape and Duration: The handle often appears as a small flag or pennant and should be brief in duration compared to the cup. An optimal handle retraces no more than half of the cup’s depth.
Breakout Confirmation
- Neckline Break: The pattern is confirmed when prices break below the neckline, the lowest point of the handle. This breakout often leads to a significant decline in prices, signalling a bearish trend.
- Volume Surge: Volume typically decreases during the formation of the cup and increases as prices decline, especially during the handle formation. A substantial increase in volume during the breakout can validate the pattern and minimise the risk of false signals.
The Psychology of the Inverted Cup and Handle
The psychology behind the inverse cup and handle pattern is rooted in market sentiment and behavioural finance. This bearish pattern reflects a shift from optimism to pessimism among traders.
- Initial Uptrend: The formation starts with an upward movement, where traders are generally bullish, driving prices higher. This phase is marked by growing confidence and increasing demand.
- Formation of the Cup: As prices peak, consolidate, and start to decline, some traders begin to take profits, leading to reduced buying pressure. The rounded decline of the cup signifies a gradual shift in sentiment from bullish to bearish as traders become cautious and selling pressure mounts.
- Handle Formation: The minor upward retracement forming the handle indicates a brief period of consolidation where the market tests the resolve of buyers. It can be considered a dead cat bounce. This phase often traps optimistic traders who expect the uptrend to resume, but the overall sentiment remains fragile and cautious.
- Breakout and Decline: The decisive break below the neckline represents a culmination of bearish sentiment. At this point, selling pressure overwhelms any remaining bullishness, leading to a sharp decline. The volume surge during this breakout confirms the shift in market psychology from hopeful to bearish as traders rush to exit their positions or initiate short sales.
Trading the Inverted Cup and Handle Pattern
Trading the inverted cup and handle pattern involves careful identification and strategic decision-making to maximise potential returns. This pattern presents two primary entry points for traders: during the handle formation or after the neckline break.
Entry on the Break of the Handle
- Risk-Reward Advantage: Entering on the breakout of the handle’s lower boundary offers a better risk-to-reward ratio but requires more skill and confidence in pattern recognition.
- Technical Tools: Traders often use a medium-term moving average (like 21 periods) to confirm the downward leg of the handle. A decisive close below the moving average indicates a continuation of the downward handle leg.
- Momentum Indicators: Using momentum indicators like the RSI (Relative Strength Index) or stochastic oscillator helps confirm downward movement. Bearish divergence suggests that the bearish trend is likely to continue.
- Volume Analysis: Increasing volume during the handle's breakout indicates strengthening seller control. High volume often validates the pattern and potentially reduces the risk of false signals. Note that volume data may be less reliable in a decentralised forex market.
- Stop Loss and Profit Target: Traders typically place a stop loss above the handle's high to potentially protect against upward spikes. The reverse cup and handle pattern target is usually set at a distance equal to the cup's height, projected downward from the handle's breakout point, although it can be greater if the retracement is particularly shallow.
Entry After the Neckline Break
- Confirmation Advantage: Waiting for the neckline break offers greater confirmation of the formation but may provide a less favourable risk-to-reward ratio.
- Price Action: A decisive close below the pattern's low, ideally with a strong candlestick and minimal wicks, indicates a reliable breakout. This typically confirms the bearish trend and provides a clear entry signal.
- Volume Confirmation: Higher volume during the neckline break can further validate the pattern and indicate that the breakout is genuine and not a false signal.
- Stop Loss and Profit Target: In this scenario, the stop loss is typically set above the handle's high. The profit target remains the same, projecting the cup's height downward from the breakout point.
Common Mistakes to Avoid
When trading the upside-down cup and handle pattern, avoiding common mistakes is key for maximising potential returns. Some of the more common mistakes traders make include:
- Premature Entry: Entering a trade too early, before the handle completes or the neckline breaks, can lead to false signals and losses. Most traders wait for clear confirmation, such as a decisive close below the neckline with increased volume.
- Ignoring Volume: Volume is a critical component in confirming the pattern. Low volume during the breakout phase may indicate a fakeout. Traders typically look for a substantial increase in volume to validate the pattern.
- Incorrect Pattern Identification: Misidentifying the pattern is a common error. The cup should have a rounded bottom, not a sharp V-shape, and the handle should be relatively short. Accurate identification requires practice and attention to detail.
- Overlooking Market Conditions: External factors, such as news events or broader market trends, can impact the pattern’s reliability. Traders consider these conditions when planning their trades.
Advantages and Disadvantages
As with all chart patterns, the inverted cup and handle pattern comes with its pros and cons. Here are some key advantages and disadvantages of using this pattern:
Advantages
- Clear Signal: The pattern provides a clear signal of a potential bearish movement, helping traders anticipate market declines.
- Risk Management: With defined entry and exit points (handle high for stop loss and cup depth for profit target), it aids in effective risk management.
- Flexibility in Analysis: Several forms of analysis, from support/resistance and momentum indicators to volume and price action, can be used to trade the pattern.
- Versatility: Applicable across various timeframes and markets, including stocks, forex, and commodities, making it a versatile tool for different trading strategies.
Disadvantages
- Complex Identification: Accurately identifying the pattern can be challenging, requiring significant experience and skill.
- Rarity: The pattern doesn’t occur frequently, limiting trading opportunities.
- False Breakouts: Like all chart patterns, it is susceptible to false breakouts, especially if not confirmed with volume and other technical indicators.
- Timing Sensitivity: Entering too early during the handle formation can result in premature positions, while waiting for the neckline break might reduce the risk-to-reward ratio.
The Bottom Line
The inverted cup and handle pattern is one of the most popular chart patterns among traders of all levels. However, like any technical formation, it should be used alongside other indicators and sound risk management to potentially increase its effectiveness. By mastering patterns like the inverted cup and handle, traders can gain deeper insights into market psychology and price action to navigate volatile markets with greater confidence.
FAQ
What Is the Inverse Cup and Handle Pattern in Forex?
The inverse cup and handle pattern in forex is a bearish chart pattern. It features an inverted U-shaped cup followed by a small upward retracement (the handle). This pattern suggests that sellers are gaining control, and prices are likely to decline further once the neckline is broken.
How Can You Trade the Inverse Cup and Handle?
Traders can enter positions either on the break of the handle’s lower boundary or after the neckline break. Entering during the handle might offer a better risk-to-reward ratio, while waiting for the neckline break provides greater confirmation. Key tools to validate the breakout include moving averages, momentum indicators like RSI or stochastic oscillator, and volume analysis.
What Happens After the Reverse Cup and Handle Pattern?
After the reverse cup and handle pattern is completed, the price typically moves downward strongly. This bearish movement is often confirmed by a strong breakout below the neckline with increased volume, signalling a sustained decline in prices.
What Is the Opposite of the Cup and Handle?
The opposite of a cup and handle is the inverse cup and handle pattern. While the cup and handle indicates a bullish movement, the inverse version signals a bearish trend.
Is the Inverted Cup and Handle Bullish or Bearish?
The inverted cup and handle pattern is bearish. It indicates that the price will move downwards, suggesting that traders may open short trades.
This article represents the opinion of the Companies operating under the FXOpen brand only. It is not to be construed as an offer, solicitation, or recommendation with respect to products and services provided by the Companies operating under the FXOpen brand, nor is it to be considered financial advice.
Inversecupandhandle

AGIX CUP AND HANDLE: UPCOMING BEARISH MOVE OR ANOTHER ATH HIT?The main headline of the price movement for BINANCE:AGIXUSDT is reaching its all-time high several days ago. Forming an inverse cup and handle pattern (or a head and shoulders), citing a possible bearish move for AGIX. But could it happen or will there be another all-time high for the coin as well as price and trendlines to watch out for in my full technical analysis on this idea thread below. Stay tuned and happy trading :)
For more info related on AGIX: www.ccn.com

GPSWhat are our thoughts?
@ $14 would be a nice discounted rate!?
Short term bearish
Long term bullish
*Trade at your own risk
*Self-taught trader 4+ yrs in the markets

MAR Short idea - Inverse Cup And HandleMAR just formed a beautiful inverted Cup and Handle pattern.
Once 190 breaks, a deep volume shelf break, free fall upto 175, which is the next volume shelf
Downside Target 175.

Amazon in dangerous territory here. Brown trendline represents the head and shoulder neckline. Yellow neckline is the rimline of an inverted cup and handle. Both essentially have the same breakdown target. Price needs to get above these trendlines soon to avoid triggering the breakdown.

BAND USDT inverted cup and handle pattern 1 Hr TF. BINANCE:BANDUSDT As per my analysis, an inverted cup and handle pattern was formed in 1 hour of time.

Sushi USDT Inverse Cup And Handle Pattern Formation in 1 HR TF. BINANCE:SUSHIUSDT Sushi USDT Inverse Cup And Handle Pattern is formed 1 HR Time Frame. This TA based on my analysis of the market and trading strategy.
Therefore, it is recommended that DYOR before any decision.

SGDJPY INVERSE CUP & HANDLE PATTERNIts showing inverse cup and handle pattern so we set sell stop according to trade plan given below
Inverse Cup & handle
Entry Price/Sell Stop: 97.572
Stop Loss: 98.388
TP1: 96.705
TP2:95.889
Risk Reward: 1:1

HIGHUSDT wants the breakout?HIGHUSDT recently bounced on the 0.786 Fibonacci level, indicating a potential reversal in the market. Additionally, on the 4-hour timeframe, an inverse head and shoulders pattern is being formed, which is a bullish signal.
An inverse head and shoulders pattern is a technical analysis pattern that typically forms after a downtrend and signals a potential trend reversal to the upside. It consists of three troughs, with the middle trough being the lowest, and the two outer troughs being higher. The middle trough is called the "head," and the outer troughs are called the "shoulders." The pattern is considered complete when the price breaks above the neckline, which is a level of resistance connecting the two outer troughs.
In this case, the market is creating an inverse head and shoulders pattern on the 4-hour timeframe, with the neckline at the 2.76$ area. If the price breaks above this level, it could signal a bullish trend continuation, and traders could look for new long positions.
–––––
Follow the Shrimp 🦐
Keep in mind.
🟣 Purple structure -> Monthly structure.
🔴 Red structure -> Weekly structure.
🔵 Blue structure -> Daily structure.
🟡 Yellow structure -> 4h structure.
⚫️ Black structure -> <= 1h structure.
Follow the Shrimp 🦐

1INCHUSDT is testing the previous Lows!the price is creating an inverse head and shoulders on daily timeframe
And now the price is testing the previous lows as resistance.
An inverse head and shoulders pattern is a bullish reversal pattern that is formed after a downtrend. It consists of a left shoulder, a head, and a right shoulder, with the head being the lowest point and the shoulders being peaks that are roughly at the same level. The pattern is considered complete when the price breaks above the "neckline," which is the level that connects the peaks of the two shoulders. This pattern suggests that the trend is reversing and that the price is likely to rise in the future.
What's next?
We are waiting for the breakout and retest the previous resistance as new support, According to Plancton's strategy , we can set a nice order
–––––
Keep in mind.
🟣 Purple structure -> Monthly structure.
🔴 Red structure -> Weekly structure.
🔵 Blue structure -> Daily structure.
🟡 Yellow structure -> 4h structure.
⚫️ black structure -> <= 1h structure.
–––––
Follow the Shrimp 🦐

TLMUSDT inverse head and shouldersThe price is testing the neckline of the inverse head and shoulders.
The price created the rounded bottom pattern as well.
How to approach it?
the price needs to create a breakout from the neckline with volume and retest it as new support, so According to Plancton's strategy , we can set a nice order
–––––
Keep in mind.
🟣 Purple structure -> Monthly structure.
🔴 Red structure -> Weekly structure.
🔵 Blue structure -> Daily structure.
🟡 Yellow structure -> 4h structure.
⚫️ black structure -> <= 1h structure.
–––––
Follow the Shrimp 🦐

AUDUSD: Bearish 5-0 on Quarterly Timeframe Seaking 50% DeclineAUDUSD has this strange Inverse Cup with Handle / Bearish Head And Shoulders sorta look to it, but more clearly, it has formed a very real Massive Bearish 5-0 that has been in the making for many years and it has recently tested the PCZ as resistance at the 50% retrace and confirmed it with huge amounts of MACD Hidden Bearish Divergence. If this plays out fully, then we can expect that the Australian Dollar to lose well over 50% of its value from here out.

AAPL - Going ShortThe break out of an inverse cup and handle pattern as well as formation of lower highs is a strong indication for continuation of bearish rally uptill 133 resistance level.
Sellers are advised to watch for a bearish closing of this hour before going short in this stock.

BTC in compression
We are amid a double-bottom rebound in the short-term timeframe, which looks like a triple-bottom pattern that reminds us of the inverse head and shoulders.
Nevertheless, the chart is moving slowly. Why is this? At least the arc answers. We are in the middle of a compression. Where does the compressed energy go?
Let's look to the left here. Even conservatively, symmetrical and descending triangles are formed, and if we do a more non-standard pattern fitting, is this an inverse cup & handle? If so, it's odd that the decline stops where the top of the green box indicates.
By the way, the chart has long respected the gray arc. It seems to be wobbling around, but if BTC turns around and resumes its dismal gray or monotonous decline, we should still see the bottom below.
However, one never knows what will happen in the market. Let's keep an eye on the compression ahead.
*Hate comments or meaningless criticism are not welcomed but will be immediately reported.
For those who hate arcs but like more standard analysis, see my previous idea .


WATCH $MDRX Bearish
- Inverse HS
- Inverse Cup and handle
- Broke upward trend
- Price at major S/R level / neckline
“Failure is simply an opportunity to begin again, this time more intelligently.”

WATCH $BLKBearish
Too big to fail ?
- Inverse HS
- Double tops
- Inverse Cup and handle
- Price at major S/R level
“We are what we repeatedly do. Excellence, therefore, is not an act, but a habit.”

WATCH $ACIBearish
- Double tops
- Inverse head and shoulders
- Inverse cup and handle
- Bear flag
- Broke down neckline
- Broke down trend line
Everything bearish appeared here.
“A quitter never wins and a winner never quits.”

Inverse Cup and Handle Spotted on EthereumTBH Traders, Ethereum is not looking good right now from a technical standpoint:
#1 - Still haven't reached the target down area from the larger H&S pattern
#2 - Trend is still overall downward
#3 - Inverse Cup and Handle Pattern now formed
We are currently sitting on critical support which is also the neckline of the inverse C&H. If that breaks, target down area is at least $1000. Watch this closely!
Stew

$BTC Inverse Cup and HandleBitcoin COINBASE:BTCUSD - 2x-Inverse Cup and Handle - Possible? Yes. Likely? Nah, but it would be a ride. I would only expect it to happen to lockup funds ready on the sidelines. I would expect a quick drop down and just a quick of a bounce back up to the 17500 range. This would tie up capital and allow for a wider range of sideways action heading into a new quarter, which is expected to be all thats left before a terrible Q4.

SPX - 4100SPX idea
SPX is trying to hold above 4100
SMA 10&50 have crossed down on the 30min
emas 9,21,50 are very close together and could cross down soon.
looks like rising wedge and Inverse Cup and Handle IMO
trying to use wave(dont follow)
-Xeno

KCSUSDT is ready to go higher! 🔥
KCS is on flames! From my previous idea,() the price had more than 12% and now it testing the new resistance after the breakout from the descending weekly channel.
Now the price is testing the previous resistance as new support.
How to approach?
We are waiting for the new breakout from the 22$ level and if the price is going to satisfy our rules, we could open a new long position. Next resistance is on 23.5$
What's new on KCS?
The Burning Program is a bullish event!
Known as the "People's Exchange", KuCoin is a Top 5 Crypto Trading platform
with over 600 coins and 10+ million users.
KCC is a public chain project initiated and built by the developer community of
KCS and KuCoin that aims to solve the network latency and high gas fee of
Ethereum.
KCS is the native token of KuCoin Exchange and KCC.
As the KCS whitepaper was released, the new era of KCS is dawning.
With the vision of "from geeks to mass adoption", KCS is building a
blockchain-based value sell-circulation ecosystem.
KCS will redistribute the 90 million KCS locked at the time of issuance, from
which 20 million KCS will be directly burned.
KCS will connect the world of both centralization and decentralization and will
build a Web 3.0 ecosystem.
KCS Management Foundation is established to empower the KCC ecosystem.
–––––
Follow the Shrimp 🦐
Keep in mind.
🟣 Purple structure -> Monthly structure.
🔴 Red structure -> Weekly structure.
🔵 Blue structure -> Daily structure.
🟡 Yellow structure -> 4h structure.

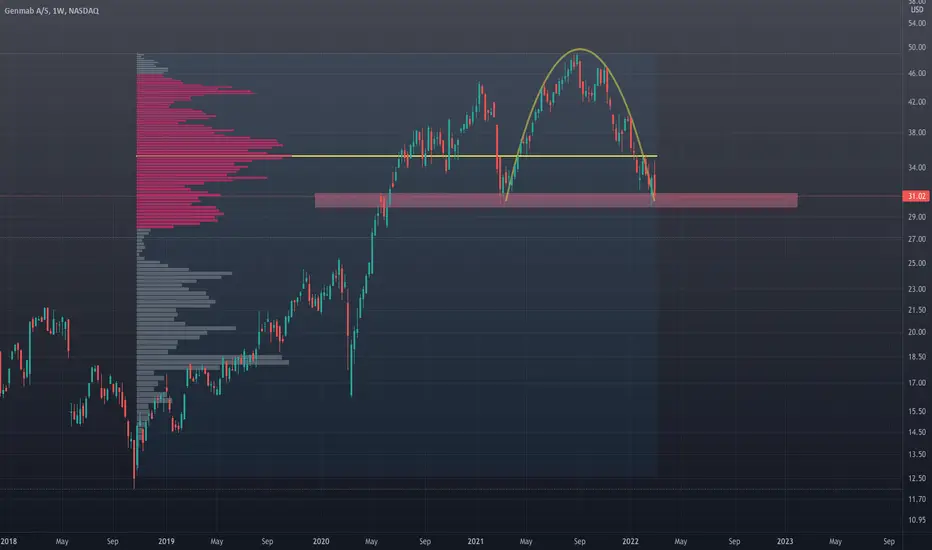
Inverse Cup and handle on the weekly $GMABInverse Cup and handle on the weekly $GMAB
- Inverse Cup and handle on the weekly
- VPVR acting as resistance
- Waiting for a trigger