Inverted H&S PatternThis is an inverted Head and Shoulders pattern
Left Shoulder
Head
Right Shoulder
Demonstrative piece
Inverse Head and Shoulders
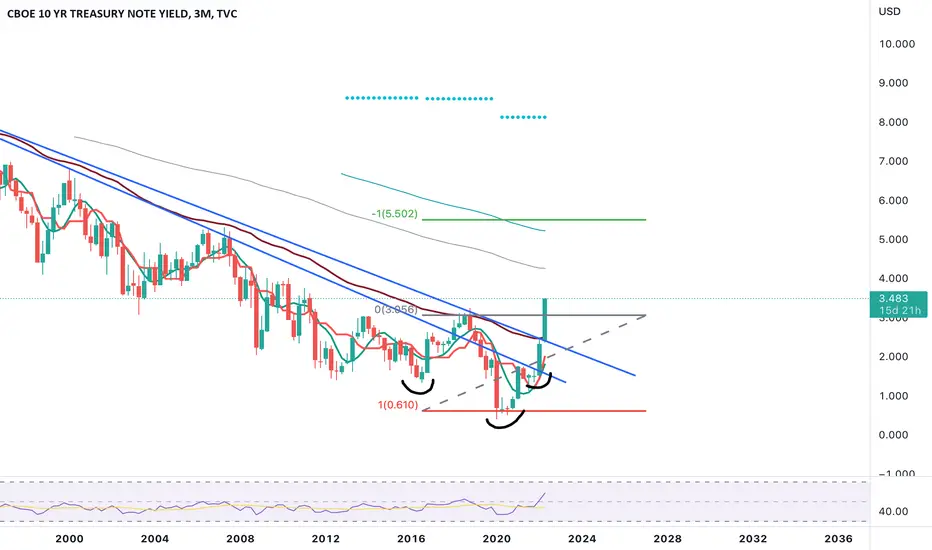
TNX-The chart you should be following very, very closely!!!I posted about TNX at the end of March and warned that we were in unchartered territory. At that time, TNX had bullishly crossed the monthly cloud which was something it had not done during my lifetime nor probably most traders lifetimes.
We are just about to quarter's end (June 30th) and you can see a clear breakout on an Inverse H&S is occurring. I see nothing but tailwinds for this chart within the next 2 weeks so I don't see how we don't close the quarter above 3.056. The measured move implies a target on TNX of 5.502 with the ability to "wick" above to 6%. Debt is becoming more & more expensive by the quarter and it's all happening very, very quickly.
In addition, have a look at the quarterly charts of Wheat, Rice, Soy, Corn & Oil...all of them look to be either breaking out on the quarter or they are just bullish AF.
Inflation, as it relates to what is most essential in life, has not peaked...
GBPJPY BUYhello friend,
i thin some timen GBPJPY is BUY.
you can enter now.
keep in touch.
thank you.

RATCH| Elliott Wave Projection | Inverted H&S Reversal Pattern Price action and chart pattern trading setup
> Elliott Wave projection - downtrend final correction position with an expanding diagonal pattern.
> Inverted head & shoulders reversal pattern in TFD with bullish engulfing candlestick
> Indicator: RSI strong bullish signal cross above MA and MACD golden cross signal line
> Entry @ Neckline breakout
> Stoploss @ right shoulder position
> Target @ previous wave 4 and 2
> RRR: 2:1 with -5% downside risk

Inverse Head and Shoulders Pattern in Swerve (SWRV) Hello Traders,
As you can see in Daily time frame, Swerve ( OKEX:SWRVUSDT ) is forming inverse head & shoulders pattern. If this pattern plays out then we can expect around 300% profit, because it is good to exit near $1 as it is psychologically important price.
Remember this is a higher time frame trade and SWRV may take weeks for breakout, be patient.
Also don't forget to manage your risk, if overall market turns bearish we has to book loss.
Leave your opinion in comment section. Follow us for related analysis.

Quickpost: Comparing Inverse head & shoulders on TRXBTC & ETHBCPretty simple idea. TRXBTC on the left is in a developing inverse head and shoulders and price action recently tested the 200 week as support and is now primed to begin to move to target. My trade is going to be on TRXUSD.
The chart has the key details and it is pretty simple and fundamental. My main thing still is leaving my damn trades alone enough. I have entered a small position on TRXUSD but once I see it get above its current resistance I will begin adding to it pretty aggressively in the early stages of the move. Once we get above that resistance I will have a 23 risk reward ratio and I will be putting on some margin.

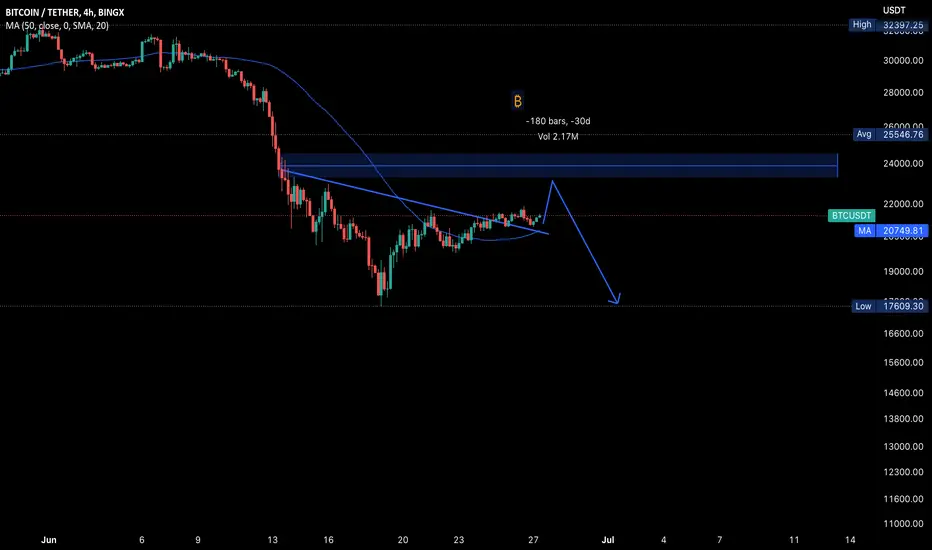
BTC UPDATE BTC Update
Bitcoin is consolidating just above the inverse head and shoulder pattern. Here I will not recommend to open a new trade, because this is area of no confirmation.
First week of July is bearish so expect 5-10% pump before the dump to $18k.
quick sketch of psychopathythe only way bitty can feel anything anymore is by messing with us...i would not be surprised if she does that here between the ihs arc neckline (2pi arc between recent tops, see previous chart) and the ihs LINE neckline...a retest if you will
(convinced the space between square/line and circle/arc has some meaning on these charts (which are just maps of emotion, something the geo gurus have gotten me thinking about lately)...ideal/avg vs real or something)
gut says double bottom range around here (slightly lower low like 16kish wouldn't bother me) for a few more months...but extra NFA. i'm basing that on my crab rockefeller idea (spirals geo noob stuff)
stay safe out there
fresh air, sunshine, move your body, tell your family and friends how lucky you are to have ppl who love you in spite of (because of?) your degeneracy
i'm not letting bitty hijack my summer!

BTC done pullback to neckline just one more resistance to break#BTC/USDT
pullback to neck line done, so we can expect rally to $25k if break out from ascending resistance.

Crypto TOTAL MARKET CAP (Watch Level 966867000000)Wait for a close above 966867000000 level on the Crypto TOTAL MARKET CAP. Watch for buy signals in the cryptocurrency market after a candlestick closes above 966867000000 on the Crypto TOTAL MARKET CAP chart.

10,000 dollar portfolio challenge! When will I enter more tradesTraders,
Here's what I need to see before I start to dive into these crypto trading waters.
-Stew

BTC QUICK UPDATE! BULL TRAP?Hello everyone, if you like the idea, do not forget to support with a like and follow.
Welcome to this quick BTC update.
BTC is going good so far. It is breaking out from the inverse head and shoulder pattern. But the real concern here is the volume. Volume is continuously decreasing and price is going up which is not a good sign for the market.
Market is in overbought condition. We might see some correction from here.
Strong support for BTC is at $19,800-$20,200 level.
What do you think about this?
Do you think we see a correction from here or do you think that we see more pump?
Share your views in the comment section.
If you like this idea then do support it with like and follow.
Thank You!

flirting at the neckline (bullas tp)lotta bear confluence here...which is my local bias. i do think recent low was a longer-term bottom we will range at for a lil while but nfa...
resistance is 2pi arc of the smaller circle you see (radius = between those two tops)
bearshark zone as well (included some bull harmonic possibilities)
ihs neckline
ihs and hs "fakeouts" are actually just PA following a curved neckline imo (just like irl :-) ) ...trendlines are not straight
NFA...expect the unexpected! a break here would be bullish to mid-twenties imo (w/successful retest)...lots of alts looking juicy if that happens

BTC inverse H&S or triangle#BTC/USDT
$BTC shaped inverse head and shoulders pattern, and now price is below neck line.
🐮 break out from neck line can increase price as high as head toward $25k and $26k.
🐻 rejection from neck line will invalid inverse H&S pattern and price will drop to ascending support around $19k.

#ETH: INVERTED H&S PATTERN! LOOKS BULLISH!!Hello everyone, if you like the idea, do not forget to support with a like and follow.
Welcome to this ETH update.
ETH looks good here. Forming an inverted head and shoulder pattern in 2hr time frame. Currently, it is in the process of forming the right shoulder. Once it breaks the neckline of the head&shoulder it will pump hard.
A strong support for ETH is at $1050
You can open a long position here with the SL of $1040
If you like this idea then do support it with like and follow.
Also, share your views in the comment section.
Thank You!

Bitcoin reversal pattern? Inverse H&S on 4hr chartHowdy folks!
highlighting the formation of an inverse head and shoulders for a possible sign of a bitcoin reversal.
$24k needs to become support, $27k needs to be hit to continue going upwards n price and bring favour back towards the bulls
if price crabs at $20k then expect to see lower prices towards $12-13k area for the next most likely bounce area
can go either way here, have fun, play smart x


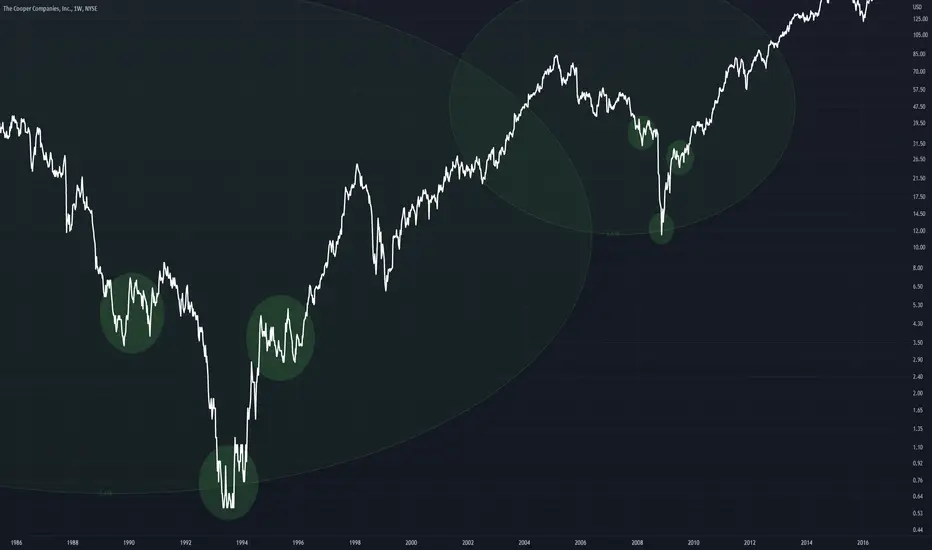
AZN - 50MA Inverse H&SAZN on this Monthly timeframe is extremely bullish
More interestingly though is the inverted H&S patterns that have formed a long this 50MA line
I have counted three in this post, all leading to a bullish result
More of a creative post

BTC: POSSIBLE SCENARIO! BULLISH!!Hello everyone, if you like the idea, do not forget to support with a like and follow.
Welcome to this quick BTC update.
BTC is forming an inverted head and shoulder-like pattern here which is generally a bullish pattern. Currently, it is in the process of forming the right shoulder and the important support here is $19,800-$20,200 level. I'm expecting a bounce from this zone.
Once BTC breaks the neckline of this inverted head and shoulder we can target for $26k-$27k level from here.
Invalidation level:- If it breaks and closes below $19.7k support then this inverted head and shoulder pattern becomes invalidated.
If you like this idea then do support it with like and follow.
Also, share your views in the comment section.
Thank You!

ZM - inverse Head & Shoulders in the making?I am watching to see if a breakup will materialise, and when it does, a high volume breakup will greatly improve the odds of this pattern succeeding.
This pattern is formed over 3.5 mths+ which is rather short (6 months or more prefered), meaning it could face more near term resistences on the way up. If it could go above 135 eventually then the coast will be clearer.
Disclaimer: Just my 2 cents and not a trade advice. Kindly do your own due diligence and trade according to your own risk tolerance and don't forget that money management is important! Take care and Good Luck!


GRTUSD: Inverted Head and Shoulders on 4 HourIf we are lucky we will see GRT atleast Rally up to the 200 SMA on the 4 Hour from here.

VIPS - inverted Head & ShouldersBullish argument for VIPS:
1. formation of inverted H&S
2. now above 200 days moving average
3. held above neckline and 200days MA for the past 2 wks
Less bullish:
volume is below average (would have prefered to see stronger volumes esp upon breakup)
Let's see if this inverted H&S will work out.
Disclaimer: Just my 2 cents and not a trade advice. Kindly do your own due diligence and trade according to your own risk tolerance and don't forget that money management is important! Take care and Good Luck!
