Understanding the Inverted Cup and Handle Chart PatternUnderstanding the Inverted Cup and Handle Chart Pattern
Understanding chart patterns is fundamental for market participants. This article delves into the inverted cup and handle formation, a bearish signal indicating a potential downward movement. Explore its identification, trading strategies, psychological underpinnings, common pitfalls, and more to boost your trading knowledge.
What Is the Inverted Cup and Handle Pattern?
The inverted cup and handle, sometimes called an upside-down cup and handle pattern, is a bearish chart pattern that may appear during up- and downtrends. It is the opposite of the traditional cup and handle pattern, which is bullish. The inverse formation consists of two main parts: the "cup," which is an inverted U-shape, and the "handle," a small upward retracement following the cup.
Identifying the Inverted Cup and Handle Pattern
Identifying the inverse cup and handle pattern involves recognising a specific sequence of market movements that signal a potential bearish move. Here's a step-by-step overview of identifying this formation:
Cup Formation
- Shape: The pattern begins with an inverted U-shaped "cup." The price gradually rises, consolidates, and then begins to decline, reflecting a shift from bullish to bearish sentiment.
- Depth: The cup should have a rounded top, not a sharp V-shape, indicating a gradual reversal. The depth of the cup can vary but typically represents a significant portion of the preceding movement.
Handle Formation
- Upward Retracement: After the cup's formation, prices usually experience a minor upward retracement or consolidation, forming the "handle." This movement should be relatively short and not exceed the initial high of the cup.
- Shape and Duration: The handle often appears as a small flag or pennant and should be brief in duration compared to the cup. An optimal handle retraces no more than half of the cup’s depth.
Breakout Confirmation
- Neckline Break: The pattern is confirmed when prices break below the neckline, the lowest point of the handle. This breakout often leads to a significant decline in prices, signalling a bearish trend.
- Volume Surge: Volume typically decreases during the formation of the cup and increases as prices decline, especially during the handle formation. A substantial increase in volume during the breakout can validate the pattern and minimise the risk of false signals.
The Psychology of the Inverted Cup and Handle
The psychology behind the inverse cup and handle pattern is rooted in market sentiment and behavioural finance. This bearish pattern reflects a shift from optimism to pessimism among traders.
- Initial Uptrend: The formation starts with an upward movement, where traders are generally bullish, driving prices higher. This phase is marked by growing confidence and increasing demand.
- Formation of the Cup: As prices peak, consolidate, and start to decline, some traders begin to take profits, leading to reduced buying pressure. The rounded decline of the cup signifies a gradual shift in sentiment from bullish to bearish as traders become cautious and selling pressure mounts.
- Handle Formation: The minor upward retracement forming the handle indicates a brief period of consolidation where the market tests the resolve of buyers. It can be considered a dead cat bounce. This phase often traps optimistic traders who expect the uptrend to resume, but the overall sentiment remains fragile and cautious.
- Breakout and Decline: The decisive break below the neckline represents a culmination of bearish sentiment. At this point, selling pressure overwhelms any remaining bullishness, leading to a sharp decline. The volume surge during this breakout confirms the shift in market psychology from hopeful to bearish as traders rush to exit their positions or initiate short sales.
Trading the Inverted Cup and Handle Pattern
Trading the inverted cup and handle pattern involves careful identification and strategic decision-making to maximise potential returns. This pattern presents two primary entry points for traders: during the handle formation or after the neckline break.
Entry on the Break of the Handle
- Risk-Reward Advantage: Entering on the breakout of the handle’s lower boundary offers a better risk-to-reward ratio but requires more skill and confidence in pattern recognition.
- Technical Tools: Traders often use a medium-term moving average (like 21 periods) to confirm the downward leg of the handle. A decisive close below the moving average indicates a continuation of the downward handle leg.
- Momentum Indicators: Using momentum indicators like the RSI (Relative Strength Index) or stochastic oscillator helps confirm downward movement. Bearish divergence suggests that the bearish trend is likely to continue.
- Volume Analysis: Increasing volume during the handle's breakout indicates strengthening seller control. High volume often validates the pattern and potentially reduces the risk of false signals. Note that volume data may be less reliable in a decentralised forex market.
- Stop Loss and Profit Target: Traders typically place a stop loss above the handle's high to potentially protect against upward spikes. The reverse cup and handle pattern target is usually set at a distance equal to the cup's height, projected downward from the handle's breakout point, although it can be greater if the retracement is particularly shallow.
Entry After the Neckline Break
- Confirmation Advantage: Waiting for the neckline break offers greater confirmation of the formation but may provide a less favourable risk-to-reward ratio.
- Price Action: A decisive close below the pattern's low, ideally with a strong candlestick and minimal wicks, indicates a reliable breakout. This typically confirms the bearish trend and provides a clear entry signal.
- Volume Confirmation: Higher volume during the neckline break can further validate the pattern and indicate that the breakout is genuine and not a false signal.
- Stop Loss and Profit Target: In this scenario, the stop loss is typically set above the handle's high. The profit target remains the same, projecting the cup's height downward from the breakout point.
Common Mistakes to Avoid
When trading the upside-down cup and handle pattern, avoiding common mistakes is key for maximising potential returns. Some of the more common mistakes traders make include:
- Premature Entry: Entering a trade too early, before the handle completes or the neckline breaks, can lead to false signals and losses. Most traders wait for clear confirmation, such as a decisive close below the neckline with increased volume.
- Ignoring Volume: Volume is a critical component in confirming the pattern. Low volume during the breakout phase may indicate a fakeout. Traders typically look for a substantial increase in volume to validate the pattern.
- Incorrect Pattern Identification: Misidentifying the pattern is a common error. The cup should have a rounded bottom, not a sharp V-shape, and the handle should be relatively short. Accurate identification requires practice and attention to detail.
- Overlooking Market Conditions: External factors, such as news events or broader market trends, can impact the pattern’s reliability. Traders consider these conditions when planning their trades.
Advantages and Disadvantages
As with all chart patterns, the inverted cup and handle pattern comes with its pros and cons. Here are some key advantages and disadvantages of using this pattern:
Advantages
- Clear Signal: The pattern provides a clear signal of a potential bearish movement, helping traders anticipate market declines.
- Risk Management: With defined entry and exit points (handle high for stop loss and cup depth for profit target), it aids in effective risk management.
- Flexibility in Analysis: Several forms of analysis, from support/resistance and momentum indicators to volume and price action, can be used to trade the pattern.
- Versatility: Applicable across various timeframes and markets, including stocks, forex, and commodities, making it a versatile tool for different trading strategies.
Disadvantages
- Complex Identification: Accurately identifying the pattern can be challenging, requiring significant experience and skill.
- Rarity: The pattern doesn’t occur frequently, limiting trading opportunities.
- False Breakouts: Like all chart patterns, it is susceptible to false breakouts, especially if not confirmed with volume and other technical indicators.
- Timing Sensitivity: Entering too early during the handle formation can result in premature positions, while waiting for the neckline break might reduce the risk-to-reward ratio.
The Bottom Line
The inverted cup and handle pattern is one of the most popular chart patterns among traders of all levels. However, like any technical formation, it should be used alongside other indicators and sound risk management to potentially increase its effectiveness. By mastering patterns like the inverted cup and handle, traders can gain deeper insights into market psychology and price action to navigate volatile markets with greater confidence.
FAQ
What Is the Inverse Cup and Handle Pattern in Forex?
The inverse cup and handle pattern in forex is a bearish chart pattern. It features an inverted U-shaped cup followed by a small upward retracement (the handle). This pattern suggests that sellers are gaining control, and prices are likely to decline further once the neckline is broken.
How Can You Trade the Inverse Cup and Handle?
Traders can enter positions either on the break of the handle’s lower boundary or after the neckline break. Entering during the handle might offer a better risk-to-reward ratio, while waiting for the neckline break provides greater confirmation. Key tools to validate the breakout include moving averages, momentum indicators like RSI or stochastic oscillator, and volume analysis.
What Happens After the Reverse Cup and Handle Pattern?
After the reverse cup and handle pattern is completed, the price typically moves downward strongly. This bearish movement is often confirmed by a strong breakout below the neckline with increased volume, signalling a sustained decline in prices.
What Is the Opposite of the Cup and Handle?
The opposite of a cup and handle is the inverse cup and handle pattern. While the cup and handle indicates a bullish movement, the inverse version signals a bearish trend.
Is the Inverted Cup and Handle Bullish or Bearish?
The inverted cup and handle pattern is bearish. It indicates that the price will move downwards, suggesting that traders may open short trades.
This article represents the opinion of the Companies operating under the FXOpen brand only. It is not to be construed as an offer, solicitation, or recommendation with respect to products and services provided by the Companies operating under the FXOpen brand, nor is it to be considered financial advice.
Inverted Cup and Handle

Inverted cup and handle formationLong term up trend is turning into an inverted cup and handle. Hopefully it breaks out cause I’m long in this sector. But all other quantum stocks are showing downward trend even post quantum stocks. And current market trends are not helping.🤞

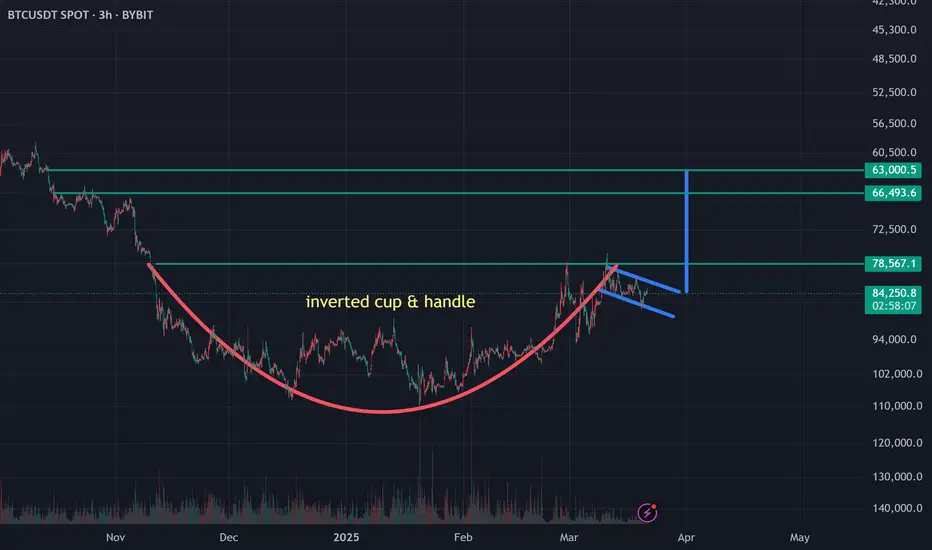
Bitcoin Inverted Cup & handle Bitcoin is forming an inverted Cup & handle pattern with a target of 63k-66k. I was surprised to see this when I inverted the chart. Just sharing with you what I see, and I hope the pattern changes and we continue to go up. However the highest probability at the moment is further downside, but we may still have a bounce toward 89k-91K before seeing the blood.
AGIX coming down in the short term 15 time frameAGIX is about to make its decent to the down side, first stop 0.3050, Inverted adam and eve also invert cup and handle, happy trading

$SPY $SPX $ES1! Massive Inverted Cup and Handle & Bear Flag?? 🤔AMEX:SPY SP:SPX CME_MINI:ES1! Analysis, Key Levels & Targets
One day at a time, right… BUT doesn’t this look like a MASSIVE INVERTED CUP AND HANDLE + A BEAR FLAD… sorry for yelling but YIKES!!!
Not to mention the MASSIVE Divergence going back to when the market should have corrected prior to intervention….
Stay alert, y’all… there will be rallies, but there will be DROPS as well 😅

BITCOIN : Btc/usdt Inverted Cup shape BINANCE:BTCUSDT
Hi , Trader's as per my analysis , inverted Cup shape chart pattern forming Which indicate
Bearish reversal pattern , if this is the case than market could fall to 20k area again
There is significant profit booking at area of 28K buyer's exit there long position's
400m$ long position's exited till now from 28k area , which indicate's powerful reversal
Maximum 30k will be the target for btc .
Market need's to break 30k and candle of 4hr or daily closes above that point with good volume than market can keep it's bullish bias

Overhyped Defense Stock Trading at over 670x EPSWe have another Overhyped Defense Stock trading well above EPS ; This time trading well over 600 times earnings while the price is breaking below trend. It could be argued that we have an Inverted Cup with Handle at the Highs and if 46 Breaks we could quickly come down to $18 a Share but due to how high the PE is i wouldn't even be against targeting the 1.618 Extension all the way down at 72 Cents.

BTCUSDT | Wave Analysis | Mega Bull Flag Formation +80%Price action and chart pattern trading
> A possible downtrend continuation for C-leg with the current bearish PENNANT pattern
> The downtrend TP @ 1.618 extension zone at 13K USD price - same target with the previous bearish INVERTED CUP pattern
> An upcoming mega bull flag formation with target reversal +80% upside @ 28K USD price.
> Close short position once a divergence signal presented.
Always trade with affordable risk and respect your stoploss!

MARA - Inverted Cup and Handle Pattern We expect that the price will be decrease. The price of the MARA is forming a potential inverted cup and handle pattern. RSI is overbought and shows us that it is selling time.
Entry, stop-loss, and target levels are in the chart.

1302: TASI (BAWAN CO.)Short term and long term trade setups
Trail your stop loss with proper Risk Reward

Inverted Cup and handle pattern in XAUUSDGold against the Dollar have been sideways since September I st, 2022 , traded between 1700 to 1726 for almost a month for almost half of the month, Stronger CPI data on Tuesday affect the gold market by making the Dollar strong,
Bearish momentum has supported by Inverted Cup and handles pattern ,
Market sentiment on Gold also mostly bearish, it can be understood from the following statement
Société Générale sees gold prices falling to $1,550 in 2023 and recovering to $1,900 by 2024

Standard Chartered Short IdeaSTAN on the daily chart has put in a double top.
An inverted cup with handle pattern is forming down towards the 200 EMA.
Once price closes below the 200 EMA I will be looking for a short position. Around £5.40
Measured move (Size of Cup) will be my first profit target at £4.32 which is also an historical support level.
Stop initially at top of handle around £5.96.

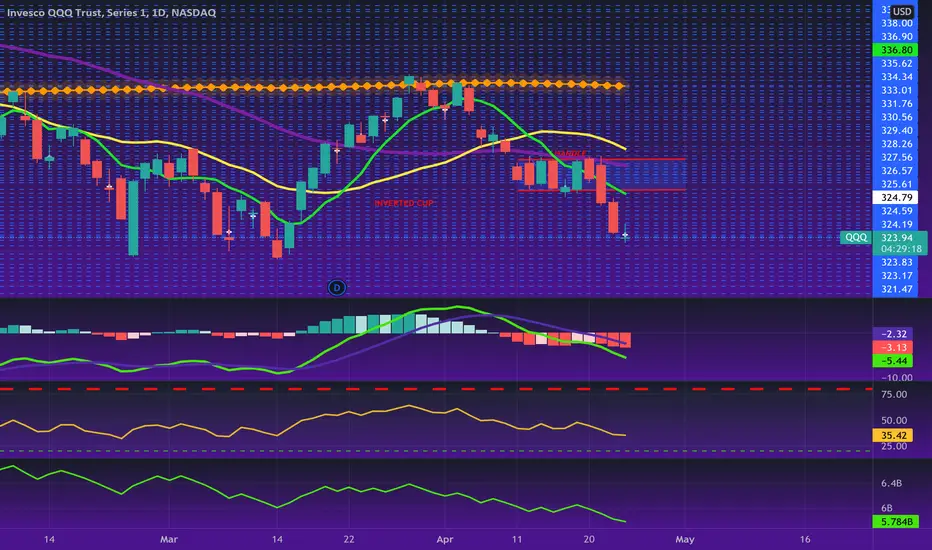
Deja Vu Tooin 2021, I noticed some patterns on both the BTC chart and the QQQ chart.
Now these patterns are happening again on both charts.
Last time, they didn't confirm. The market bounced back up.
It bounced in mid-Oct 2021 - when the fourth stimulus check hit people's banks while a ton of extra unemployment benefits were given to people.
I'd say it was a coincidence, but I don't believe in those.
One possible explanation was that the fourth check and benefits went into the market (just like a lot of stimulus money did). If that's true, it could have stopped the crash.
This time around, there is no stimulus money coming, benefits are pretty much back to normal, inflation is up, the market is down and the Fed is done helping the market.
Buyers have to show up somehow if this mess is going to get cleaned up.
The inverted cup and handle is in no way confirmed at all yet. I'm posting this so I can easily track the thesis on a chart and check to see if it does confirm.
If it chops around (for up to a month) around the $342-$348 range and then makes a bonafide move down past $335, the pattern is confirmed and you should grab your helmet.

Will We "Affirm" A New Direction This WeekWill We “Affirm” ( NASDAQ:AFRM ) A New Direction This Week?
I strongly believe that a new direction will be affirmed for Affirm Holdings, Inc. (AFRM) this week. I've identified several reasons why I anticipate a new direction for the stock.
Bullish divergence on the daily chart.
AFRM is in the buy zone.
AFRM is in a range on the daily chart.
Outcome Expected- Break from range through the upper channel
*Identified risks-
-It will be very important to watch price action because the stock is currently trading below the 200, 50, 21 and 9 moving averages. Hence, the reason why I will be making a safe entry once the stock moves above the upper trendline or 9 MA.
-AFRM is ranging and I wonder if it will continue to do the downside as a continuation from the inverted cup and handle pattern or make a shift to the upside
-AFRM has earnings on May 12, 2022.
I look forward to watching what happens with AFRM over the next few days.

"Is NIO Emptying The Cup?"NYSE:NIO
www.tradingview.com
Is NIO Emptying The Cup?
Please drink water my fellow traders because we all need to stay hydrated. Summer time will be here before you know it. Therefore, I encourage you to increase your water intake.
On another note, NIO developed an inverted cup and handle pattern on the daily chart. My question to the trading community is quite simple. Is NIO emptying the cup? I have my cup and am ready to catch the water in case it..."pours". If it does I will "hydrate"!
Strong confluences at play include- The 9 MA crossed UNDER the 50 and the 21. Also, NIO is currently trading under its 200 moving day average of 32.06.
My plan-IF it trades below the green "handle" (16.16), then I will enter a put option swing. However, if it breaks ABOVE the handle (red line of handle), then my analysis will no longer be valid.
~Peace & Prosperity,
MrALtrades00
*******This is not financial advice*******This is not financial advice*******This is not financial advice*******This is not financial advice*******

QQQ "Inverted Cup & Handle" Pattern
Inverted Cup & Handle pattern on QQQ's daily chart.
*This post is not financial advice.
$ALGO Inverted Cup & HandleBearish pattern forming on $ALGO
Invalidation w/ candle closing above $0.905
Target 1 Zone
$0.85 to $0.86
Target 2 Zone
$0.71 to $0.74

$RIVN - Ready to Make New LowsEarnings were not kind to $LCID.
Lucid Group cut its car production forecast for this year by as much as 40%.
The company cited supply chain constraints and parts quality issues for slashing production to between 12,000 and 14,000 vehicles, down from initial expectations of 20,000.
“This reflects the extraordinary supply chain and logistics challenges we’ve encountered and our unrelenting focus on delivering the highest-quality products,” Lucid CEO Peter Rawlinson said in a statement. “We remain confident in our ability to capture the tremendous opportunities ahead given our technology leadership and strong demand for our cars.”
It hasn't been much different for car companies across the world, EV or not.
This brings us to RIVN. A stock that has been cratering from its highs earlier this year. They report earnings on March 10th. The same day CPI is released. Talk about a double whammy.
Supply chain constraints remain and I expect RIVN to guide in a very similar manner to LCID. They are both in the early innings of their life cycle as companies and not as well equipped to handle inflationary and supply risks like the seasoned TSLA. Until this point I had not even mentioned the tremendous chip shortage.
Expect RIVN to only make new lows from here on out with this inverted cup and handle setup as noted above.

COIN Inverted Cup & Handle Pattern Short thesis:
- 4hr inverted cup & handle pattern
- Bearish DMI
- Bearish PSAR
- Bearish Golden Cross on EMAs
- Below VWAP (currently 257.19)
- correlation w/ BTC reshort into 45K and potentially 41K liquidity zones
- 4hr technicals flashing weighted sell signals (oscillators, pivots, moving averages)
Price Target: 230 with potential all time low test

Inverted Cup with Handle and Descending Triangle, Oh My GodInverted Cup with Handle and Descending Triangle, Oh My God...
These prices of all top 10 coins are so intimidating... But, cant ignore these signals!!! Is there anyone who knows better than me tell me that I am wrong...
An Inverted Cup with Handle in 1H BTCUSDT.
Descending Triangle in 1H BTCUSDT.
All signs are pointing towards a sharp drop... On top that, it is Friday...
May be 42, may be lower.
If BTC push up from these signals, it will definitely be an eye opener for me to HODL!!! I might learn something new. Let me know what you think.
Not financial advice, Do your own research...

BRITANNIA 1Hr Time Frameif Break below then only take trade! otherwise, Don't its look like an Inverted Cup and Handle Pattern!

USOIL. P-Modeling PT V2. Inverted Springs of Cajun OilWelcome Hyperspace Agents,
This is the second part of US OIL. Part V2.
In order to understand this chart. You must do the following:
- View the ENTIRE Time-Series Analysis.
- View Pt. 1 of the US OIL idea.
-Try and Grasp the understanding of Harmonics and Inverted C&H formations.
-Be open minded.
Please see the snapshots in order. They represent a snapshot progression of the dynamic model being executed. This is called a Time-Series Analysis.
Time-Series Start:
Baseline Snapshot: 1 Week TF.
Inverted cup and handle formation not yet executed.
Dec 6th, 2019
Price $58.25
Next Snapshot: 1 Week TF.
Inverted Cup and Handle formation has been partially executed up to the C & D conjunction of the HANDLE harmonic of the formation. Formation Validated.
March 26th, 2020
Price $23.79
Next Snapshot: 1 Week TF.
Inverted Cup and Handle formation EXECUTED. Past lowest linear conjunction of Handle.
April 20th,2020
Price $14.85
Next TWO snapshot: 1 Week TF.
Inverted Cup and Handle formation Executed. Full cup pour to $0.00 and oil goes (-) on some exchanges.
April 20th, 2020
Price $13.61
& Oil goes to 0.
Now let us fast forward to the rebound dead-cat.
We create a harmonic exit pattern, leading into new bull-run for oil.
Sept 1st, 2020
Price $43.06
I thought, why not a nice double bottom inverted spring to set us off the cajun way.
We begin 2nd crash of oil.
Sept 8th, 2020 (posted date).
Price: $36.46
________________________________________________________________
You can find all the original snapshots here:
Please view PT 1.
Snapshot Time-Series Analyses are very hard to refute. Because the proof is in front of you. No numbers. No guessing. Simply View the evidence in picture format.
Area of Interest was confirmed in PT 1.
Target for this drop is $11 stable on US OIL.<---
WTI OIL will also drop to a TP of 0.11 cents.
Idea here :
Covid-19 Wave Two.
Dropped demand.
Complex Supply availability due to weather.
May even see a flash crash to 0$ again..
Who knows..
Not I said the sheep.
Thanks for Pondering the Unknown with Me,
Glitch420

BNB: Correction comingInverted cup and handle pattern in progress. A retest of $421 is expected. Lower support levels are 412, 408 and 403
