CADCHF | BULLISH trade OPPORTUNITY 🚀- CAD/CHF is trending towards the upside on multiple time frames following moving averages.
- We are seeing a bullish engulfing candlestick closure on the 4-hour chart, and an inverted hammer pattern on the 1-hour time frame, indicating buying pressure.
- The overall trade setup, has the potential to reach around 100 pips because of a potential monthly resistance re-test.
Inverted Hammer

[Candlestick Patterns] Just need to know these three!#Candlestick #CandlePattern #Tocademy #Tutorial
Hello traders from all over the world, this is Tommy =)
I was unexpectedly surprised by many of you who liked and supported my last post about the basic concept of TA(Technical Analysis). Today I prepared a brief lecture about the Candlestick Pattern, one of the most fundamental phenomenon and behaviors that traders must be well-informed. In fact, we should be very familiar with these textbook contents and interpret it in a glimpse on the technical chart unconsciously. Just like we don't pay direct attention about each breathes when breathing, like we don't care each and all of the alphabets when we speak, or like we don’t perceive location of each keyboards every moment as we type, this very technique should be performed automatically and quickly by observing dominant formations of candlestick bars.
As a matter of fact, comprehending market trends and price actions only by referring to the candlesticks is yet too spurious. It should be used in such a way to weight on certain scenarios in a macroscopic view, rather than deriving precise and specific PRZ(Potential Reversal Zone)s and distinguish the accurate market trend. It’s never like ‘The price must go up because this pattern just appeared’. Furthermore, I strongly believe that the reliability of the candlestick pattern strategy is declining especially in recent financial market, where we encounter countless non-traditional and abnormal situations that were not very common in the past. Hence among the existing ‘Textbook’ candlestick pattern strategies that can easily be found on Google, there are particular patterns that are still very reliable on current market and there are ones that are not as reliable as it used to be. So here, I will organize everything very clearly for you guys.
The technical chart is well known as sort of a map tracing the mob-psychology of all the stakeholders in the market. Investors’ sentiments such as FUD(Fear, Uncertainty, and Doubt) and FOMO(Fear of Missing Out) that often cause panic buy/sell are visualized as data. Those with a clear understanding of the fundamental nature of how candlesticks are being formed, don’t even need to memorize these patterns one by one. As I emphasized at my previous post, candlesticks should be interpreted as a whole structure, unlike the line chart expressed in one-dimensional. Candlesticks are newly formed in each time interval and we can choose the timeframe for the chart that we are about to analyze. For instance, each candlestick in a daily chart is formed every day while each candlestick in a 5minute chart is formed every 5 minutes. Higher the timeframe of the chart is, longer-term the scope within the chart is. It is important as a TA analyst to start from macro-perspective with higher timeframe first, then go deeper to lower timeframe and find short-term factors.
There are four independent prices composing a candlestick: open, high, low and close price. Open price indicates the starting point while close price indicates the ending point of a candlestick. Just like the wording, high/low prices are formed at the highest/lowest price during the time period of candlestick being formed. A bullish candlestick is when the closing price is above the opening price (i.e., when the price rises), while a bearish candle is when the closing price is below the opening price (i.e., when the price is falling), and the two are expressed in different colors (green & red or red & blue). The thick part between the opening and closing price is called the ‘Body’, and the thin part is called the ‘Tail’ (Wick or Shadow).
Typically, the length of the body implies the strength of an ongoing trend. We learned from the textbook that the candlesticks with a longer body means stronger trend and those with shorter tails mean clearer trend. Back in the days, there was time when we could detect if whales are involved and deduct impulsiveness of ongoing trend when distinctly long bodied candlesticks with relatively high trading volumes take places. I am afraid to tell you that it is better to erase that memory. First of all, it is too obvious and cliché to announce that the long candlesticks with high volumes mean strong market trend. This criterion itself is quite vague and not 100% reliable to identify future trends or find insightful signals. Moreover, in recent days (especially in Crypto), whales like to deceive retail traders with a strong faith of trading volumes and since the future markets are becoming bigger, giving too much weight on trading volume paired to each candlestick is not as effective as it was when textbook used to work very well. I am not saying textbook is wrong. It just needs slight updates since the market we are dealing with keeps changing over time.
In TA world, closing price of a candlestick carries a great meaning and thus closing prices at higher timeframes should very well be monitored to become a successful trader. Sometimes whales even battle aggressively right before a major closing time often causing a weird ‘scam’ moves with a high volume. As shown below, we usually find the price and time when certain TA variables (such as top/bottom of trendline, channels, pivot levels, and other indicators) are broken, meaning if the price has penetrated those variables successfully, in order to find breakout entries, stoplosses, and target prices, etc. This whole concept of breaking above or below is quite vague, subjective, and relative idea. So, what we traders refer to as a reliable criterion is confirming whether the candle closed above and below the factors. For instance, let’s say that we are seeking and waiting for the breakout of the downward trendline. Well sometimes it’s not as easy as expected to precisely spot and determine whether the price has successfully pierced through the trendline. There are times when price breaks the trendline, but ends up coming back below leading close price of the candlestick to be formed below the trendline like the case 2 below. In this very case, it’s difficult to determine whether the breakout happened successfully or not. Nevertheless, like case 3, when both closing and high prices are formed above the trendline, we can clearly confirm and weight more on the breakout scenario, expecting more bullish rally.
Okay let's get to the point. In recent financial trading market, it's enough to know just these three.
1. Engulfing
2. Doji
3. Long Tailed Candlestick
As mentioned above, there’s nothing hard if you understand the essential concepts and principles of the above patterns and phenomena. The engulfing candlestick is a phenomenon in which the body of the previous candle is consumed by the body of the next candle, that is, a larger body than the previous one comes out. In other words, if a new bullish candle closes higher than the previous open price or if a new bearish candle closes lower than the previous open price, we say ‘the new candlestick engulfed the previous one’. If we look closely, this pattern implies the circumstance where the new candle completely overwhelms the trend of the previous candle and reverses it into a new trend despite closing the price from above or below. However, the appearance of an engulfing candle does not mean that the trend is unconditionally reversed. It is often the case that engulfing candles take place consecutively, with the second candle taking over the body of the first candle, the third’s taking over the second’s, the fourth’s taking over the third’s and so on. As the price fluctuates up and down, it creates a Widening or Broadening pattern also known as expanding sort of shapes, making it difficult for traders to figure out the current trend. In this circumstance, the entry prices, stop loss prices, target prices, or average prices of many participants in the market tend to be located relatively nearby. This price range or region is called a HVP(High Volume Profile or Peak) or an Orderblock and I will cover details about this concept later on another post. Anyway, there are numerous methods to derive Orderblock and one of them is to spot bodies of the consecutive engulfing candlesticks.
The tail(wick) of a candlestick can be interpreted as a sign of the fierce battle between the bulls are bears. Longer tail signifies bigger collision between buying and selling forces. The longer the upper tail, the more the bulls trying to raise the price up but the bears rejecting them eventually sellers ending up being dominant and vice versa for the longer the lower tail. Generally, when the long upper/lower tails are formed at a relative higher/lower part of the wave structure or at a distinctive pullback as a PRZ this can be a possible signal of trend reversal. Due to my personal trading experience, it doesn't matter much in recent TA market whether the long-tailed candlestick is a bullish or bearish. In other words, regardless of the color of Hammer or Shooting star (which are both long-tailed candlestick pattern), it’s better to check if the next following candlesticks are being formed opposite direction of the tail. Personally, I don't think the Inverted Hammer and Hanging Man are not as necessary as it used to be in the old days.
When the length of the candlestick’s body is relatively short meaning if the open and close prices are very close, forming a cross like shape, it’s called a Doji. Since Doji has a short body, the upper and lower tails tend to come out longer and thus can be considered as evidence of a tense confrontation between the bulls and bears that eventually ends up reaching a balance. Similar to the long-tailed candlestick, Doji is also known as a sign of a PRZ depending on the next appearing candlesticks. When Dojis are observed after swing high or low, it can be a possible indicator that the on-going trend is overheated and you might want to anticipate some pullbacks. However, it is too risky to directly assume that the top or bottom is near just because of Doji. Especially in the market these days, Dojis also appear frequently in sideways and sometimes confuses traders searching for a clear trend.
As emphasized above, as with other technical techniques, theories, and indicators, always remember to weight more to the emergence of patterns in higher timeframes and longer-term perspectives. The higher timeframe people globally refer to, the more the reliability the TA will be. Just think about it for a second. Which timeframe do you think that people consider more significantly about the closing price, a 5 minutes chart or a daily chart? I would obviously say that the price signals from the daily cart is relatively more representative and reflect longer-term than those of the 5 minutes chart. Keep in mind is that you also need to understand market trends from a macro perspective before approaching towards short-term perspective. It is always recommended to recognize long-term trends or situations in advance from the candlestick of a higher timeframe, and then look at more detailed and microscopic elements step by step.
All right. I will wrap up now. Thanks for reading my post.
Your subscriptions, likes, and comments are a huge inspiration for me to write more posts!

QI/BTC Inverted Hammer On Monthly TimeframeBullish candle could be signaling a reversal on this pair.

BTC-WEEKLY-INVERTED HAMMER...WEEKLY (W1) $
Last week price action triggered an INVERTED HAMMER PATTERN, which usually should be seen as a bullish warning signal; nevertheless, in this case, I would remain very cautious before to conclure that the downside pressure is over and we can see a STRATEGIC TREND REVERSAL ; the weekly closing level @ 38'438 was below the TENKAN-SEN !
Indeed, the ongoing weekly price action should validate this Inverted hammer pattern and a sustainable recovery should occur in order to do it; in addition, a failure to hold above the bottom of the clouds on a weekly basis, would invalidated this potential reversal pattern and put further pressure to to downside, calling for lower levels towards the former bottom zone 35'000-33'000.
RSI below 50, @ 41.34
LAGGING LINE currently in the middle of the weekly clouds support area.
THE STRATEGIC KEY PIVOT LEVEL ON THIS WEEKLY TIME FRAME IS @ 28'600 WHICH SHOULD BE SEEN AS THE MOST IMPORTANT SUPPORT LEVEL !!!!
Watch the CLOUDS as the LEADING INDICATOR (37'500-44'000)
DAILY (D1)
Yesterday's closing level @ 38'438 was the third daily closing level below the daily clouds and below the former downtrend line which became the new support and which has also been broken too.
RSI is below 50, @ 43.07
LAGGING LINE is already below the Kijun-Sen and also below the Mid Bollinger Band !
The 61.8% Fibonacci retracement @ 38'528 has been broken on a daily closing basis and the next support level to look at is @ 36'679 (78.6% Fibonacci extension) ahead of the 35'000 area (former uptrend support line). A breakout of the 35'000 support area would put the focus on 34'324 (former intraday low of Feb 24th ahead of the low of 32'950 reached on Jan 24th.
In this daily picture, only a sustainable recovery above 40'000 (daily clouds bottom & Mid Bollinger Band) would neutralise temporary this ongoing persisting downside risk !!!
LAST BUT NOT LEAST ONLY A RECOVERY ABOVE 42'524 would force to a view reassessment of the expected BEARISH SCENARIO calling for lower levels !
4 HOURS (H4)
Currently below :
1) the clouds
2) the Kijun-Sen
3) the Mid Bollinger Band
4) the Tenkan-Sen
RSI below 50 @ 32.42
LAGGING LINE currently in the middle of the H4 clouds !
Watch both Tenkan-Sen (@ 38'646) and the Mid Bollinger Band (@39'430) as the first levels which should be broken to neutralise this ongoing downside rise !
The main resistance area in this 4 hours time frame remains the clouds resistance area between 39'828 and 42'722.
Any short term recovery should be seen as a CORRECTIVE MOVE ONLY in a BROAD STRATEGICALLY BEAR TREND and therefore, as already mentioned several times, in my previous analysis, any countertrend exposure should be managed with a strict disciplined approach in applying an appropriate RISK REWARD RATIO which will depend on your TACTICAL TIME FRAME HORIZON !
Watch and monitor closely price action on shorter intraday time frames which will help you to get clues for further development.
Have a nice trading week and all the best.
Take care.
IRONMAN8848 & Jean-Pierre Burki

BTC- STILL BELOW THE DAILY CLOUDS...Looking briefly at the WEEKLY picture, a potential INVERTED HAMMER is in progress which usually is considered as a REVERSAL PATTERN (Wait weekly closing for confirmation of this pattern)
In addition watch carefully the bottom of the weekly clouds support area @ 37'516, already tested once this week; a failure to hold above that level on a weekly closing too would add further downward pressure to the BTC for the upcoming week
RSI below 50 @ 43.15 and the LAGGGING LINE is still in the clouds.
Currently still below the TENKAN-SEN @ 40268.
A weekly closing above the TENKAN-SEN previously mentioned would be positive for the upcoming trading sessions.
DAILY (D1)
Yesterday's price action triggered an HAMMER pattern with its closing level @ 39'417, below the daily clouds support level @ 40'054
Ongoing today's price action is showing an upside attempt to recover in the clouds ahead of crossing over the MBB , currently @ 40'323.
IMPORTANT LEVELS TO WATCH ON A DAILY CLOSING BASIS ARE THE FOLLOWING :
40'825 (middle of the March 4th, long black candle !)
38'590 (former bottoms & potential double bottom !)
A breakout of one of those 2 levels should trigger respectively an upside move towards, respectively to the Tenkan-Sen @ 41'174 and ahead of the top of the clouds(42'524) first, and potentially higher towards the former high @ 45'332, while on the downside, a failure to hold above38'590, should put the focus on the former daily congestion bottom around the 37'000 area, which has already mentioned in my previous analysis.
Interesting to note the fragility of the 37'000 - 35'000 trading range.
RSI below 50 @ 46.65 and the LAGGING LINE still above the KIJUN-SEN.
4 HOURS (H4)
Below the CLOUDS , currently attempting to recover within the clouds area (39'652-41'875
Above the TENKAN-SEN @ 39'150.
MID BOLLINGER BAND @ 40'580, roughly in the middle of the clouds resistance area.
CONCLUSION :
Once again, watch and monitor very carefully price action on shorter intraday time frames ! That will either validate or invalidate the implications of the scenarios previously explained.
IRONMAN8848 & Jean-Pierre Burki

+2.5% Quick Intraday play on EURNZDHi traders,
THE STATEMENT
Here you have a quick scalp idea on FX:EURNZD , using H1 for directional bias and M10 for execution.
THE PLAY
On H1 time frame, there is a bearish RSI Divergence forming since 14th of January 2022. However despite the RSI Divergence, there is no other confluences indicating a reversal (no Break of Market Structure or Lower Lows and Lower Higs ), meaning: We sit on our hands!
On 18th January 2022, there is a clear Double Top forming (clear rejection between 10h00 and 11h00).
To consider going short, we need the price to create a Lower Low and Lower High . For our trade execution we are looking for an entry on the 10 minute time frame .
Price breaks our level and rejected it as well as EMA 21. Additionally candle closes as an Inverted Hammer .
THE RESULT
+2.5% for a quick intraday play that lasted 4 hours.

STORJ ready to flySTORJ has now recovered with bullish candles from a downtrend after a bullish divergence appearing on 12hr and 4hr timeframes.
Storj is currently holding on to EMA50 and aiming to take EMA200.
Ichi span has exited out of a downtrend channel but still aiming downwards meaning it's too soon to enter this trade.
The recent buy-volume has secured Storj a double bottom since Aug 19th and we are to place our SL exactly under the range of the previous Ichi channel below the double bottom zone.
Keep in mind to profit-trail after your entry.
BTC's safe range for this trade is between 6800~8200.

ABNB: Short Swing Trade UpdateCancelling the previous order and setting up a new one with a better entry point around the new inverted hammer. Believe the 200EMA and weekly resistance along with a weak overall market will win the battle in the short term.

Inverted HammerThe inverted hammer is a type of candlestick pattern found after a downtrend and its a trend-reversal signal.

SNOW: Short Swing TradeInverted hammer closing below the 200SMA. Bearish sign although weekly support could limit risk/reward.


The power of tension and a inversted hammer candle...As you can see on the SBEV chart, there is a build-up of tension towards the end and an inverted hammer candle. The long upper wick of the candlestick pattern indicates that the buyers drove prices up at some point during the period in which the candle was formed, but encountered selling pressure which drove prices back down to close near to where they opened. When encountering an inverted hammer, traders often check for a higher open and close on the next period to validate it as a bullish signal.
After this the price blew up from around 1.05 to 4.35 which is mor than a 4x
And now some math, if you had invested 100€ at 1.05, and cashed out at the top (4.35), you would now have 414€ which is 314€ made in only 3 days.
Here is the calculation: 100/1.05 = 95.238 95.238x 4.35 = 414,2853
------------------------------------------------------------------------------------------------------------------------------------------------------------------------------------------------
If you enjoyed this post and agree with me, a like and a sub would be very nice : )
Stay updated for more content
Bye!
------------------------------------------------------------------------------------------------------------------------------------------------------------------------------------------------

VTHOUSDT Potential reversal trend on Weekly Chart LONGHi everyone
Weekly"
Possible trend reversal from down trend if we can get to break out from Symmetrical Triangle.
There is local resistance at around $0.1 If we can over come this point we could be looking up to a reversal all the way to $0.2
Also Stoch RSI crossed up on over sold area. (After a few months now) This is a strong sign of having had reached bottom on down trend and now just looking to come back up.
ALWAYS look for extra confirmation on any trade, Anything like a bullish candle such as the one we can see here "green Inverted hammer'
Happy trading people
(No financial advice)
DISCLAIMER
The trading ideas, analysis, and comments above should not be considered financial advice or recommendation to trade or invest in any financial product. Your personal situation has not been taken into consideration in the trade ideas. This page is for general educational purposes only. Do not buy or sell any product discusses on this page before doing your own research. Always do your own analysis and research and be aware of the risks involved in trading any financial product :)

BBRI > BANK RAKYAT INDONESIA TBKBBRI membentuk pola Bullish Flag Wedge dan Inverted Hammer dengan Volume Besar,
Plan BOB:
BUY : > 4200
SL : > 4030 (4%)
TP1 : > 4550 (8%)
TP2 : > 5180 (23%)
Risk In Your Hand
Press Like & Follow if u like My Content.

Warning Signs for BTC short term drop!Bitcoin is showing some Strong reversal signs for at least short-term drop.
Let's look at all those points that might be pointing towards a pullback or short-term drop for BTC -
1) Shooting Star or Inverted Hammer on Weekly of Bitcoin and on same time Bitcoin went up with decreasing and low volume which is VERY WORRISOME :-
2) Head & Shoulder on Hourly :-
3) Potential Completion of Wave 1 in Bull case for BTC :-
4) Potentially Irregular running flat or maybe Expanded flat possibility for Bitcoin :-
5) 10 Years Yields might be looking bullish for at least short term and might be going upto 2.4/2.5 and touch highs of downward channel :-
6) US Dollar also looking somewhat bullish for short term :-
7) Big Money doesn't have good reasons to buy Bitcoin at high levels.
8) This is Earnings season for market and especially this week has big companies earnings so you never what might happen.
I am creating this post to raise some points that might be valid for bear case for Bitcoin for short term. Feel Free to share your thoughts in the comment section below.
However, I would love to be wrong as i am long as well for long term and would love if Bitcoin continue it's Bullish run as it would be better for all of us.
In the end, stay safe. And Enjoy everyone.

What Does the Inverted Hammer Candlestick Pattern Mean? Hello Traders!
Have you ever wondered when will a strong trend end? Do you struggle to spot candlestick patterns that potentially signal when the bulls or bears might take over?
Take a look at this example of EUR/CAD and let's see how the trade plays out! :)
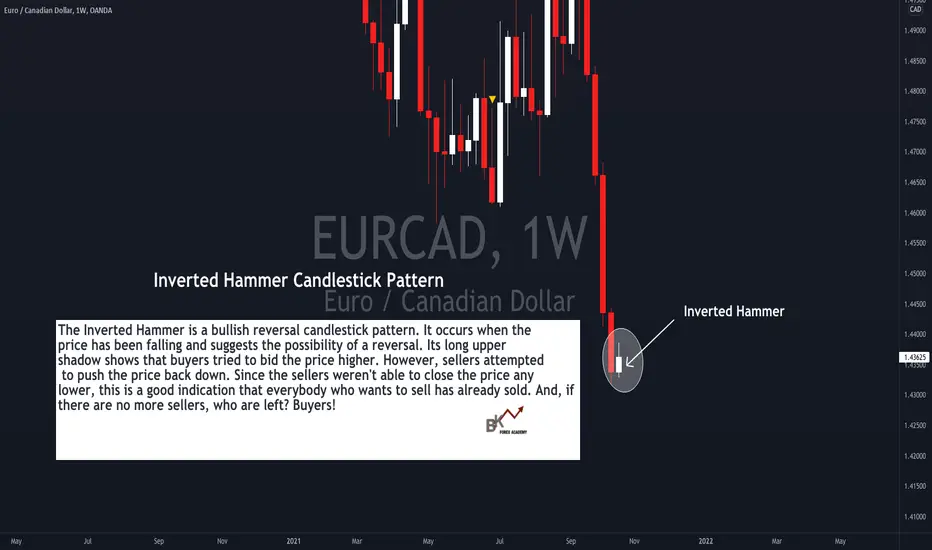
About the Inverted Hammer Candlestick Pattern and Why It Forms:
The Inverted Hammer is a bullish reversal candlestick pattern. It occurs when the price has been falling and suggests the possibility of a reversal. Its long upper
shadow shows that buyers tried to bid the price higher. However, sellers attempted to push the price back down. Since the sellers weren't able to close the price any
lower, this is a good indication that everybody who wants to sell has already sold. And, if there are no more sellers, who are left? Buyers!
And just an important observation, the Inverted Hammer has a small real body, and has a large upper shadow with a small or no lower shadow (also known as "wick").
Would you like to receive more "live charting" tutorials like this?? Comment below and let us know! :)
Happy Trading!
WMT longEntry price: 144-145$
Target price: 150-151$
Stop loss: 142-143$
Bollinger bands: the price is approaching the lower band
Candle pattern: inverted hammer
Fibonacci retracement: the price is approaching 1 (144,43) level
Conclusions: Bollinger bands and candle pattern suggest a trend pullback. Moreover, the price is approaching the Fibonacci level, thus the long position is recommended with the stop loss under the resistance level.
No financial advice

Good entry signals and trade managementWe entered on the inverted hammer in line with the weekly chart downtrend .we will be holding it till the next support .Short term support of the daily or 4H timeframe, and the longterm support of the weekly timeframe.
Let the profits run.Lets be disciplined to achieve consistency

Signs of a reversal coming due to Volume Exhaustion
This stock has been way too hot. Which is awesome, my calls printed every day this week. However, it's likely do to reverse, and this is due to possible volume exhaustion on the stock.
How to tell if the stock is approaching V.E.?
1- Gap up on the chart. From Tuesday to Wednesday the stock made a considerable gap up on the daily chart.
2- Huge spike in volume. Just look at the flipping volume. 224+ Million shares traded???? What????
3. Evening star candle on the daily (in this case its and inverted hammer....also bearish).
**Credit is due to I Heart Stocks channel on YouTube. Jack really knows what he's talking about and called this on yesterdays (Tuesday nights) AMD video.**

GBP/USD Forms Inverted Hammer In Weekly Next Target 1.36600GBP/USD Forms Inverted Hammer In Weekly Candle. Sell GBP/USD Short Term With Target of 1.36600 SL 1.42500

V LONGReady for breakout?
- Nice cup and handle formation on Daily/4hr
- Looking for a pullback around $32.62
Trade Suggestions
- Entry on confirmed bull candle with volume on 4hr
- Swing contract at least a 2 week out 240c or 245c

BTCUSD LongLast time we called the BTC short. This time we are looking for a long to 45k.
1. Market sentiment has shifted to bearish which is why we prefer to be bullish.
2. Buy volume has been increasing
3. Weekly candle is about to close as a bullish inverted hammer
This is not financial advice this is for educational purposes.
