BULLISH - Short Term Breakout - Inverted Head and Shoulder Regarding the daily price forecast from July 28, 2025 (Monday), through August 1, 2025 (Friday), the projections are derived from the bull flag continuation pattern, cross-referenced with aggregated analyses from recent market data, technical indicators (such as RSI and MACD showing neutral-to-bullish momentum), on-chain metrics (indicating accumulation at $115,000–$117,000), and a distribution of expert predictions. These include short-term consolidation with a potential dip for liquidity clearance, followed by a breakout, aligning with historical post-halving cycles and institutional inflows. Note that cryptocurrency prices are inherently volatile and influenced by factors such as Federal Open Market Committee outcomes, ETF flows, and macroeconomic events; these forecasts are speculative and not financial advice.
• July 28, 2025 (Monday): Anticipated consolidation within the flag channel amid low weekend volume. Expected range: $116,800–$118,500. Key targets: Support at $116,700 (lower flag boundary, potential entry for accumulation); resistance at $118,500 (upper flag line, breakout watch level). Average closing prediction: $117,800, reflecting neutral sentiment with minor downside risk if global markets weaken.   
• July 29, 2025 (Tuesday): Possible test of lower support amid early-week volatility, potentially sweeping liquidity before rebounding. Expected range: $116,000–$119,000. Key targets: Downside at $116,000 (critical on-chain accumulation zone); upside at $119,000 (initial breakout threshold). Average closing prediction: $117,500, with a 40% probability of a brief dip followed by stabilization.   
• July 30, 2025 (Wednesday): Breakout attempt likely if support holds, driven by mid-week momentum and potential dovish policy signals. Expected range: $117,500–$120,500. Key targets: Support at $117,000 (mid-channel level); resistance at $120,000 (psychological barrier and prior high). Average closing prediction: $118,900, assuming bullish confirmation above $118,500.   
• July 31, 2025 (Thursday): Extension of upward movement post-breakout, with volume potentially increasing. Expected range: $118,500–$122,000. Key targets: Support at $118,000 (retest of breakout level); resistance at $121,000 (flagpole projection start). Average closing prediction: $120,200, supported by technical alignment and ETF inflow trends.   
• August 1, 2025 (Friday): Momentum continuation toward weekly close, with risk of profit-taking. Expected range: $119,500–$123,500. Key targets: Support at $119,000 (new floor post-breakout); resistance at $123,000 (extended target based on pattern measurement). Average closing prediction: $121,800, aligning with broader bullish forecasts for early August.   
Invertedheadandshoulders

GBPUSD Long Trade Alert – Inverted Head & Shoulders BreakoutGBPUSD has confirmed a classic Inverted Head & Shoulders pattern, signaling a strong bullish reversal opportunity on the 2-hour chart. Price has successfully broken above the neckline resistance zone (~1.3490) and has now retested that zone, forming a bullish engulfing candle — an ideal confirmation for long entries.
🟢 Trade Plan:
Entry: After bullish engulfing candle formed on neckline retest (~1.3490–1.3500)
Stop Loss: Just below the right shoulder low / retest swing low (~1.3455)
Risk/Reward Ratio: ~4:1 (High reward with tightly controlled risk)
🎯 Target Levels:
Target 1: 1.3555
Final Target (Projected): 1.3620
These levels align with structure resistance and measured move of the pattern
📌 Why This Trade Matters:
Pattern confirmed ✅
Retest successful ✅
Bullish confirmation candle ✅
Clean invalidation and upside potential ✅
This is a textbook reversal play, offering solid structure, clear stop placement, and attractive upside. Perfect for swing traders or short-term position setups.
📉 Trade what you see, not what you think. Let price action lead your execution.
=================================================================
Disclosure: I am part of Trade Nation's Influencer program and receive a monthly fee for using their TradingView charts in my analysis.
=================================================================

GBPUSD Long Opportunity – Inverted Head & Shoulders PatternGBPUSD is currently forming a classic Inverted Head & Shoulders pattern on the 1-hour timeframe — a powerful trend reversal signal that typically marks the shift from bearish to bullish momentum. The structure is clear, with a defined left shoulder, head, and right shoulder, and price now approaching the neckline resistance around 1.3488–1.3495.
Traders should now shift focus to two key confirmation events:
A neckline breakout
A successful retest of the neckline with a bullish reversal candle (e.g., bullish engulfing)
🔍 Trade Plan (Long Setup)
Entry: After 1H candle closes above neckline (~1.3490), wait for a retest of the breakout
Enter long on bullish confirmation candle during the retest
Stop Loss: Below the swing low of the retest (around 1.3440–1.3450)
Risk/Reward Ratio: ~5.5:1
🎯 Target Zones:
TG1: 1.3540 (Minor Resistance)
TG2: 1.3585 (Next structure zone)
Final Target: 1.3627+ (Full measured move from pattern)
📌 Confirmation Tips:
Look for bullish candlestick confirmation on neckline retest (bullish engulfing, hammer, or strong rejection wick)
Avoid entering inside the pattern – confirmation is key to reduce false breakouts
⚠️ Note to Traders:
This setup aligns with a possible shift in sentiment for GBPUSD. The pattern is developing against the larger downtrend, so discipline and stop-loss protection are crucial. A successful breakout and retest would suggest a potential short-term bullish reversal with clean upside targets.
🧠 Stay patient. Let the breakout confirm. Execute with structure.
=================================================================
Disclosure: I am part of Trade Nation's Influencer program and receive a monthly fee for using their TradingView charts in my analysis.
=================================================================

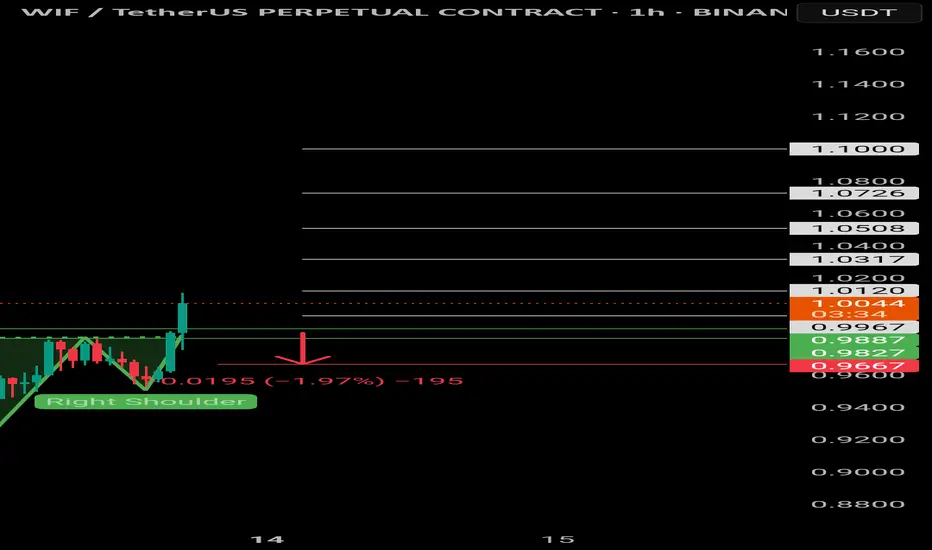
$WIF | Inverted head and shoulders $Wif/Usdt
BINANCE:WIFUSDT.P
The price is formed the Inverted head and shoulders pattern and did a breakout of the neckline, expecting the price to retest green lines (neckline).
If 1H CC hit and bounce above the green lines, it'll be a long opportunity.
Entering at current price will increase the SL, it's suggested to wait for a retest, to have better entry and a good risk management.
Use only 1-2% of your portfolio.
NFA, DYOR
TP:
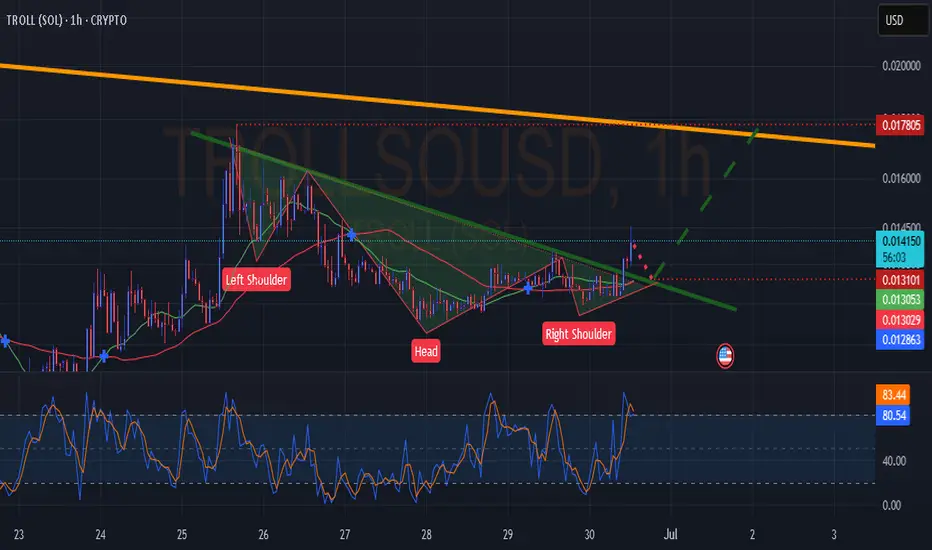
TROLL(SOL) IH&SGood day everyone. IH&S On troll. Touch back to the trend_line & take off to the upper red dotted line. Not financial advice.
Breakout Alert: AMD Head & Shoulders Points to $160+Overview
Name: Advanced Micro Devices, Inc.
Ticker Symbol: AMD
Exchange: NASDAQ
Founded: 1969
Headquarters: Santa Clara, California, USA
CEO: Lisa Su (as of 2025)Sector: Technology / Semiconductors
About
AMD is a leading semiconductor company known for its high-performance computing and graphics solutions. It competes with Intel and NVIDIA in the CPU, GPU, and data center markets. Its product line includes Ryzen (desktop/laptop CPUs), EPYC (server CPUs), and Radeon (GPUs), with strong expansion in AI and custom silicon for next-gen applications.
Fundamentals
Earnings: AMD reported strong Q1 2025 earnings with a beat on both revenue and EPS, supported by explosive demand in the AI and data center segments.Revenue: $6.52B, up 21% YoY
Outlook: The company raised guidance for the second half of 2025 as it expects to benefit from the AI chip boom and new product rollouts.
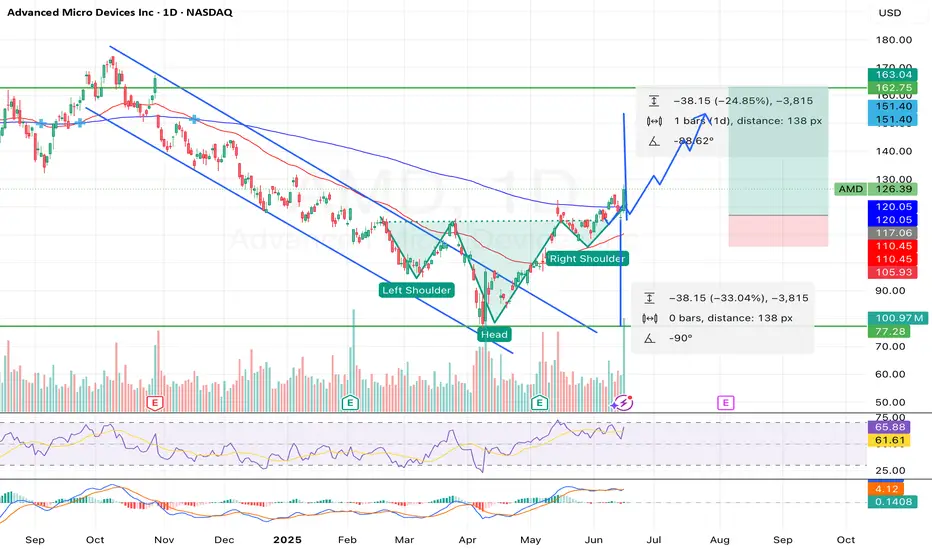
Technicals (4H Chart)
Inverted Head and Shoulders pattern confirmed with neckline breakout around ~$117
Breakout from Falling Channel aligning with bullish reversal structure
Price surged past resistance with strong volume, currently at $126.39 (+9.71%)
RSI at 65.88, approaching overbought but not signaling weakness
MACD bullish crossover, confirming momentum
Short-term target range: $145–$150, with extended projection up to $162.75
📌 Support Levels: $117, $111.50📈 Target Price (TP): $162.75 (based on pattern breakout height projection)
💡 My Take
AMD just pulled off a textbook bullish reversal — inverted head and shoulders breakout combined with a falling channel exit. With strong macro trends in AI hardware and data center expansion, this move feels well-supported fundamentally and technically.
The clean neckline breakout and explosive candle suggest continuation. I am expecting a potential consolidation around $130–$135ish before next leg to $150+. If momentum holds, $162+ is possible before August.
💼 Position
Type: AMD 145 Call
Expiry: July 03, 2025
Quantity: 15
Average Cost Basis: $.038
Date Purchased: June 12, 2025
Last Price: $0.47
Total % Gain/Loss: +23.4%
I entered after the neckline break and riding the wave. AMD’s setup is too clean to ignore — high conviction play.
Could BOJ's "HOLD" on Rates Turn AUDJPY "On Its Head"?Here I have a Multi-Timeframe analysis on OANDA:AUDJPY which is giving multiple signs of Higher Prices potentially to come!!
First on the Daily we can see that Price formed a Hammer Candle after testing the March 11th Support Zone and as the next Daily candle forms (Today), we are already seeing a Bullish Confirmation candle begin!
*Bullish Engulfing would be a textbook Confirmation Candle!
Now zooming into the 4Hr / 1 Hr Charts, this Hammer is formed by what looks to be a very Strong Reversal Pattern, the Inverted Head and Shoulders!
Now we are still waiting for the Confirmation of the Pattern where Price needs to rise to the "Neckline" or Resistance Level.
Once Confirmed, we will look for a Breakout of the Pattern and if Validated, could deliver great Long Opportunities as a Breakout and Retest of the Inverted Head and Shoulders Pattern!
If the Pattern is Successful, we could expect the Price Target to be at the next level of Resistance being the 95.3 - 95.6 Area!
Fundamentally, the BOJ begins the week with Policy Rate decision Monday evening where they forecast a HOLD on Interest Rates, staying at .5%. This could have drastic implications on the JPY, potentially weakening it.

$INJ - Inverted head and shouldersCRYPTOCAP:INJ
BINANCE:INJUSDT.P
The price recently broke out from the inverted head and shoulders pattern; now, the price is going to retest the pattern's neckline.
If the price hits and bounces above the white line zone, or if the 4H candle hits and closes above the upper white line, it will be a good long opportunity.
TP: YELOW LINES
SL: 12.052 / 4H CC BELOW
NFA, DYOR
FOLLOW FOR MORE AND SHARE WITH YOUR COMMUNITY.
DON'T FORGET TO HIT THE BOOST BUTTON.

Inverted Head and Shoulders Pattern Bitcoin first bearish pattern i've seen inverted head and shoulders pattern! $94,000 possible then a run in December! for Bitcoin

EURAUD Swing Trade (Long)After seeing price come into the premium of the daily structure and a strong level of daily support we are now seeing an inverted head and shoulders pattern, which can be seen on the daily and 4h timeframes.
If we see a daily candle break and close above the orange resistance zone (which is also the neckline of the inverted head and shoulders pattern) then i will be looking for price to come back to retest the neckline to target the daily HH (1.8400)

Beautiful SetupClosed at 141.02 (21-02-2025)
Beautiful Bullish Divergence +
Inverse H&S in progress.
As mentioned earlier, 144 - 146 is
an immediate resistance; once crossed
& sustained, we may witness 152 - 155
& then 175 - 180.

Bullish
Closed at 34.03 (21-05-2025)
Hidden Bullish Divergence on bigger tf.
Bullish Divergence on shorter tf.
Immediate resistance is around 34 - 34.10
Crossing & Sustaining this level may exposes
upside towards 47 - 48
However, mid way, 40-41 & 44-45 are important
resistances that should not be ignored.
On the flip side, 30 - 32 are important Support levels.
and 29.80 Must not Break on Monthly Basis.

TATA Tech Breakout: Inverted Head & Shoulder Targets ₹856+A bullish reversal pattern forming in Tata Technologies Ltd (TATATECH) on the daily timeframe.
Pattern Identified:
📌 Inverse Head and Shoulders Pattern
Left Shoulder: Price dips and recovers
Head: A deeper dip followed by recovery
Right Shoulder: A higher low and bounce
Neckline: Resistance around ₹755 is tested multiple times
Key Technical Insights:
Breakout Above Neckline: Today's close above ₹755 confirms breakout
Target Projection:
Target = Neckline + Height (from Head to Neckline)
Projected Target = ₹856+
Volume Confirmation (optional): Typically, volume should rise during breakout for stronger confirmation
Sentiment:
Reversal from downtrend to possible uptrend
Bullish momentum expected to continue toward the ₹856+ zone

Nifty back to bull controllhi Traders,
Weekly the swing had a correction of 38%.
The daily time frame's Inverted H&S pattern is a confirmation of the trend change(from correction to impulse wave)
Nifty 50 will make a move from 500 to 1500 points till the previous high of the weekly swing.
The targets are mentioned in the chat.
As we have 14days to expiry, there is enough time to hit target 1. Interested traders buy ATM CALL option or FUTURES
sbull.co

Weekly Range bound | 4H swingFellow trader,
Eicher motors has broken the range bound market in weekly timeframe, and now the market is re-testing.
Aggressive entry : Whoever enter the market immediately after the breakout
Conservative entry : Whoever enter after the market re-test.
The weekly range bound breakout target is 5684 & the SL for the same is 4548
Now in the re-test, there is a clear formation of a swing in 4H/1D timeframe, after a inverted H&S pattern breakout in 1H timeframe consider to enter the trade based on this swing.
Considering the pattern of Weekly or 4H time frame trade can be taken, the SL and Targets are in the chart.
The Risk : Reward ratio for the swing is 1:4.47
Sensibull : sbull.co

Inverted H&S Pattern in place.
Inverted H&S Pattern in place.
Breakout done.
May take a Risk with a SL of 81 on Closing basis.
Targets can be around 92 - 95 then 100-102

KIMSKIMS has given inverted H&S breakout with decent volume. The depth is around 28-30% from neckline to bottom of the head. So if we add it to breakout line then we may see the same move on upper side. If we look at weekly timeline then also it has given resistance breakout. Seems very promising.

SBIN - Inverted Head and Shoulder - BreakOut- DailyThe chart clearly depicts Inverted Head and Shoulders (H&S)**, which is a **bullish reversal pattern**. Here's the updated analysis for **SBIN (State Bank of India)**:
---
### 🧠 **Pattern Recognition: Inverted Head & Shoulders**
- **Left Shoulder**: Formed in **early February 2025**
- **Head**: Deeper low formed in **early March 2025**
- **Right Shoulder**: Higher low formed in **early April 2025**
- **Neckline**: Around **₹785**, which has just been **broken on strong volume**
This pattern often marks the end of a **downtrend** and the beginning of an **uptrend**.
---
### 📏 **Measured Move Target**
- Neckline Breakout Level: ₹785
- Depth (Head to Neckline): ₹104.75
- **Target = ₹785 + ₹104.75 = ₹889.75**, which aligns almost exactly with the marked level of **₹888.90**
---
### 🔍 **Volume Confirmation**
- Volume has **increased notably** on the breakout candle, which is a **key confirmation signal** for H&S patterns.
---
### 🧱 **Support and Resistance**
- **Breakout support (neckline)**: ₹785
- **Next resistance levels**: ₹888.90 → ₹912
- **Downside support zones**: ₹775, ₹680 (head base), and major at ₹620.70
---
### 📌 **Summary**
- ✅ **Inverted Head & Shoulders** pattern confirmed
- ✅ Breakout above neckline with volume = bullish
- 🎯 **Target**: ₹889 (approx 11.5% upside from breakout)
- 🔄 Watch for potential retest at ₹785 for a low-risk entry
---

SBIN Long *Inverted Head&ShoulderExciting pattern on SBIN(State Bank Of India) chart!
Validation of my target:
1. Inverted Head & Shoulder pattern confirmed on daily chart.
2. Neckline breakout already happened @ 822
3. Target Calculation: Neckline + (Neckline - head low)
Approx. 874,
4. Technical Indicator also supportive
*RSI trending up from oversold zone
* MACD crossover happened recently.
Target will range between 10 points 864 to 874.
Risk to reward is 1:3
Stop Loss previous low 760
For Educational purpose only

Head and Shoulders Pattern: Advanced Analysis for Beginners█ Head and Shoulders Pattern: Advanced Analysis for Beginners
The Head and Shoulders pattern is one of the most widely recognized and reliable patterns in technical analysis. And today, I am going to teach you how to use it as efficiently as an experienced trader would.
Learning to spot and trade this pattern can be a great asset in your tool belt —whether you’re trading stocks, forex, or cryptocurrencies.
The Head and Shoulders is a well-known reversal pattern in technical analysis that signals a potential trend change.
⚪ It consists of three peaks:
The Left Shoulder: A peak followed by a decline.
The Head: A higher peak formed after the left shoulder, followed by a decline.
The Right Shoulder: A smaller peak resembling the left shoulder, followed by another decline.
When these peaks form in a specific order and the price breaks below the neckline (the line connecting the two troughs between the shoulders), it indicates a bearish reversal from an uptrend to a downtrend.
█ What about Bullish reversals? Don’t worry — there's good news!
Conversely, the Inverse Head and Shoulders pattern forms at the bottom of a downtrend and signals a potential reversal to the upside. By recognizing the pattern early, you can position yourself for a high-probability trade with a clear entry and exit strategy.
█ How to Identify a Head and Shoulders Pattern?
I truly believe the best way to learn any trading strategy is to keep it simple, away from the “technical” jargon unless absolutely necessary. We’ll do the same with this strategy.
Despite its varied usage, you can break it down into four simple steps:
1. Look for the Left Shoulder
The first part of the pattern forms when the price rises , creating a peak. Then, it declines back down to form the trough . This creates the Left Shoulder of the pattern.
Example: If the price of Bitcoin (BTC) rises from $85,000 to $90,000, and then declines to $87,500. This is your Left Shoulder.
2. Spot the Head
The second part of the pattern is the Head . After the Left Shoulder, the price rises again , but this time, it forms a higher peak than the Left Shoulder. The price then declines again, creating a second trough .
Example: Continuing with Bitcoin, after the price dropped to $87,500, it rises to a new high of $95,000 before dropping back to around $90,000. This $95,000 peak is the Head, which is higher than the Left Shoulder.
3. Find the Right Shoulder
After the decline from the Head, the price rises again, but this time, the peak should be smaller than the Head, forming the Right Shoulder . The price then starts declining again, and this is where the neckline is formed (connecting the two troughs).
Example: Bitcoin then rises from $90,000 to $92,000 (lower than the $95,000 peak). This forms the Right Shoulder, and the price starts to decline from there.
4. Draw the Neckline
The neckline is drawn by connecting the lows (troughs) between the Left Shoulder and the Head, and between the Head and the Right Shoulder. This is your key reference level.
█ How to Trade the Head and Shoulders Pattern
Once you've spotted the Head and Shoulders pattern on your chart, it’s time to trade it. And yes, it did need a separate section of its own. This is where most amateur traders mess up - the finish line.
1. Wait for the Neckline Breakout
The most crucial part of the Head and Shoulders pattern is the neckline breakout . This is when the price breaks below the neckline, signaling the start of the trend reversal.
Example: After the price rises to form the Right Shoulder at $92,000, Bitcoin then drops below the neckline (around $90,000). This is the confirmation that the pattern is complete. The price of BTCUSD is likely to continue downward past the 90k mark.
2. Enter the Trade
Once the price breaks below the neckline, enter a short position (for a bearish Head and Shoulders pattern). This is your signal that the market is reversing from an uptrend to a downtrend.
3. Set Your Stop Loss
Your stop loss should be placed just above the right shoulder for a bearish Head and Shoulders pattern . This makes sure you are protected in case the pattern fails and the price reverses back upward.
Example: Place your stop loss at around $93,000 (just above the Right Shoulder at $92,000) on BTCUSD.
You can also try one of these strategies I have used in the past:
⚪ Conservative Stop: Place the stop above the head (for bearish H&S) or below the head (for bullish iH&S) for maximum safety.
⚪ Aggressive Stop: Place the stop above the right shoulder (for bearish H&S) or below the right shoulder (for bullish iH&S) to reduce your stop size.
⚪ Neckline Reclaim Invalidation: Exit the trade if the price reclaims the neckline after breaking it. This could be an indication of a false positive/invalid pattern.
4. Set Your Profit Target
To calculate your profit target, measure the distance from the top of the Head to the neckline and project that distance downward from the breakout point.
Example: The distance from the Head at $95,000 to the neckline at $90,000 is $5,000. So, after the price breaks the neckline, project that $5,000 downward from the breakout point ($89,800), which gives you a target of $84,800.
5. Monitor the Trade
We’re in the home stretch now, people. This is the 9th inning.
There’s only one job left: keeping an eye on any retests or contrarian moves.
As the price moves in your favor, you can scale out or move your stop loss to break even to lock in profits.
█ What makes H&S strategy an all-time classic?
It’s simple. It works.
This pattern works because it reflects a shift in market sentiment:
In a Head and Shoulders pattern , the uptrend slows down as the market struggles to make new highs, and then the price ultimately breaks down, signaling that the bulls have lost control.
In an Inverse Head and Shoulders pattern , the downtrend weakens as the market fails to make new lows, and the price breaks upwards, signaling a bullish reversal.
⚪ Here are a few points to remember as a cheatsheet for Head and Shoulders patterns:
Wait for the neckline breakout to confirm the pattern.
Set a stop loss above the right shoulder for protection.
Project the price target using the height of the head for a realistic profit goal.
Always monitor the trade for any signs of reversal or false breakouts.
Mastering this pattern can be a game-changer for any trader, but like any tool, it’s only effective when combined with other indicators, strategies, and a solid risk management plan.
-----------------
Disclaimer
The content provided in my scripts, indicators, ideas, algorithms, and systems is for educational and informational purposes only. It does not constitute financial advice, investment recommendations, or a solicitation to buy or sell any financial instruments. I will not accept liability for any loss or damage, including without limitation any loss of profit, which may arise directly or indirectly from the use of or reliance on such information.
All investments involve risk, and the past performance of a security, industry, sector, market, financial product, trading strategy, backtest, or individual's trading does not guarantee future results or returns. Investors are fully responsible for any investment decisions they make. Such decisions should be based solely on an evaluation of their financial circumstances, investment objectives, risk tolerance, and liquidity needs.

Can Bulls Flip GU "On Its Head" @ 38.2% Level?Last week we saw FX:GBPUSD attempt to Break Above the 1.25 Resistance Zone that its been struggling with since November 2024 and was sent back down underneath following the Fed's decision to Hold Interest Rates.
We can see that Price so far seems to be following a Head & Shoulders layout where Price now is declining down to the Low that formed the "Left Shoulder" @ ( 1.23745 - 1.23518 )
What makes this Price Range so favorable is that if you take the Fib Retracement Tool from the Low of the "Head" @ 1.20991 to the 2nd Touch of the "Neckline" @ 1.25232, the 38.2 % Retracement Level lands right at the potential Support level of the "Left Shoulder"
-If Price finds Support at this level, we can suspect the Low to form the "Right Shoulder" then for Price to work back up to the "Neckline" for a Break and Close for Confirmation of Pattern to then look for more Buying Opportunities!
*Price Breaking and Closing the Neckline, signaling Confirmation of Pattern, will deliver a 90% Success Rate to the expected Bullish outcome.
*Watch for Increase in Volume after Price is Successfully Supported by Low of Left Shoulder and RSI to maintain Above 50!
Fundamentally,
GBP:
Final Manufacturing PMI - Monday
Final Services PMI - Wednesday
Construction PMI/Bank Rate - Thursday
USD:
ISM Manufacturing PMI - Monday
JOLTS - Tuesday
ADP Non-Farm Employment/ISM Services PMI - Wednesday
Unemployment Claims - Thursday
AVG Hourly Earnings/ADP Non-Farm Employment/Unemployment Rate - Friday

Energy Fuels Stock: Potential Reversal Ahead?AMEX:UUUU
After reaching a low of $0.78 in March 2020, AMEX:UUUU has been on a recovery path. Currently, it's forming an inverted head and shoulders pattern, with the key neckline at $7.47. A breakout above this level could signal a move towards $9.73.
However, watch out for the bearish alt-bat pattern near $9.73, which could lead to a pullback. Stay alert for key price action and adjust your risk accordingly.
⚠️ Note: Any violation of the $4.19 support would invalidate the projected patterns in this idea.

$NYSE:NRGV poised for a breakout with multiple Price TargetsThe global push towards a cleaner energy future is accelerating, but a significant piece to the puzzle remains: the intermittency of renewable energy sources like solar and wind. This challenge has fueled a market for energy storage solutions.
Energy Vault ( NYSE:NRGV ) develops sustainable energy storage solutions designed to utility-scale energy storage for grid resiliency. The company's proprietary, gravity-based Energy Storage Technology and the Energy Storage Management and Integration Platform are intended to help utilities, independent power producers and large industrial energy users.
The company recently announced a significant 1.0 GWh energy storage project in Australia, which was highlighted by the CEO in a recent interview with MarketBeat's Bridget Bennett. Energy Vault's most recent project serves as a testament to its unwavering commitment to global expansion, underscored by the recent recognition it received from TIME magazine as one of the Best Inventions of 2024 for its groundbreaking gravity energy storage technology.
Analysis
Looks like this is setting up to break the $2.56 resistance line.
Observations:
This appears to be ready to break out of multiple patterns, which will present multiple near term price targets
$1 upside (~$4)... very close to the head and shoulders pattern PT of $3.80.
Falling wedge pattern PT of $7.17
- Squeeze momentum is building and firing.
- Current volume doesn't come close the the recent spike, but it is above the MA volume.
Entry Point ~$2.60 (or above) - after a closing above the $2.56 resistance
