EUR/USD Technical BreakdownEURO / DOLLAR; Technical Breakdown (Long)
So, as you can see we've had a depletion at 0.98800 where price failed to break the lows and printed a clear inverted head & shoulders
After the third bounce of the trendline, I was expecting price to break through, indicating price is reversing
We have clear / well respected support / resistance zones marked out, indicating where price is likely to go after breaking bearish market structure
Now, for me personally, I'd like to see price come back to the golden zone between the 61.8 & 78.6 fib levels to give the best / highest probability set up whilst maximising our reward to risk
You may have noticed these fib levels also line up with the trendline, a strong area of support (0.99250) as well as the neck line of the inverted head & shoulders
However,
This set-up isn't guaranteed, but, if price does come back to this zone, I will be looking to take buys as soon as we have 3 rejection candles on the 5m or 15m timeframe
We may even have a rejection of the 0.99750 level which price has previously respected as support, but again, in my eyes, the best set up which we as traders should all wait for is the highest probability set ups which to me is the deeper pullback to that 0.99250 level.
Hope you enjoyed that technical breakdown on EU. Let me know what you guys think about this pair.
Invertedheadandshoulders

GBPNZD LONG IDEAIf market closes above 1.86913 on the 1h and 4h, i will be looking to enter for a long position to 1.92633 (TP)
It will also coincidentally create a inverted H&S on the 4h and Daily TF.

Inverted head and shoulder spottedInverted head and shoulder spotted
stay tuned with a close above 770
Decent volumes

CADCHF REVERSALThe pair recently hit the support and bounced as earlier predicted.
An inverted head and shoulder has been formed so I'm expecting bullish price movements.
The initial target is 0.74600

LongHe mine fellow traders another buying opportunity on
AU
confluence
1. inverted Head and shoulder pattern
2. Break of structure
Im waiting for price to close above my EMA lines ...
Share and Comment ...

BNBHellow traders,
Here is a possible inverted head and shoulders on BNB forming a right shoulder. This trade has a nice small risk and beautiful reward. The price action is below many moving averages on the daily, 2D, 3D and weekly to hold the price down. With the rest of the market breaking bearish, this looks like a solid play. I hope it works out for you!
Have a green week!
Savvy

GBPUSD: Daily IHNS Forming on RS of Monthly IHNSSeveral weeks ago an Inverted Head and Shoulders was indentified on the Monthly Chart of GBPUSD, The Monthly Candle was forming a Potential Right Shoulder with Hidden Bullish Divergence and on the Daily we did get a decent move up; However, it's recently made a retrace back down on the Daily and may potentially be forming a smaller Daily IHNS almost Mirroring the Monthly Pattern which if plays out correctly will propel price towards the Monthly IHNS Validation Line up near $1.42.

Inverted Head and Shoulders on Bitcoin Gold/BitcoinThis is an old fork of Bitcoin that i haven't heard much about in awhile but it used to be liked for being easier to mine however since 2019 hardly anyone remembers it and during this time of silence BTG has been forming a Huge In Your Face Visible on both the Weekly and Monthly Harmonic Inverted Head and Shoulders Pattern that if plays out will send it up to the 0.786 Fibonacci Retracement.

KRBL has given a breakoutInverted head and shoulder breakout with volumes
further upmove is possible
stay tuned
can be bought around retest as well

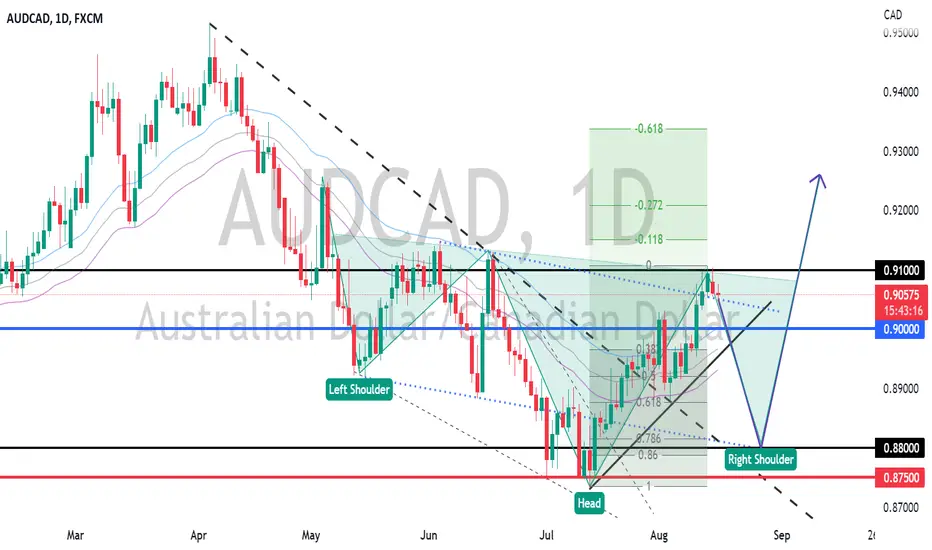
AUDCAD INVERTED HEAD & SHOULDER PATTERNLooking for possible retracement to 0.8800 to form the Right Shoulder at 78.6 & 61.8 retracement Level.
(240m) The German Dax with an inverted head and shouldersGLOBALPRIME:GER30
We projected this pattern for the forex analytix community last week, and it seems to be working as expected. Let's see if the German Dax holds up above 13436.
Inverted head and shoulders:
Resistance/neck at 13436 .
Default targets for the pattern projected at 14217 ;
Eventual bearish crab pattern projected below at 14036 .

Bitcoin Dominance may see massive recovery soonWe never quite made it to the 1.5x target from our double top back in Jan 2021. That's not to say it's still possible we see it and even reach the 2X target making new ATLs.
However, I can see the possibility of a weaker low made near the top of the green support area, and that occurs and we turn back up from there, dominance may for a triple bottom (or an inverted head & shoulders).
Should that occur, we will never see a new ATL and instead a very fast and hard recovery of Bitcoin's market dominance.
This could mean two things:
1.) Bitcoin is about to destroy the altcoin market, and itself.
2.) Bitcoin is about to destroy the altcoin market and go on a tear.
If we break below the green support, then expect the opposite to occur:
1.) Bitcoin may continue to correct upwards slowly, and altcoins may go on a tear
2.) Or, some of the most promising altcoins start to take away from bitcoin's dominance, and we end up with a new type of market.
This particular idea is in support of the former, where bitcoin dominance goes up and fast, if dominance were actually a trade-able instrument, this would suggest "going long" after stopping somewhere near support (green box).
Alternative idea linked under related ideas below, supporting either movement in either direction.
Here's a zoomed out view of line chart, showing our Jan 2021 double-top, and our previous low (ATL), which is still lower than the 1.5X target for the double-top:

INVERTED HEAD & SHOULDERS !!!while lurking in HDFC Bank charts i came across this inverted head and shoulders which i thought was pretty cool so i decided to post it here just for the record. nothing much to say about it really. lol
-Happy Trading !!!

This ETF will predict the 2022 recession.Looking at the graph, we can see a very high-quality inverted head and shoulders pattern, because the second top made a way higher top than the first top. To add to that, the volume is decreasing rapidly, meaning we are very near the next bottom. This would be definitive for the ETF, because if this ETF increases in price, than the house prices would drop. This would cause a chain reaction, leading to a recession. That is why, on my last study, I said that the 2022 recession is closer than we think it is. A crisis is imminent, so be ready.
AMEX:DRV

Posible Inverted SHS???We need a 4 hr candle confirmation above 23.5k in order to confirm this pattern.
TP would be 24.577 BTC.


Bottom in ETH?Appears to be potentially highly oversold - clearly an incredibly bearish (nuclear) underlying trend:
Potential bottoming ih&s pattern:
We did however just form a lower low. This means that it may be prudent with good risk mgmt to run a long, and let the winner run if the price remains bullish.
Algo's tend not to stop hunt when the rewards are no longer there like they were.
Good luck in these robot wars mates.

Quickpost: Inverted head and shoulders on DYDXUSDTThe formation is pretty obvious, and the target setting is pretty easy as well. This is alt-season and the end of a bear market. You can almost throw a dart at the board and make some gains. This trade is a layup.
Linked ideas show general bullishness and reversals in the market.

WHA | Wave Projection | Inverted H&S Bull DivergencePrice action and chart pattern trading setup:
> Wave projection possible intermediate 4-wave rebound with inverted head & shoulders reversal pattern and MACD bullish divergence
> Entry @ Neckline pullback
> Target @ H&S Target or 0.386 retracement of previous 3-wave +6% upside
> Stop @ right shoulder - 3% downside
> RRR: 2:1
The downtrend target C-wave or final 5-wave estimated at 0.786 of the last B-wave
Always trade with affordable risk and respect your stop

Deepak NitriteSigns of trend reversal on Deepak Nitrite
a close above 1920 will take it to 2020 in no time
Inverted head and shoulder formation

FINOPB Looks like is going to break the resistance this timeLooks like have good upside
broken trendline nd took a support on trendline
RSI bullish
Close about 270 can take it to 288 in short term and even further
Stay tuned

SHIBUSDT | Wave Projection | downtrend breakout Inverted H&SPrice action and chart pattern trading
> Wave projection double zigzag correction ABC with downtrend channel breakout and EMA5 crossover SMA50 above neckline
> Inverted head and shoulders breakout, possible wave 1
> Target @ previous A-wave +50% upside
> Stoploss @ right shoulder -15-20% downside
> RRR 3:1
Always trade with affordable risk and respect your stoploss

MHRIL Looks good for positional trade.Aim for 5-8%. It can be easily achievable in 1-3 days.
My belief is to choose high winning probability trade with a risk-reward ratio going from 1:1 to 1:2.
The reason for booking profit of only 5-8% is because the market direction is not sure at this point. So better to aim for 1:1 risk-reward and rotate your money in better opportunities.
Take trade if all conditions meet at the end of the day 3:15-3:30 PM.
If you have any questions or suggestions, please leave a comment below.
I will personally reply to every single comment!
If you enjoyed this analysis, I would definitely appreciate it, if you smash that like button and maybe consider following my channel.
