Bullish Shark at Neckline of A Monthly Inverse Head & Shoulders We are at the PCZ of a Bullish shark at the neckline of an Inverted Head and Shoulders Pattern visible on the Monthly and are showing Hidden Bullish Divergence.
Invertedheadandshoulders

ALGOI would say without any EW this looks like an IH&S pattern forming on the USD pairs with an upside target of $1.10- $1.17. It won't be easy but I feel $ALGO is lagging vs the BTC pair on the daily chart. So my analysis is pointing us towards a larger move to the upside here very soon. We went long in my group at .82-.84c.

EURJPY - BUYBroken Daily trendline in combination with broken Inverted Head and shoulders pattern and bullish engulfing bar.

L&T Inverted head and Shoulder Pattern L&T forming beautiful Inverted head and Shoulder Pattern .
Easy 15% gain over next 1-2 Months

EURGBP, H1 - time to buy?Price moves in wedge pattern and is making potential inverted head and shoulders pattern. So breakout needed as confirmation for long

Cardano bullish? Falling wedge and inverted H&SI just opened a long position on ADA/USDT
two bullish patterns, one within the other: inverted head and shoulders | Falling wedge
1- falling wedge:
Stats:
Break-even failure rate: 11% in a bull market; 11% in a bear market
Average rise: 32% in a bull market; 26% in a bear market
Percentage meeting price target: 70% in a bull market; 60% in a bear market
2- inverted head and shoulders:
Stats:
Break-even failure rate: 3% in a bull market; 4% in a bear market
Average rise: 38% in a bull market; 30% in a bear market
Percentage meeting price target: 74% in a bull market; 58% in a bear market.
As always, risk vs reward is the key thing to consider for someone who wanna be a successful trader; I've already set up my stop loss and will shortly update this idea with price targets.
Trade carefully ;)


Great setupNYSE:U
Absolutely love this chart. Missed the bottom play on it but still think it has alot of room to move up. Likely double tops for a pullback to trend for some consol.
Will be watching & playing this over the next 4 week.


EURJPY, H4 - Inverted HSH patternNeckline needs to be broken for further move up. Target is the nearest resistance level

WISH: Complete Multiple Time Frame Analysis (H, D and W).Hello traders and investors! Let’s see how WISH is doing today, and do a Multiple Time Frame Analysis (MTFA) on it!
First, the 1h chart tells us that we have a possible IH&S pattern (possible, as it wasn’t triggered). The key point for us is the $ 10.34, as this is a pivot point and the neckline of the chart pattern.
Remember, every H&S or IH&S are just two pivot points mirrored, and this is why it works as a nice reversal when triggered . It denies the previous pivot, and triggers a new one, reversing the previous trend.
We are breaking the 21 ema for the first time in one month, and we might see something new here on WISH.
The $ 15 is the main target if WISH triggers the pivot point in the 1h chart, as it worked as support and resistance multiple times. The market has memory, and some price levels are relevant for the stock.
On the other hand, we must lose the $ 8.84, as this will create a bearish structure and WISH will keep dropping, probably to the $ 7.40.
WISH is engaged in a bear trend since the IPO, but the $ 15 seems to be a pivot point for WISH in the weekly chart.
This week is bullish so far, and if we do a bullish structure around here, it’ll be a good place for a bottom. Either way, I presented the key points for you in this analysis.
Remember to follow me to keep in touch with my daily updates, and if you liked this idea, please, support it!
Thank you very much!

PVR Inverted Head & Shoulders on DailyThis seems promising , keep an eye on PVR.
Simple price action, no jazz.

XAU / USD - Gold may see a big Rally3D chart here: Our 1D MA & EMA 50/200 both had death crosses, corrected to our potential Head on the HSi above, and now we've crossed back over again on the, printing golden crosses.
This adds to the potential for the proposed inverted HS shown on the chart above to complete, giving us minimum target above ~2100 if we cross our neckline and stay above it.
Success would be a new all-time high for gold, and if we stay above or re-test our previous ATH, we could rally much higher.


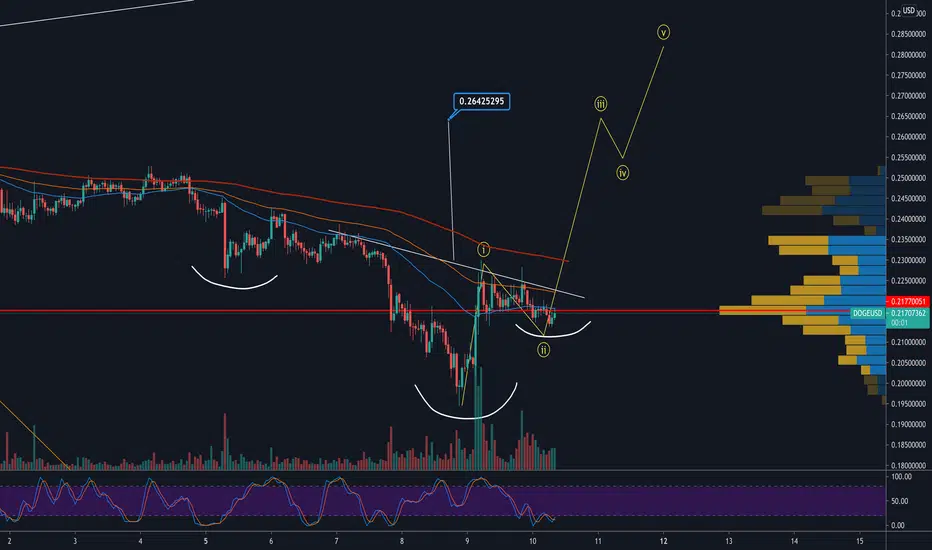
DOGEDOGE we have what appears to be an impulsive W1 and now in W2 pull back W3 taget is .26c and W5 is .29c looks like Elon canceled our .13c Doge op


Cardano bullish scenario: 3 bullish indicatorsWhile we've obviously been in a bear trend for the past weeks, Cardano might be indicating that a reversal is imminent.
Here are the three patterns/ indicators I am closely watching:
1- Falling wedge: reversal pattern, theoretical target at the beginning of the pattern
2- Inverted head and shoulders: work the same way as a regular head and shoulders
3- 9/30 cross strategy: While everybody is busy telling you about how amazing MA\EMA golden and death cross are, this trading setup that not everybody knows about can be quite relevant when you need to find an entry point. the principle is the same but instead of using two EMA or MA (a short and long one), this strategy uses a 9 EMA and a 30 WMA .

Potential Inverted Head and Shoulders forming - 30 Minute ChartBitcoin (BTC) found good support at 30,000 USD and is continuing to form Bullish trends at 31,000 USD and 32,000 USD like this Inverted Head and Shoulders pattern. Are we about to see some movement upwards for BTC?

WISH: I told you it was going to fly!Hello traders and investors! We nailed another target, and this time, on WISH.
In our last analysis ( link below this post, if you missed), we said that if WISH trades above $ 11.92, the $ 15 is the next target. Today, it did hit our target, 14 days after my analysis. A quick swing trade.
The reasons for this were quite simple: 1) The $ 11.92 was a pivot point in the 1h chart. 2) The volume was interesting. 3) The $ 15 area is a key point for WISH, as the daily chart shows:
As evidenced by the black arrows, t he $ 15 area was support and resistance multiple times in the past , and it was an obvious target.
The volume is quite high, and the odds are that WISH will defeat its resistance at $ 15 and seek the $ 20.11, the question is if it’ll do this with or without a pullback.
What’s more, I see the $ 15 area as a neckline for a huge IH&S chart pattern.
If you liked this analysis, remember to follow me to keep in touch with my free analysis, and support this idea if it helped you!
Thank you very much!

Bitcoin, H4 - breaking neckline should cause some move upAfter huge rejection of 30 000 level, price makes inverted head and shoulders pattern. Breaking neckline needed as confirmation.

USDCAD, H1 - inverted HSHInverted head and shoulders pattern should bring some move up after breaking neckline

