GBPCAD an inverse H&S? 🦐GBPCAD on the 4hchart is creating an inverse head and shoulder pattern.
The price is looking for a completion of the right shoulder and according to Plancton's strategy if there will be a break of the neckline we will be ready to set a nice long order.
–––––
Follow the Shrimp 🦐
Keep in mind.
🟣 Purple structure -> Monthly structure.
🔴 Red structure -> Weekly structure.
🔵 Blue structure -> Daily structure.
🟡 Yellow structure -> 4h structure.
⚫️ Black structure -> <4h structure.
Here is the Plancton0618 technical analysis , please comment below if you have any question.
The ENTRY in the market will be taken only if the condition of the Plancton0618 strategy will trigger.
Invertedheadandshoulders

Nifty 50 - Inverted Head and Shoulder pattern at 61% fib levelEverything explained in the chart .Cheers :D

VeChain - 4hr Inverted Head and ShouldersVeChain - A quick 4hr chart update
VeChain has broken upwards from its Inverted Head and Shoulders pattern.
VeChain is above its Bollinger Bands Middle Band Basis which is a 20 Period SMA. Note that the Bollinger Bands Upper Band has started to point upwards.
VeChain is below its 50EMA fro this 4hr timeframe. We need to close a 4hr candle above the 50EMA for this 4hr timeframe.
The Ichimoku Lagging Span (Chikou Span) is indicating momentum is upwards or this 4hr timeframe.
The Ichimoku Cloud Conversion Line (Tenkan Sen) is indicating short-term momentum is upwards for this 4hr timeframe.
The Ichimoku Cloud Base Line (Kijun Sen) is indicating mid-term momentum’s sideways for this 4hr timeframe.
VeChain is trying to get back over its Leading Span B (Senkou Span B) resistance level, crossing this level will take VET out of the Bearish Zone & back into the Equilibrium Zone of the Ichimoku Cloud for this 4hr Timeframe.
The Chaikin Money Flow (CMF) is showing that VET is still in the accumulation zone at 0.13 for this 4hr timeframe.
The ADX (Yellow Line) is at 47 slightly below its 9 Period EMA (White Line) which is at 48. The -DI (Red Line) is at 24.5 above its +DI (Green Line) which is at 15.1. Notice that the _DI (Red Line) is pointing downwards and the +DI (Green Line) is pointing upwards, if upwards pressure maintains then we may see the +DI (Green Line) cross back above the -DI (Red Line).
If VeChain closes this 4hr candle in the Equilibrium Zone, then VET will be poised to attack the Leading Span A (Senkou Span A) cloud resistance to try and get back into the Bullish Zone of the Ichimoku Cloud for this 4hr timeframe. If VET crosses back into the Bullish Zone, we will then get a Kumo (Cloud) Twist back in to green indicating a renewed Bullish Trend for this 4hr timeframe.
I hope this is helpful with your trading and hodl-ing 👍🔥🚀🌍🌔🪐🛸👽

BTU - Inverted Head & ShouldersBTU broke out of an inverted H&S neckline last week on high volume at 5.30. It is now 6.60 and there is probably a 30% chance (as with many breakouts) that it could retrace back to test the neckline within the first 1-2 wks. However this might not happen.. and with stop loss below 5.30, please position size accordingly if you are still inclined to "chase" this trade.
Disclaimer: TA is about odds, not guarantees. This is just my own analysis and opinion for discussion and is not a trade advice. Kindly do your own due diligence and trade according to your own risk tolerance and don't forget that money management is important! Thank you. Feel free to give me your thoughts ! :)

$NZDUSD - Inverted head shoulders confirmed only above $0.73Hi guys! 👋🏻
🔔 Inverted head and shoulders and a double bottom patterns could play out well for a long trade, though only above 0.73 resistance which is very strong.
🔔 Tuesday’s monthly New Zealand electronic card retail sales demonstrated growth in purchases, sales in April were up 4%, which is significantly higher than February’s 0.8%. Despite the positive news, NZD was not able to show significant growth against USD and lost in value against the Japanese Yen. So need to be very cautious, especially during the US CPI data release.
🔔 There also is a great support from Moving averages on 4H chart and on a daily chart
Daily
🔔 However RSI and MACD indicators are slightly bearish at the moment and a drop to 0.7200 and 0.71400 is also possible before another surge attempt.
🔔 One of the backers of the uptrend could be strong CPI data, which will be announced later today. There still are concerns among the strong US Dollar among investors, if CPI data is strong and positive, investor's might look forward to selling the USD in fear of rate hikes.
✊🏻 Good luck with your trades! ✊🏻
If you like the idea hit the 👍🏻 button, follow me for more ideas.

NASDAQThinking the NDX has been leading the dump and the DJIA & SP500 will dump harder % wise while NDX starts to lead the recovery IMO

btcusdtBitcoin has officially break the zone that was varrying in for the past days and reading to go up. This zone between 58500 and 59200 is due to a fib retracement from the down trend before. I am looking for an entry after it retraces back to the zone.

About to hit the $ 733? Watch these signs.Hi Tradingview community! Per our last analysis, we identified the strong divergence on price x RSI, and Tesla is about to confirm our bullish thesis.
We have an inverted head and shoulders in the H chart. If TSLA break the 683.45 it'll most likely reach our target (gap at 733). Tesla is looking good, my dears! Let's watch the 683!
If you liked this trading idea, remember to click on the “Follow” button to get more trading ideas like this, and if you agree with me, click on the “Agree” button 😉.
See you soon,
Melissa.

Apollo Hospital | Inverted head and shoulder w/ flag patternThis stock closely followed the inverted head and should pattern and broke the neckline. The price target today was nearly short of 40 points if compared w/ neck to head distance which is still good. The stock also touched it's near high today.
It will be interesting to see where does stock head this. I am of the opinion that this will show a short term bearish trend till the nearest support.

HINDUNILVER -Could be good breakout tradeHindunilever
Price structure and price action both look good on hourly, daily, and weekly timeframe.
Any breakout above the trendline could bring fresh buying in the stock and may take prices towards 2480 - 2500 levels.

NAZARA 45minLong in NAZARA after giving head and shoulders pattern breakout with trendline breakout.
can buy when closing above 1630 after trendline break
target 1798 the closing above 1800 it can give target of 1898
sl 1572
retest is still pending.
Also can take long in this as gaming industry is the biggest. more than compared to music and flim industry combined.

DOGECOIN 15MInDOGECOIN is making a inverted head and shoulder pattern and both support and resistance trendlines marked in purple lines.
Can buy at green and sell at red lines. Only after closing of 5MIN candle in the zone.

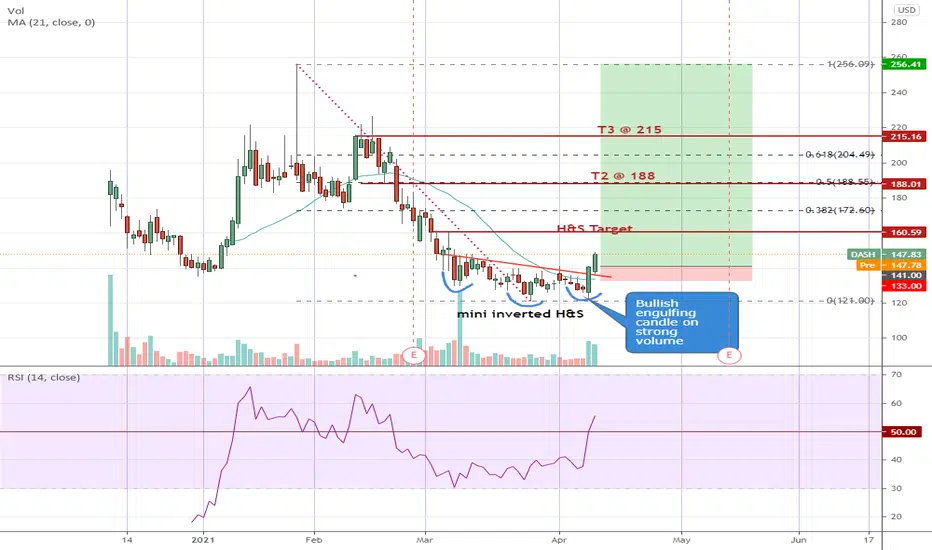
DASH - powerful price actionDASH bottomed out with a mini inverted Head & Shoulders before breaking above the neckline @ 136 with a strong bullish engulfing candle last Friday. More upside potential especially now with RSI clearing above 50.
Ideally one should have entered yesterday at the open @ 138 or as soon as it started to go above Fri's high @ 141. Otherwise, accumulate on any near term weakness with a tight initial stop loss below yesterday's candle ~ 133. Target shown are suggested only. Or ride the trade with trailing stops.
Disclaimer: This is just my own analysis and opinion for discussion and is not a trade advice. Kindly do your own due diligence and trade according to your own risk tolerance. Thank you. Feel free to give me your thoughts ! :)
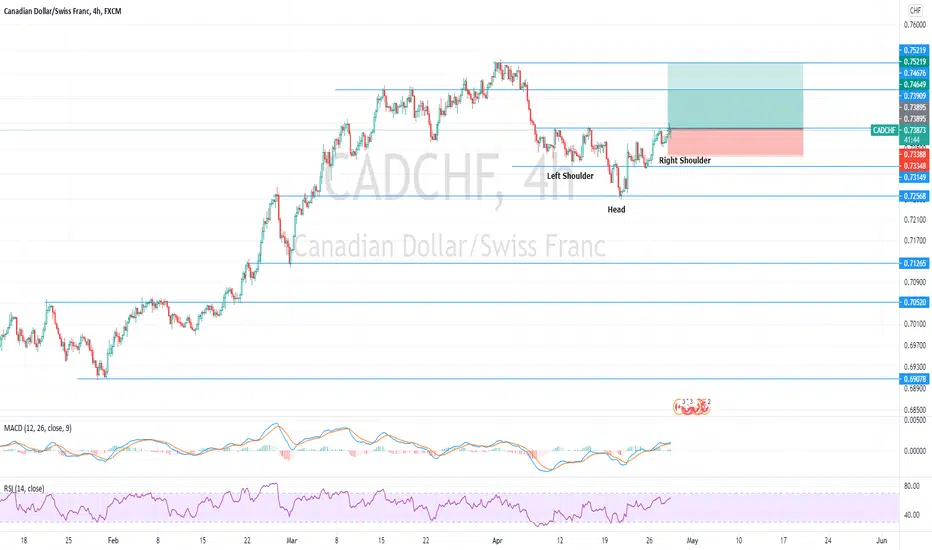
$CADCHF - Inverted head and shouldersHello everyone!
Inverted head and shoulders spotted on CADCHF.
Going to long with SL just below $0.73400, best entry point is at $0.7400
XRP day trading setup FYI - i'm NOT a day trader I just chart for fun and to kill time while I hodl.
Possible day trading setup for anyone looking for a decent 50% return on investment.
Just playing with the charts - killing time while we see sideways action and await the fake SEC case in the next 24 hours
Let me know what you think

XRP potential Head & Shoulders forming?With ETH hitting new ATH and taking more of the total market cap. XRP will continue to move sideways between $1.35-$1.42 before its next leg up. If this plays out should take a few more days to confirm and steal back some of the $ from BTC & ETH.
Anyone else think this might play out? Finish April off where we are currently at before having a super MAY 2021!

Inverted H&S. Bullish. $440 Bull Run before earnings?Greetings All,
ROKU formed an Inverse H&S pattern, which I interpret as bullish. Great price entry at $360, which is between 20/50 MA. Target the $440 gap.
Happy Trading!

UH GUYS !?! HELLO VERGE FANS ?!? .06 INCOMINGif this upward sloping IHS plays out then the text book calls for .06
just sayin
NFA

$OBLN PT 14Obalon Therapeutics, Inc., a vertically integrated medical device company, focuses on developing and commercializing medical devices to treat people with obesity. The company offers the Obalon Balloon System designed to provide weight loss in patients with obesity. Its Obalon Balloon System comprises of a swallowable capsule that contains an inflatable balloon attached to a microcatheter; the Obalon Navigation System console, which is a combination of hardware and software used to track and display the location of the balloon during placement; the Obalon Touch Inflation Dispenser, which is a semi-automated, hand-held inflation device used to inflate the balloon once it is placed; and a disposable canister filled with mixture of gas. Obalon Therapeutics, Inc. was incorporated in 2008 and is headquartered in Carlsbad, California.

inverted Head&Shoulder on BTCI wasn't sure some hours ago when I identified so I waited a bit, now I'm sure. I've indicated the target by rules but who knows....
According with the target it should hit 59.5K which makes sense since it's just under an important resistance. If you wanna long this one I think this is a nice entry. Just be aware very often there's a retest of the neckline of the H&S.

EURUSD LONG IDEAAccording to my analysis, Eurusd might continue with the upward movement. We see bullish pennants being formed and also an inverted head and shoulder pattern which signify continuation with the bullish momentum. Happy trading guys.

COMP Inverse H&S BreakoutCompound looks to be another alt that is experiencing a neckline breakout from an inverse head and shoulders pattern.
It looks like a slight retracement is now occurring which has the potential to break down below the neckline still, however, assuming the trend continues, it has a bit of potential upward as indicated by the head to neckline length extended after the breakout (dashed blue line).
There is a similar breakout occurring against COMPBTC, so it looks like there is some potential to outpace BTC over the next few days as well if the breakout continues. I suppose we shall see soon if the breakout becomes more definitive in the next day(s) or so.

PDD: You should be aware of this chart pattern!Hello traders and investors! Let’s talk about PDD today! It is the first time I analyze this stock, and I hope my insights can be helpful. In this analysis, I'll present you two strategies to follow.
First, in the 1h chart, we have a Descending Triangle chart pattern, and the trend is clearly bearish, as the 21 ema is pointing down, and the price can’t trade above it.
This makes the situation more favorable to the bears, at least in the short-term , and as long as we don’t see a clear breakout upwards from this Triangle, the bear trend will persist. This Triangle is the best chance PDD has to reverse this bearish sentiment.
Now, there’s two strategies we can use. First, if we see an upwards breakout, second, if we see a downwards breakout. Either way, this Triangle is the key, and the targets are better seen in the daily chart:
If PDD breaks this Triangle downwards, then it’ll just seek the next support level, and the most meaningful support is the red line at $ 121.28. Then we’ll see how to proceed. Maybe PDD will lose this line, or it could do a nice candlestick pattern and trigger a possible Double Bottom pattern – we can’t know for now.
On the other hand, if PDD does an upward breakout from the Triangle in the 1h chart, the next resistance is the target, which is at the green line ($ 152.06). This is also a pivot point , and the trigger of an Inverted H&S chart pattern , as evidenced by the green area. If triggered, this pattern will officially reverse the trend in the mid-term , and PDD would have a first target at $ 188 , and it could go even higher, above $ 200.
Since PDD is dropping with low volume , this makes me wonder if this bearish movement will have the strength to persist.
Either way, we must keep watching PDD closely, and if you liked this analysis, remember to follow me to keep updated with my daily studies, and please, support this idea with your like!
Thank you very much!
