ALGO over .5047From a purely technical perspective this is a very bullish chart. Inverted head and shoulders looks like it wants to retest at least recent highs, perhaps ATH.
Invertedheadandshoulders

Head and Shoulders Pattern EJ 1/03/21Price has created and inverted Head and Shoulders pattern. While doing so it price was launched upwards with two impulse moves. Waiting for a retracement of 50% to retest the neckline and if that happens a 4 hr bullish pattern may signify an entry!!!

Just some playful targetsI drew some lines and made some shapes that I've seen done before on the internet. Will be fun to come back in 2021 and late 2022, and see what happened.

inverted head and shoulder on tata powerits not perfect but as forming on horizontal boundary can consider it.
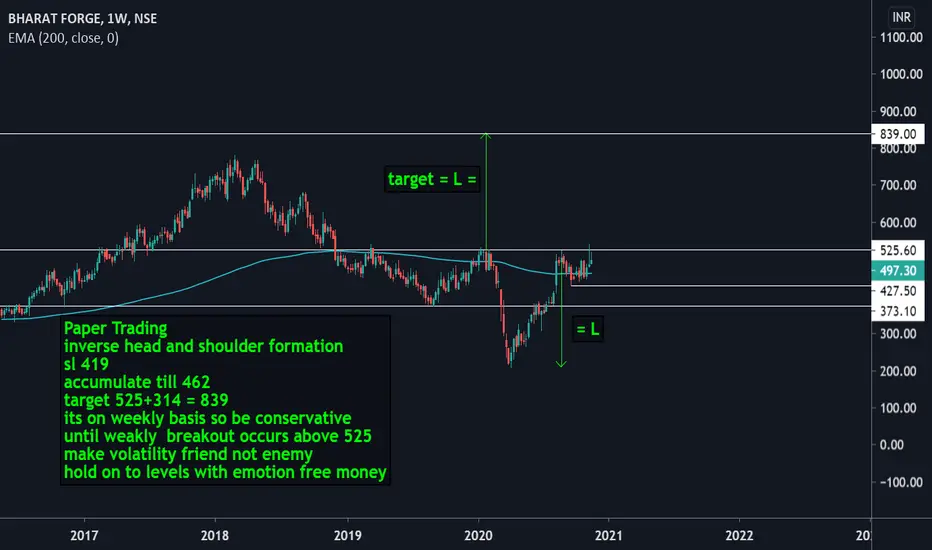
paper trading
as we miss accumulation we are conservative on position sizing
sl will be 49 on weekly closing i.e. if it break 49 on daily come out and close above 49 then re-entry as
we don't know how much fall will be there with volume so this way we are safe from high speed fall.
target is all time high. so be ready with patience as it will take long to hit.
becoz it took almost 1 year to form
be patient eventuallylong term wealth will be generated.
avoid news

inverted head and shoulder anticipationbreakout above 525 on weekly basis
sl 416
target 839
accumulate till 462
be conservative its anticipation till breakout occurs
on weekly basis
make volatility friend
SEDG over 294.00Whether or not we get a rotation back into solar, this chart looks set up for a breakout over this level. Looking at this on the hourly, there was a larger move that was given back that you can also see on the daily upper shadow. As this has found support at the fib, I think this hints at future movement.

$XAGUSD - Inverted H&S and important breakoutHi guys! 👋🏻
🔔 Silver confirmed an important brekout from the descending channel.
🔔 A pattern to watch here is - Inverted Head and Shoulders
🔔 Biden will push the stimulus bill as Covid cases in the US hit new record highs. It's time for gold and silver to shine again.
🔔 Currently, silver is testing the neckline, might retrace a bit and later continue the uptrend.
✊🏻 Good luck with your trades! ✊🏻
If you like the idea hit the 👍🏻 button, follow me for more ideas.

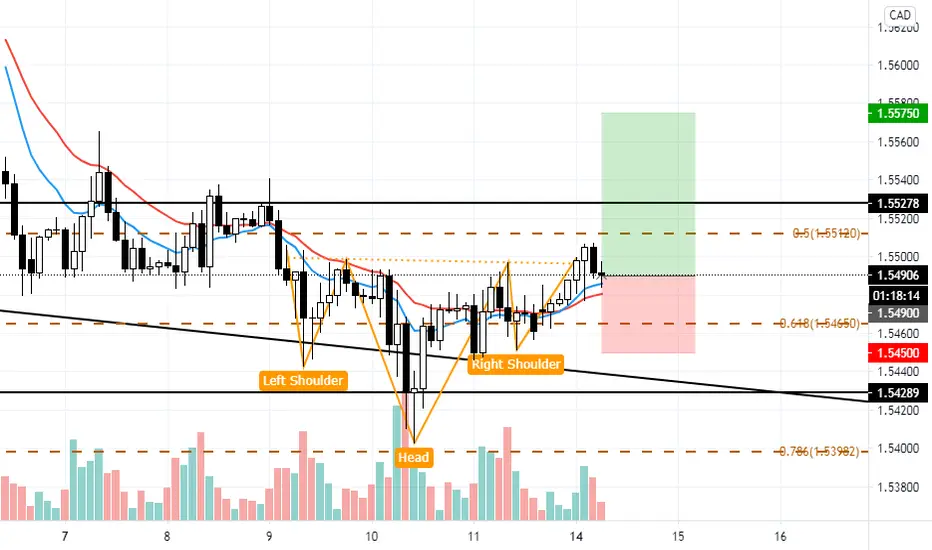
EURCAD, 2hr tf, inverted HnS pattern to materializedHello my friends,
For today i saw an inverted HnS pattern on EURCAD pair.
This pattern occurs on 2hr tf so it might be a bit small in range but worth to try.
We will keep it simple with only price action, you can see price broken above the neckline with a solid candle close above.
The candle looks like a bullish pinbar so i think this is a confirmation candle as well.
Buy EURCAD 1.5490
Stop loss 1.5450
Take profit 1.5570 (2R)
RR Ratio 1 : 2
Use only 1-2% risk
Good luck
ELY Inverted Head and ShoulderBullish on ELY after buying Topgolf. If we can clear the all time high around $25 I think this could take off to minimum $40. Currently around 2B market cap with significant revenue growth the past 3 years up to 1.7B in 2019. Also, MACD bullish crossover on monthly chart and quarterly chart.

SANDBTC is creating an inverse head and shoulder 🦐SANDBTC is creating an inverse head and shoulder on the bottom. If the price will have a breakout from the neckline and retest it as new support, According to Plancton's strategy (check our Academy), we can set a nice order
–––––
Follow the Shrimp 🦐
Keep in mind.
🟣 Purple structure -> Monthly structure.
🔴 Red structure -> Weekly structure.
🔵 Blue structure -> Daily structure.
🟡 Yellow structure -> 4h structure.
⚫️ Black structure -> <4h structure.
Here is the Plancton0618 technical analysis, please comment below if you have any question.
The ENTRY in the market will be taken only if the condition of the Plancton0618 strategy will trigger.

inverted head and shoulders in sunpharmainverted head and shoulders spotted in sun pharma
pharma sector is showing positive signs nowadays
so this is a good buying opportunity
go long above ~518-219 target is easy 1% that is around 526
swing traders can take risk and go for a much bigger target
intraday people enter wisely

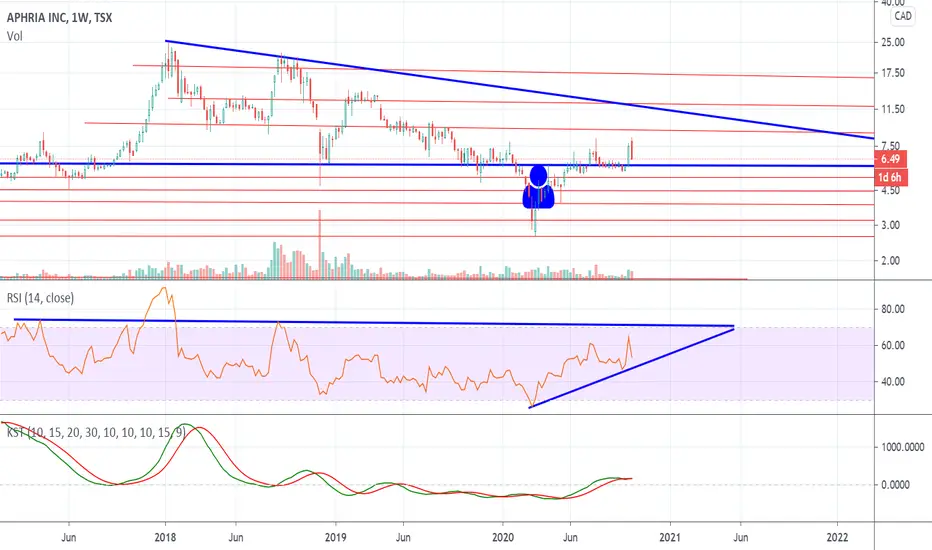
Giant bullish flag or Descending Triangle for APHA.APHA is trading back into a Macro Bullish Flag or Descending Triangle drawn in dark blue, we have seen a fake-out to the downside where I have the blue human body icon, this is potentially forming an inverted H&S, and at the same time APHA is trading back into the Macro pattern, which started becoming bearish Jan 2018 during the hype before Canadian Rec.
The KST wants to crossover bullishly, but is being rejected for the time being, you need to zoom in close to get a better view.
Potential merit for a Ascending Triangle on the RSI.
Long - GODREJCP with Inverted Head and ShoulderHi Investors,
GODREJCP is one of the strongest FMCG stocks. And on top of that, it is giving a strong Inverted head and shoulder pattern. Risk to reward is 3 and price has potential to break above 970.
LONG
========
BUY at current price (718-720)
STRICT STOP LOSS = 647
Short term Target = 970
Long term Target = 1200-1300
I hope you will benefit from this knowledge
-MetaVish
PS: Twitter handler = MetaVish.

Long - MARICO - Inverted Head and ShoulderHi Fellows,
Marico is making a strong Inverted head and shoulder in a Weekly time frame. It has tested 400 level many times in last 12 months.
Above 400 it could be a good run.
I hope you will benefit from this knowledge
-MetaVish
PS: Twitter handler = MetaVish.

Ascending Triangle for Bitcoin?Notice the giant Inverted H&S?
I have placed the blue human icon to represent the head of the inverse head & shoulders pattern, and the two light green lines on either side are the shoulders.
On the RSI & KST, I don't see anything too noteworthy for either a bullish or bearish scenario, a few more trading days should give a more precise narrative of which way BTC is heading.

Buying Price just hit a strong support area so we are looking for buying opportunities. Mind the price might create a W formation so don't panic when you see it coming back down shortly after starting to rise.

Long - BHARATFORG (Inverted Head and Shoulder)Hello Mitro,
BHARATFORG one of the Derivative stocks is making a very attractive price pattern (Inverted Head and Shoulder)
Check out the chart and your fingures will fill tickles to take a trade. But wait for it to break 530 level
LONG
========
BUY Above 530
STOP LOSS = 425
TARGET = 785


Long - Piramal Enterprice (PEL) Inverted Head and ShoulderHello Aliens,
Piramal Enterprise is making a beautiful price structure with potential bullish trend. Breaking above 1480 could give a safe and confirm entry to go long side.
Possible holding period is 1-3 months at least.
I hope you will benefit from this knowledge.
-MetaVish

Tatapower with a Bullish Chart - Inverted Head and ShoulderHi Friends,
TATAPOWER is making a nice Inverted Head and Shoulder in a Weekly Time Frame. And also, it looks like a Cup and Handle.
It is good to go long once it breaks the Rs .64 level and possible upside till 94-100. I hope you benefit from the chart published here.
- MetaVish
NSE:TATAPOWER

ADVTECH - LONG Idea- Price looks to have made a solid bottom to work off #invertedhead&shoulders
- Support of 200ma has been confirmed
- Volume indicates accumulation
- 1st Target is around R12
-- MANAGE YOUR RISK - -
Disclaimer: All ideas are my opinion and should not be taken as financial advice.

$XPDUSD - Palladium trade setupHello everyone!
Two scenarios I'm tracking for Palladium.
The first is the confirmation of the Inverted head and shoulders and bullish from current level, the second is a confirmation of a bearish flag and a bounce back from the dynamic support.

ATOM.USDT(Y20.P5.E1).Macro.TargetsHi,
If we get a break here, we have the 2nd target as part of the inverse H&S.
Note: First Target reached which could be a double top so wait for the breakout.
Cheers,
S.SAri
Looking for the 3rd touch for the breakthrough.
