Ascending Triangle & Triple Bottom for CRSP?Notice the dark blue pattern on the chart, there's noticeably a Ascending Triangle and coincidentally a bullish inverted H&S where I have placed the green lines.
Above each green line is appears to be a bottom, and there's three very noticeable on the line chart as opposed to the hollow candle chart. I have placed three blue finger icons so there is no confusion, each finger represents a bottom of the Triple Bottom.
On the RSI there's was clearly a modest divergence, if the Ascending Triangle breakout to the upside the RSI is going to need to create a higher high and break out of the pattern to the upside negating the possibility of this ending in a bearish divergence & descending triangle.
Invertedheadandshoulders

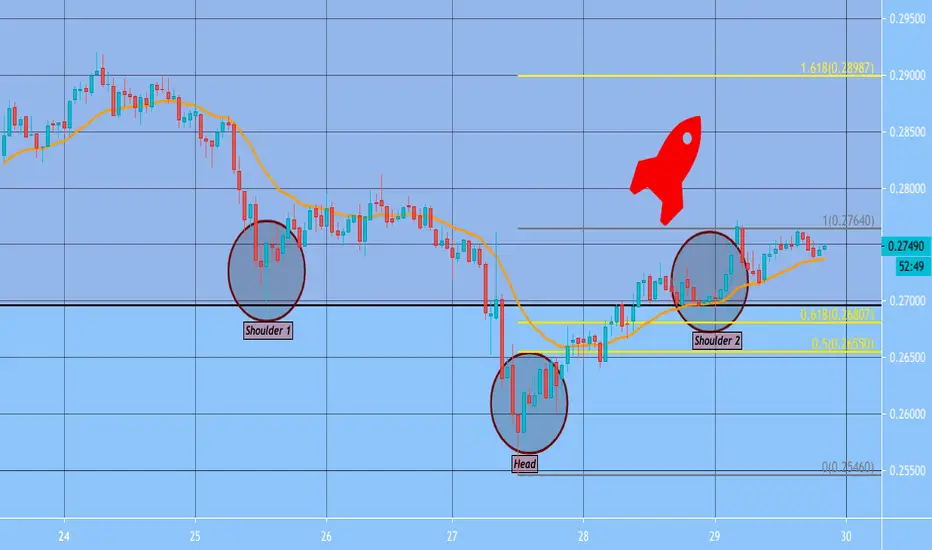
XRP IS Gaining BULLS MOMENTUM!!Good Evening Traders! XRP has possibly pre-established bullish dominance. I've identified a Inverted Head & Shoulders pattern on the 1HR Time-Frame. Looking for a smooth confirmation over the 100% Fibonacci. Price is currently sitting inside the zone of Daily Market Structure after a failed retest of the lower boundary. Expecting first upward shift to move towards $0.28.
Like this post if you agree.
Comment Your thoughts Below!
ELFBTC nice weekly breakout and retest 🦐ELFBTC had a nice weekly breakout and retest the previous resistance.
The price created an inverse head and shoulder and the price is testing its neckline.
In this case we share our VIP SIGNAL
LONG TERM
–––––
Follow the Shrimp 🦐
Keep in mind.
🟣 Purple structure -> Monthly structure.
🔴 Red structure -> Weekly structure.
🔵 Blue structure -> Daily structure.
🟡 Yellow structure -> 4h structure.
Here is the Plancton0618 technical analysis, please comment below if you have any question.
The ENTRY in the market will be taken only if the condition of Plancton0618 strategy will trigger.

Coal India - HnSCoal india is forming inverted head and shoulders on daily chart, RSI trenline is also giving support. Enter only after neckline breakout for the given target. Targets on chart...

AUDUSD (LONG) Inverted Head & Shoulder Price has formed an inverted head & shoulder
pattern which is a bullish pattern.
Entry point would be either at the trend line
or the break of the neckline!


Head & Shoulders PatternInverted Head & Shoulders setup in-process first structure point to break through is 0.71900 and it should be a steady ride up to 0.72400

BVT (1H) - ShortInverted H&S on the hourly signals a long trade if it closes above R142. Full target is R154. Stop loss is a close below R138, then trend continues downwards.

EURCAD long trade ideaPlan: resistance level breakout --> wait for the price to bounce off from support level --> wait for the rejection candle pattern to form e.g. bullish engulfing, pinbar, etc --> BUY
**Disclaimer** the content on this analysis is subject to change at any time without notice, and is provided for the sole purpose of assisting traders to make independent investment decisions.
Traders!! if you like my ideas and do take the same trade as I do, please write it in a comment so we can manage the trade together.
_____________________________________________________________________________________________________________________
Thank you for your support ;)
GWBFX

BTC forming an Inverted Head and Shoulder or Broadening wedgeBullish: I'm seeing a potential Inverted Head and Shoulders pattern with a target between 12400-12550 (depends on where it breaks if it breaks)
Bearish: There is also a descending broadening wedge which could playout with a target between 11300-11500 (depends on where it breaks if it breaks)
You should definitely wait for a breakout before taking these trades!
Bitcoin Trading Club is created to share valuable trading ideas, charts and to support each other with our trades (Not Financial Advice).

USDCAD, 4hr timeframe, inverted shoulders head patternHello my friend,
Today i spotted a nice buy setup on USDCAD pair. There is a bullish divergence on daily timframe and a nice inside bar pattern so i am looking into 4hr timeframe to time my entry.
Surprisingly, there is an inverted shoulders head pattern forming and i think we are going to see price broken above the neckline soon.
Buy USDCAD 1.3420-30
Stop loss 1.3360
Take profit 1 @1.3480
Take profit 2 @1.3540
Good Luck
Disclaimer: I am opening buy position since 1.3420

XRP IS HEADING BACK UP!!I see a possible Inverted Head & Shoulders pattern forming. Price would have to move upwards to 32 cents zone in order for a Bullish confirmation to be completed. Expecting bullish movements to profit level indicated on the chart. Do you predict Bullish or Bearish action? POST YOUR COMMENTS BELOW

What’s Next For XRP?? Price is now at a key level, I’ve noticed every time price reached this level it broke through and kept going. Price could also fake out and go down ; this is just an idea, but if price breaks through this line be looking for a long order. Also as you guys can see I marked up what appears to be an inverted head and shoulder which also gives me the notion that price is going to keep rising. I’ll be keeping you guys updated on what I do next with this pair, what are your thoughts? Leave them in the comment!

HBAR / USD - Inverse Head and Shoulders Pattern on DailyWe're breaking out of an inverted head and shoulders pattern printed on the daily chart, beware BTC

IOTAUSDT nice weekly breakout 🦐IOTAUSDT nice weekly breakout (left chart) and now the price is creating an inverted head and shoulder on 4h timeframe (right chart).
IF the price will break the dynamic trendline on 4h chart, According to Plancton's strategy, we can set a nice order
–––––
Follow the Shrimp 🦐
Here is the Plancton0618 technical analysis, please comment below if you have any question.
The ENTRY in the market will be taken only if the condition of Plancton0618 strategy will trigger.

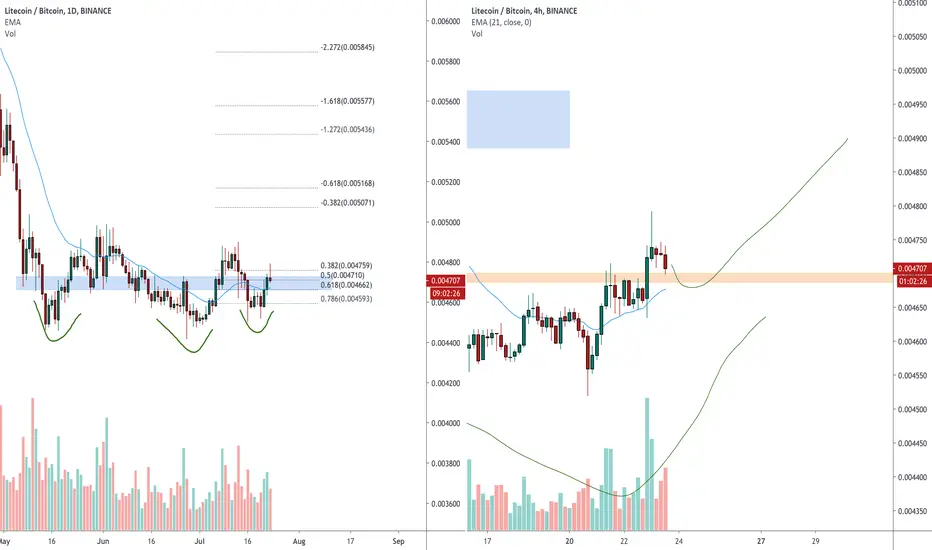
LTCBTC creates inverted head and shoulder 🦐LTCBTC creates inverted head and shoulder in 1d (left chart),
Nice breakout on 4h chart and we are looking for a nice Long entry According to Plancton's strategy
–––––
Follow the Shrimp 🦐
Here is the Plancton0618 technical analysis, please comment below if you have any question.
The ENTRY in the market will be taken only if the condition of Plancton0618 strategy will trigger.
Head & Shoulders nearing completion? - Target 10,400, then 14KBelow is a link to my previous analysis identifying the head and shoulders pattern with the neckline at 10,400.
It looks like we may have the shortened low of the right shoulder behind us. A lot of pressure from the bulls to get back to the neckline at 10,400. There are several stops ahead before we get there with 9800 and 10000 being the 2 big ones. But it's a positive note for the bulls, that the large red trendline that started from the ATH in December 2017 has held as support, limiting the drop of the right shoulder.
I expect to see upward trend over the next few days as we get to the neckline, and then we will see who wins that battle!


Is TNY trading in a Macro Ascending Triangle?TNY appears to be holding on to the green upward sloping support in this chart, the support is interestingly forming a giant Ascending Triangle.
Potentially merit for a Inverted Head & Shoulders, only time will tell.
Tinley has multiple upcoming operational updates that can influence these patterns to play out bullishly to the upside in a parabolic manner.
1. Canadian expansion of Cannabis-infused beverages & Beckett's.
It appears as though Canadian expansion for the cannabis-infused beverages has been held off until Tinley received their Long Beach License because Tinley expects to provide reciprocal co-packing referral services with a Canadian co-packing partner.
Updates on expansion to Canada are expected in August.
2. Some of Tinley's Co-packing clients will be announced in the near term because Tinley's Long Beach Facility received official licensing recently.
The company is now in a position to consummate agreements in its pipeline of prospective co-packing clients, apparently there are five, and the CEO has mentioned some of the deals will put Tinley on the Map. Mentioned in one interview is a National Brewery, a well known Winery, and some well known Cannabis brands & mainstream beverage brands.
3. Beckett's shelf placement regarding approximately 6500 locations of interest, commitments from 4 chains for August, at least 1 is rumored to be Costco.
4. Working to finalize initiatives with prominent figures in sports and
entertainment for marketing of Tinley products and co-packing clients’
products.
5. Expansion to Nevada.
Tinley has several bullish milestones that if completed in a timely manner can have a serious impact on the share price to the upside, and on the contrary if delayed, the outcome would be vice versa & a retest of 20c CAD seems plausible.

$TWTR #InvertedH&S #HeadandshoulderThought it was useful to bring attention to the inverted H&S on TWTR

long OZLstarted to look at stocks in ASX long term so dont have to be actively watching market all the time.
currently long on this stock cause float price has been broken and yearly Pivot point mean has been broken. also looks like a inverted HnS so holding to the red line.
the inverted scale option on TV is handy to see the head and shoulders with a wick test of the shoulder.

AGIBTC is creating Inverted head and shoulders 🦐AGIBTC is creating Inverted head and shoulders below a daily resistance.
According to Plancton's strategy, we can set a nice order
–––––
Follow the Shrimp 🦐
Here is the Plancton0618 technical analysis, please comment below if you have any question.
The ENTRY in the market will be taken only if the condition of Plancton0618 strategy will trigger.

gbpusd long ideaPrice rejected the daily structre yesterday. After the rejection it impulsed upwards. Looking like inv head and shoulders. Right shoulder might be between 0.5-0.618 fibonacci taken from the low to the high of the previous impulse. The position showing in here is symbolic. Just expecting this direction if i see a higher timeframe wicks. React after the wicks.
