Coty - finally, some progressDid not fully work as planned on first recommendation, as price continued to consolidate in what appears as major bullish flag. But today on earnings release, we finally got strong follow through.
Still needs to clear resistances ahead, but overall looks promising as a major turnaround play this year.
Invertedheadandshoulders

CADJPY buy on H1Note : CADJPY forming a potential inverted H&S after price bounce off from daily support level (link attached below!) now we are waiting for further price development (structure breakout) before placing any buy order
Plan : trendline / horizontal resistance breakout --> wait for price to bounce off from trendline / horizontal support --> wait for the rejection candle pattern to form e.g. bullish engulfing , pinbar etc --> BUY
**Disclaimer** the content on this analysis is subject to change at any time without notice, and is provided for the sole purpose of assisting traders to make independent investment decisions.
Traders!! if you like my ideas and do take the same trade like i do, please write it in comment so we can manage the trade together.
_____________________________________________________________________________________________________________________
Thank you for your support ;)
GWBFX

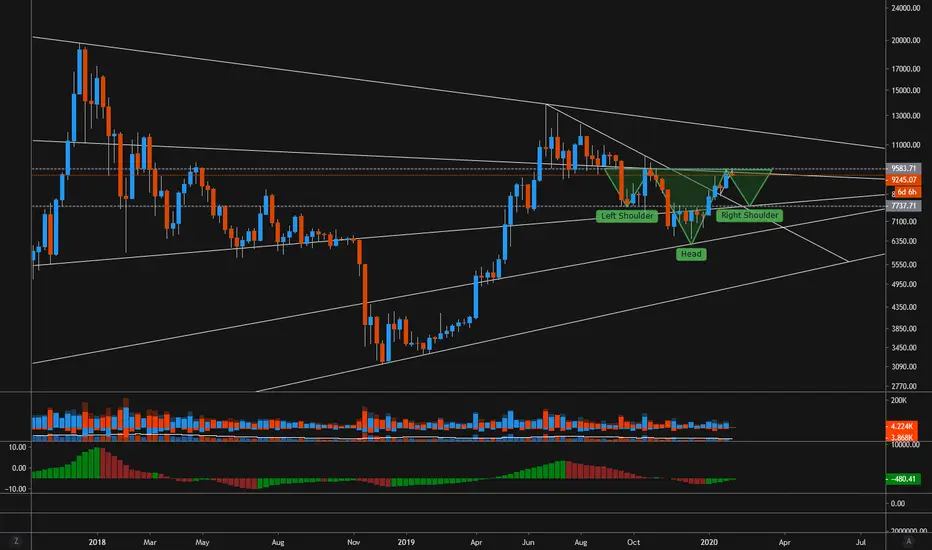
BTC - Possible Large Inverted Head and ShouldersLooking at the current reaction to price at the 9600 levels, and taking a step back to the weekly chart, it seems possible we could see a retrace back to the top of our downtrend some weeks in the future, as a more proper re-test of it than the one we see on shorter timeframes. ( ).
Going to keep this chart posted publicly to keep an eye on what happens next. We are in a very bullish movement, so no guarantees this is going to be the case, but let's watch and see.
USDJPY buy on H2, possible inverted H&S formation!Plan : trendline breakout --> wait for prices to bounce off horizontal / trendline support --> wait for the rejection candle pattern to form e.g. bullish engulfing , pinbar etc --> BUY
**Disclaimer** the content on this analysis is subject to change at any time without notice, and is provided for the sole purpose of assisting traders to make independent investment decisions.
Traders!! if you like my ideas and do take the same trade like i do, please write it in comment so we can manage the trade together.
_____________________________________________________________________________________________________________________
Thank you for your support ;)
GWBFX

USDCHF, Inverted HeadUSDCHF, is in line with bullish action provided on DXY. Yellow Zone is the strike area for the Right shoulder of the Inverted Head. Green Zone (bottom) 61.8% on the longer term move, and possible area of support for bullish push. Green Zone(Top/TP) will be our projected take profit.
**Ignore the EURUSD Chart on the Right** Forgot I was on split screen.**

CHFJPY long trade update on H1Plan : wait for price to bounce off horizontal support --> wait for the rejection candle pattern to form e.g. bullish engulfing , pinbar etc --> BUY
**Disclaimer** the content on this analysis is subject to change at any time without notice, and is provided for the sole purpose of assisting traders to make independent investment decisions.
Traders!! if you like my ideas and do take the same trade like i do, please write it in comment so we can manage the trade together.
_____________________________________________________________________________________________________________________
Thank you for your support ;)
GWBFX

USDCHF, price has formed inverted H&S pattern!Plan : wait for the rejection / entry candle pattern to form e.g. bullish engulfing , pinbar, inside bar etc --> BUY
**Disclaimer** the content on this analysis is subject to change at any time without notice, and is provided for the sole purpose of assisting traders to make independent investment decisions.
Traders!! if you like my ideas and do take the same trade like i do, please write it in comment so we can manage the trade together.
_____________________________________________________________________________________________________________________
Thank you for your support ;)
GWBFX

BTCUSD is on decision key level!Note : I will tend to wait for further signals, this will be very interesting ;)
**Disclaimer** the content on this analysis is subject to change at any time without notice, and is provided for the sole purpose of assisting traders to make independent investment decisions.
Traders!! if you like my ideas and do take the same trade like i do, please write it in comment so we can manage the trade together.
_____________________________________________________________________________________________________________________
Thank you for your support ;)
GWBFX

EURGBP Inverted Head and ShouldersPrice completing inverted head and shoulders pattern.
RSI shown bullish divergent as well.
if break break neckline, find pullback or correction before take some buy

NZDJPY buy on H1, potential inverted H&S formation!Plan : wait for prices to bounce off horizontal support --> wait for the rejection candle pattern to form e.g. bullish engulfing , pinbar etc --> BUY
**Disclaimer** the content on this analysis is subject to change at any time without notice, and is provided for the sole purpose of assisting traders to make independent investment decisions.
Traders!! if you like my ideas and do take the same trade like i do, please write it in comment so we can manage the trade together.
_____________________________________________________________________________________________________________________
Thank you for your support ;)
GWBFX

USOIL long trade update on H2Note : In the previous analysis the setup went according to plan (link below!), this update is for those of you who want to re-entry, good luck ;)
Plan : wait for the rejection / entry signal candle pattern to form e.g. bullish engulfing , pinbar etc --> BUY
**Disclaimer** the content on this analysis is subject to change at any time without notice, and is provided for the sole purpose of assisting traders to make independent investment decisions.
Traders!! if you like my ideas and do take the same trade like i do, please write it in comment so we can manage the trade together.
_____________________________________________________________________________________________________________________
Thank you for your support ;)
GWBFX

Elliott Wave - EURUSD - Get ready for wave 5 - BUYGood morning traders,
The EURUSD appears to be forming the c leg of wave 4.
Once this wave has completed we are looking to go long on wave 5.
Wave 5 will also have 5 sub waves providing opportunity to enter further positions on pull backs.
Wave 5 will need to reach at least the peak of wave 3, meaning 1.1240 can provide an initial target.
1.1020 will also provide a great entry as this will be a long term inverted head and shoulders pattern.
Any thoughts on the set up are welcome!

TataMoters on weekly time Frame work
Security/Script: TataMotors .Equity (NSE India)
Pattern Formation: Inverted Head and Shoulder
Time Frame: Analysis on Weekly time frame
Range of estimation: 240
Pattern confirmation: Neckline breakout
Entry Level: Neckline
Strategy: BUY on dips Near neckline level
Risk: Right shoulder of pattern 160 (-20 Points)
Rewards: 220 (+35 Points)

BTC inverted head and shoulder not yet confimed$BTC BITSTAMP:BTCUSD is probably making a inverted head and shoulder. Not yet confirmed. Needs to break 7800 with volume to be sure that this is a confirmed IHS.

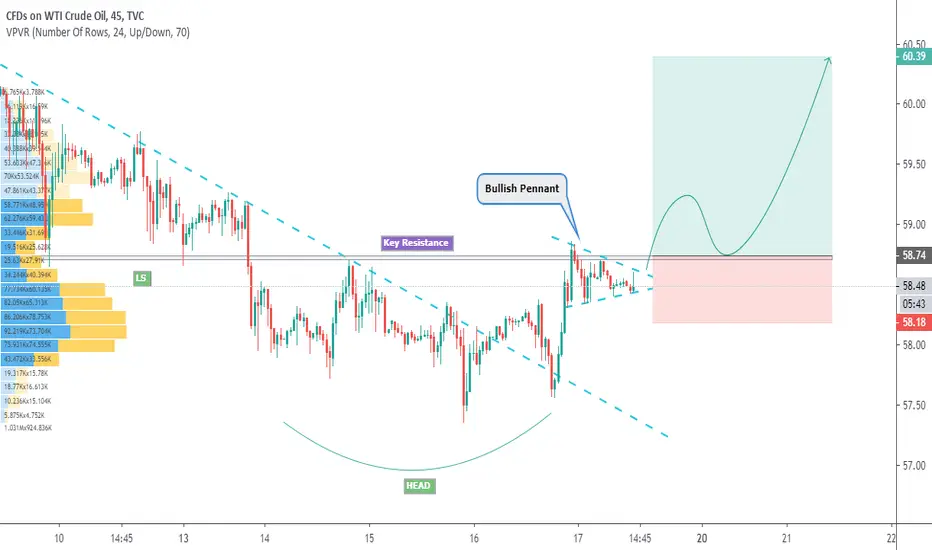
USOIL, a complex inverted H&S patterns began to appear!Plan : wait for pennant / key resistance breakout --> wait for prices to bounce off key support --> wait for the rejection candle pattern to form e.g. bullish engulfing , pinbar etc --> BUY
**Disclaimer** the content on this analysis is subject to change at any time without notice, and is provided for the sole purpose of assisting traders to make independent investment decisions.
Traders!! if you like my ideas and do take the same trade like i do, please write it in comment so we can manage the trade together.
_____________________________________________________________________________________________________________________
Thank you for your support ;)
GWBFX
{SWC}---I-BHD engine start now?Thanks for following us!
Strategy: Inverted Head and Shoulder spotted
Bias: Bullish . Significant volume kicked in today and breakout the box consolidation zone at the price of 0.250, which is also the previous high since Novemeber 2019. This is the 2nd long green bar after the price hit its bottom at 0.210. If the momentum continue, the price shall break its immediate resistance 0.265 and challenge next resistance at 0.285 soon.
If we see from the chart pattern, a small inverted head and shoulder pattern was spotted. Hence, the price shall be in positive movement in the near term if momentum sustained.
R: 0.265, 0.285
S: 0.250, 0.255
If you find this idea helpful, do not hesitate to drop us a like and comment! Happy trading! :)

Coty - turnaround ahead?For a very long period of time NYSE:COTY was a troubled company with deteriorating fundamentals.
However, right now, it is trying to transform itself and improve both financials and position in the market. Top management really believes in turnaround, insiders purchased around $100 million in stock last year!!!
And now it looks like stock might be finally ready to go much higher also from technical perspective. Large inverted H&S in the making, and strong breakout of bullish flag yesterday. Volume also supports higher prices ahead, (you can see that on up days it is much higher compared to down days).
So low risk entry at current prices with stop just below recent lows might yield very good investment returns. I am buying.

NZDCAD trade idea on H1Plan : wait for prices to bounce off horizontal support --> wait for the rejection candle pattern to form e.g. bullish engulfing , pinbar etc --> BUY
**Disclaimer** the content on this analysis is subject to change at any time without notice, and is provided for the sole purpose of assisting traders to make independent investment decisions.
Traders!! if you like my ideas and do take the same trade like i do, please write it in comment so we can manage the trade together.
_____________________________________________________________________________________________________________________
Thank you for your support ;)
GWBFX

USDJPY trade idea on H2Plan : wait for prices to bounce off horizontal support --> wait for the rejection candle pattern to form e.g. bullish engulfing , pinbar etc --> BUY
**Disclaimer** the content on this analysis is subject to change at any time without notice, and is provided for the sole purpose of assisting traders to make independent investment decisions.
Traders!! if you like my ideas and do take the same trade like i do, please write it in comment so we can manage the trade together.
_____________________________________________________________________________________________________________________
Thank you for your support ;)
GWBFX

Time to Buy Bitcoin - BTCUSDHi friends, I will keep this write-up short as the chart is self-explanatory.
Please carefully read the notes on all 4 time frame charts.
We have bullish reversal signals on multiple time frames for a long swing trade and potentially more to come in 2020.
I have been accumulating Bitcoin at every dip with anticipation that the low of 6,450 has been set for the mid-term.
That plan has remained the same since I have posted this idea on Nov 22, 2019:
Stops should be wide and placed below 6,200.

Rev H&S on BtcUsd?Inverted Head & Shoulders
Actually, yesterday's Bullish Engulfing was the second around the $7,000. Before Christmas, the Bitcoin price did also a pretty powerful climb upwards which end up with an Engulfing candlestick pattern on the Daily, it was a Head!? Yes head, we are pretty close to getting a confirmed Inverted H&S breakout. IHS is a bullish chart pattern which is confirmed after the breakout from the neckline. The current neckline is pulled from bodies on the 4H timeframe and if the 4H candle gets a close above $7,500 then this bullish chart pattern is valid and the further growth is supported with several bullish patterns.
Before the breakout from the IHS , I cannot do anything because of the neckline which is also a pretty strong short-, mid-term trendline and it has worked as a strong resistance. I'll wait for a 4H candle close above $7,500, hopefully, we get a nice and healthy throwback to get better entries to the train to $8,000. To be said, I don't hunt this run to the $8,000 because I don't like breakout as much as reversal ones but hopefully, I see something comfortable which allows me to jump to the wave.
There are some cons also for further growth. The current action is happening just below the 4H EMA200, it works as a resistance. So, we might see a little throwback, it may not be little because the overall long-term trend and pressure are still downwards.
We have a Death Cross between 100&200 EMA on the Daily timeframe , as you see the downward pressure is still there but the price should get a little bit more breath time after it breaks above the IHS neckline!
Do your own research and please, take a second and support my effort by hitting the "LIKE" button, it is my only FEE from You!
Regards,
TP

Bitcoin: Bullish Engulfing Candle Establishes New Long Setup.1. We focus on price action, levels and probabilities. News, drama, and other non order flow related information carries little weight in our decision making process. I have been explaining that the probability of this overall location favors bullish reversals which is why we did not exit our swing trade long in the face of bearish order flow (see 7275 to 5464 support zone).
2. I made this point in my previous article: "Can Bitcoin test lower prices? Anything can happen, BUT price would have to close below 6850 in order to prompt a retest of the 6550 reversal zone boundary. Any bullish reversal pattern in these areas would offer compelling swing trade and position trade opportunities based on the criteria of our strategies." Yesterday's bearish candle was NOISE and nothing more than a lure for short liquidity.
3. The bullish outside bar (engulfing candle) establishes a HIGHER LOW formation off of the 6900 level. This can be the very beginning of a broad Wave 3 IF 6450 is not compromised again. Higher lows often lead to higher highs.
4. Within the 7275 to 5464 support zone, there is now an inverted head and shoulders formation. This is a large magnitude reversal pattern that has developed within a location that favors BULLISH patterns.
5. In order to see momentum follow through, price needs to close above 8K. IF such an event unfolds, 8500 and the low 9Ks are likely to be tested with hours or days (with the help of all the small time frame short margin liquidations).
We are maintaining our swing trade long and patiently WAITING for price to reach our proportional targets (mid 7Ks, mid 8Ks and low 9Ks). We focus on price action as it relates to levels and probabilities, nothing else. I hope you found this update helpful for your own analytical process. My goal is to provide market context, perspective and an idea on how we manage our trades in this environment.

