GBPJPY long trade update on H2Note : from the previous setup I have secured +130 pips and doing 50% partial close (link below), my position is now safe with SL breakeven. Congrats to fellow traders who follow and here are the next plan updates ;)
Plan : wait for prices to bounce off horizontal / trendline support --> wait for the rejection candle pattern to form e.g. bullish engulfing , pinbar etc --> BUY
**Disclaimer** the content on this analysis is subject to change at any time without notice, and is provided for the sole purpose of assisting traders to make independent investment decisions.
Traders!! if you like my ideas and do take the same trade like i do, please write it in comment so we can manage the trade together.
_____________________________________________________________________________________________________________________
Thank you for your support ;)
GWBFX
Invertedheadandshoulders

Bullish On NZD USDChart is shared for study purpose.
It is forming IHNS near to longtime trendline so expecting Breakout.

Dow Jones Inverted head and shoulderThe dow jones is currently playing out an inverted head and shoulders on the monthly chart. This is unusual pattern as an inverted head and shoulders usually happens at the bottom of a down trend, not uptrend. But the pattern is in perfect shape. Direction is unclear at the moment.

GSM Inverted H&SEarly Inverted H&S can be seen forming, a left shoulder and a head can be observed. This theory is supported by both rising CVI and volume RSI. Risky trade.

EURGBP forecast update on H5Note : on the 13th of December I predict the inverted H&S pattern will form in the next few weeks (link below) and it really happens now, so what's next?
Plan : wait for prices to bounce off trendline support --> wait for the rejection candle pattern to form e.g. bullish engulfing , pinbar etc --> BUY
**Disclaimer** the content on this analysis is subject to change at any time without notice, and is provided for the sole purpose of assisting traders to make independent investment decisions.
Traders!! if you like my ideas and do take the same trade like i do, please write it in comment so we can manage the trade together.
_____________________________________________________________________________________________________________________
Thank you for your support ;)
GWBFX

GBPJPY buy on H2Plan : wait for the rejection candle pattern to form e.g. bullish engulfing , pinbar etc --> BUY
**Disclaimer** the content on this analysis is subject to change at any time without notice, and is provided for the sole purpose of assisting traders to make independent investment decisions.
Traders!! if you like my ideas and do take the same trade like i do, please write it in comment so we can manage the trade together.
_____________________________________________________________________________________________________________________
Thank you for your support ;)
GWBFX

SQ: Bulls ready to push through gap??To start, there have been many bearish indicators over the last few days trying to match 5Y charts, but these support levels have held very strongly, and we have now initiated bounce back up. With an intraday and larger scale inverted head and shoulders pattern, we could see a pop coming soon!
Matched with 1Y and smaller charts, SQ could be squeezed higher, and possibly push through gap back up to ~80 range. Anything below 62.5 will be easy short entry, but if it holds above, then still bullish going into holiday season. This stock is very bullishly manipulated—if you’re shorting, I’d advise on taking profits sooner, or when prices begins to consolidate. Bulls, are you ready to bounce this back up before 12/15 US/China Trade deadline? I’d recommend this, otherwise, you’ll be seeing some lows going into 2020, unlike many others looking to surge again like this year. The Ichimoku
clouds want to push this back up fast, so jump in if you believe and want some nice gains. Again, below 62.5 should mean short, so be cautious about this price point; otherwise, enjoy your extra holiday spending money!
All the best,
OGD

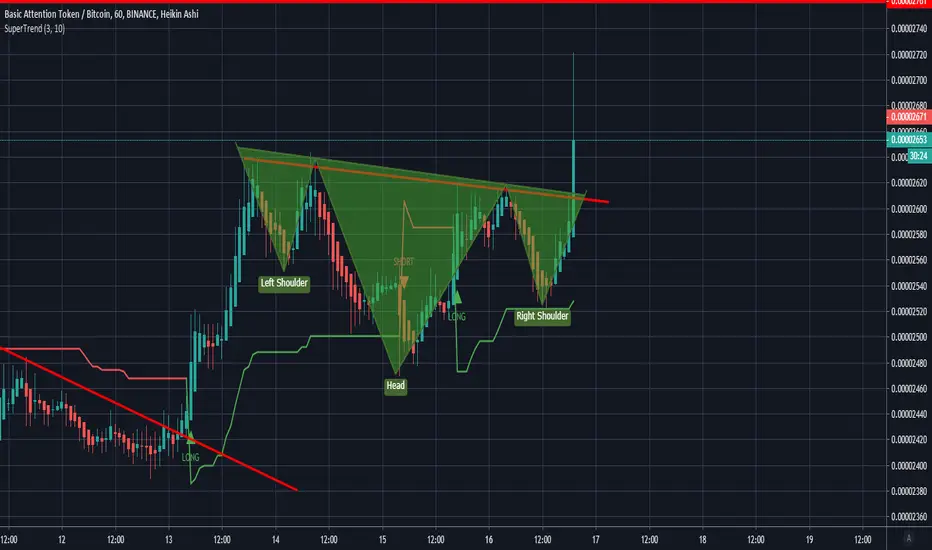
$Bat/BTC inverted head and shoulder breakoutBINANCE:BATBTC $BAT is forming a inverted head and shoulder pattern. It broke out. So i'm buying on retest. If you like my analysis smash the like button and follow me for more crypto TA.
NYSE Stock Picks: DRH Long NYSE:DRH
NYSE: DRH DiamondRock Hospitality
An inverted HnS neckline was broken on the 16th which will make price target the 11.75 then the 12.15.
Aggressively one can enter now but more conservative traders can look for a retracement back into the neckline but this might not occur if price continues to rally.

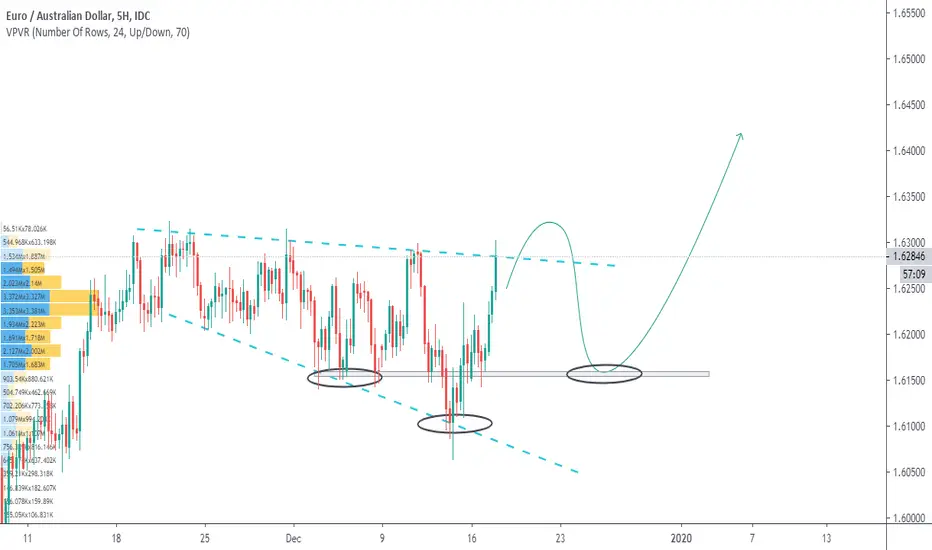
EURAUD forecast on H5, potential inverted H&S patternNote : i see the possibility of descending broadening wedge and inverted H&S pattern formation, we'll see ;)
**Disclaimer** the content on this analysis is subject to change at any time without notice, and is provided for the sole purpose of assisting traders to make independent investment decisions.
Traders!! if you like my ideas and do take the same trade like i do, please write it in comment so we can manage the trade together.
_____________________________________________________________________________________________________________________
Thank you for your support ;)
GWBFX
NYSE: SPOTIFY - Price tested the 200ma and has formed a IHS which should open a new leg up
- A break below 141.25 will target gap close below on the failed pattern trade
- MANAGE YOUR RISK -
Disclaimer: All ideas are my opinion and should not be taken as financial advice.
NYSE:SPOT

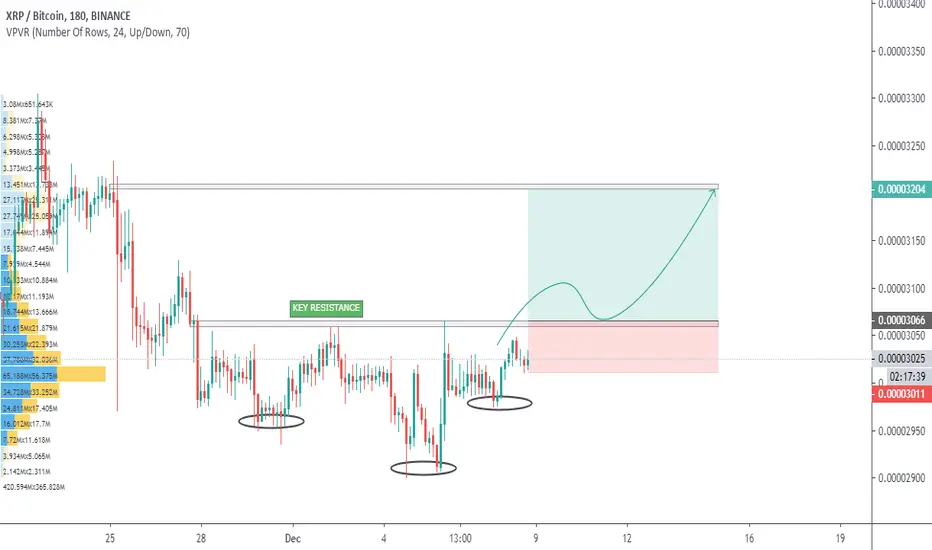
XRPBTC forecast on H3, possible inverted H&S formationNote : key resistance breakout --> wait for prices to bounce off key support (resistance become support) --> wait for the rejection candle pattern to form e.g. bullish engulfing , pinbar etc --> BUY
**Disclaimer** the content on this analysis is subject to change at any time without notice, and is provided for the sole purpose of assisting traders to make independent investment decisions.
Traders!!, if you like my ideas and do take the same trade like i do, please write it in comment so we can manage the trade together.
_____________________________________________________________________________________________________________________
Thank you for your support ;)
GWBFX
Weekly XRP Inverted Head and Shoulders with Long Term Trendline
On the weekly I discovered XRP creating an Inverted H&S with a long term trendline helping the right shoulder bounce to the neckline. If this works out then we can all take a deep breath, because this probably means xrp will be turned on to its long awaited meteoric bull run.

MA Bullish Cross and RSI Easter EggsAfter exhausting looks at near term analysis I decided to look at the BIG picture, and I found what seems to be undeniable to me. Keep in mind that the MAs don't lie, and the higher the time frame, the longer the impact of the crossing. So, when the MA50 crosses the MA100 (probably tomorrow) we can expect at least a short term (a few months at least) bull market based on the 50/100 MA cross. You don't have to believe me, just look at it's history on the weekly BTC chart.
As I wrote in my chart, the MA crossing happens to be at the same time the RSI Cup and Handle is supposed to impulse upward from the handle. Coincidence? I don't think so.

CADJPY Buy on H5, deceleration looks real (update for buyer !!)Note : as I mentioned earlier that CADJPY has the potential to form inverted H&S patterns, and that seems to have happened now --> buy at market around 81.750 - 81.850 (you can set SL & TP based on RR ratio above 1:2)
**Disclaimer** the content on this analysis is subject to change at any time without notice, and is provided for the sole purpose of assisting traders to make independent investment decisions.
Traders!! if you like my ideas and do take the same trade like i do, please write it in comment so we can manage the trade together.
_____________________________________________________________________________________________________________________
Thank you for your support ;)
GWBFX


#bitcoin #xbt - Pattern X or Dump ?Good morning traders,
let´s zoom into the Daily for today and have a look at our actual odds & outs here and some possible moves.
Fact 1: We have been in this downtrend-channel for an extended period of time, and a turn becomes more likely on every swing.
Fact 2: We have a strong support keylevel (blue), if we fall through this, good night. ( OR -> FACT 4)
Fact 3: As you know I don´t do forecasts, so I cannot tell you what exactly is going to happen.
Fact 4: We have a couple of possibilities on hand for "Pattern X". This can easily turn out as: W-Bottom, Adam & Eve, inverted Head & Shoulders and some more.
Fact 5: we don´t know IF and WHICH of these will play out. We need to see Bitcoin´s behaviour AT those levels (reactive trading). Trying to forecast this, can make you bleed.
Fact 6: We also have two possible Necklines: 1. Horizontal and 2. the channel middle line, which would be a crucial first good try if broken. (We have talked about this in the last post)
As usual I have marked in the chart for you what to watch out for + important levels.
Have a nice week guys!
Warm regards,
Neru

EURGBP Forecast on H5, potentially forming inverted H&S patternsNote : falling wedge pattern --> breakout --> wait for the price to bounce off the trendline support --> wait for the rejection candle pattern to form e.g. bullish engulfing, pinbar etc --> BUY
**Disclaimer** the content on this analysis is subject to change at any time without notice, and is provided for the sole purpose of assisting traders to make independent investment decisions.
Traders!! if you like my ideas and do take the same trade like i do, please write it in comment so we can manage the trade together.
_____________________________________________________________________________________________________________________
Thank you for your support ;)
GWBFX

EURUSD, Buy on H1Note : wait for the inverted H&S pattern to form --> wait for rejection candle to entry e.g. bullish engulfing, pinbar,. etc
**Disclaimer** the content on this analysis is subject to change at any time without notice, and is provided for the sole purpose of assisting traders to make independent investment decisions.
Traders!! if you like my ideas and do take the same trade like i do, please write it in comment so we can manage the trade together.
_____________________________________________________________________________________________________________________
Thank you for your support ;)
GWBFX

Is Ethereum trading in a Inverted H&S?Ethereum seems to be trading in two inverted head & shoulders, one big & small, notice where I've placed the red heads on the chart representing the heads of the pattern, and the Green line is representative of the neckline.
Key Takeaways
An inverse head and shoulders is similar to the standard head and shoulders pattern, but inverted: with the head and shoulders top used to predict reversals in downtrends
An inverse head and shoulders pattern, upon completion, signals a bull market
Investors typically enter into a long position when the price rises above the resistance of the neckline.

LTCUSD mid term forecastIdea : i think of a scenario that can occur if prices reverse are supported by falling wedge reversal and potential inverted H&S patterns formation
**Disclaimer** the content on this analysis is subject to change at any time without notice, and is provided for the sole purpose of assisting traders to make independent investment decisions.
Traders!! if you like my ideas and do take the same trade like i do, please write it in comment so we can manage the trade together.
_____________________________________________________________________________________________________________________
Thank you for your support ;)
GWBFX

How to enter a trade using the inverted H&S (Education, Example)An inverse head and shoulders, also called a "head and shoulders bottom", is similar to the standard head and shoulders pattern, but inverted: with the head and shoulders top used to predict reversals in downtrends. This pattern is identified when the price action of a security meets the following characteristics: the price falls to a trough and then rises; the price falls below the former trough and then rises again; finally, the price falls again but not as far as the second trough. Once the final trough is made, the price heads upward, toward the resistance found near the top of the previous troughs. An inverse head and shoulders is similar to the standard head and shoulders pattern, but inverted: with the head and shoulders top used to predict reversals in downtrends
An inverse head and shoulders pattern, upon completion, signals a bull market
Investors typically enter into a long position when the price rises above the resistance of the neckline.
Chen, James. “Inverse Head And Shoulders.” Investopedia, Investopedia, 18 Nov. 2019, www.investopedia.com

BTCUSD Forecast on H5, bitcoin is getting ready to go higherNote : complete inverted H&S pattern is a pretty good sign that bitcoin will continue its upward movement --> buy on dip
**Disclaimer** the content on this analysis is subject to change at any time without notice, and is provided for the sole purpose of assisting traders to make independent investment decisions.
Traders!! if you like my ideas and do take the same trade like i do, please write it in comment so we can manage the trade together.
_____________________________________________________________________________________________________________________
Thank you for your support ;)
GWBFX
