USDJPY-Weekly Market Analysis-Apr19,Wk4Waiting for USDJPY retrace back into the buy zone for a long opportunity. Plan to exit at the tip of the inverted head and shoulders.
Invertedheadandshoulders


USDJPY short W1:
We are in an impulsive move after the retracement of an uptrend
D1:
We have an inverted H&S at a psychological level (112.00)
which is also a strong Sup/Rez zone
H4:
We can clearly see a couple of Shooting stars/Hanging man candlesticks
which mean that price is retesting the zone but never closing above it
So my view is that price will go down till Fib 61.80% level
which is also a previous support zone
plus keeping in mind that it is a confluent zone between: (a lot of confluence)
-Fib 61.80%
-D1 trendline
-W1 trendline
-previously tested support zone


EW ANALYSIS: USDJPY Remains BullishHello traders! Today we will talk about USDJPY!
After a big three-wave A-B-C corrective decline in March, USDJPY made a nice five-wave recovery that can be a signal of a completed correction within ongoin uptrend, especially after that possible inverted H&S pattern and intraday W-X-Y corrective pullback. So, if continues higher back above 111.60 region, then we can confirm a bullish continuation within wave 3 back above 112.15 area and higher!
However, in case if goes more complex, we remain bullish as long as it's above 109.70 invalidation level!
Trade smart!
Disclosure: Please be informed that information we provide is NOT a trading recommendation or investment advice. All of our work is for educational purposes only.

EurUSD Buy Setup1.Inverted Head and Shoulders forming. waiting for neckline to be broken. 4HR
2. There was divergence indicating that the price was going up. 1HR
3. Has hit major support on D chart and should be rising up to trend resistance.
BE PATIENT!
I have a alarm halfway to my entry to let me know price is almost at my entry and then will place my buy stop order.
Once i have entered the trade i will adjust my stop lost accordingly.


ADABTC completes 1 day golden cross/picture perfect ih&s patternWe can see here on the 1 day ADABTC chart that the price action is responding quite bullishly to the recent 1 day golden cross. Also we can see a picture perfect inverted head and shoulder pattern here which cardano has just now broken above the neckline with good bullish volume to match it. There is still a slight chance at a fakeout here but we should know by the next 1 day candle if this is a legitimate triggering of the inverted head and shoulder pattern. With the volume confirmation here probability favors a breakout more than a fakeout currently especially coupled with the recent golden cross and so I'm listing this idea as long. We also have talk of cardano being added to the ledger cold wallet and cardano also being next up to be added to coinbase...the coinbase rumor is not as solid as the ledger speculation but both are certain to be impacting price at the moment. If the ih&s breakout is triggered I have put a projected breakout price target here in green.

XRPUSD may finally be triggering the ih&s breakout; target= .40I had anticipated the breakout point being right where this dotted green trendline converges with the neckline of the inverted head and shoulders pattern over a week ago so it's cool to see it finally playing out exactly how I anticipated....of course this could be yet another fakeout...we need to see the price reach at least 34 cents first to be comfortable that it is a legitimate breakout. Also need to watch for a good amount of bull volume.

USDCAD Potential Movementprice potentially create butterfly pattern.
inverted head and shoulders will bring price to going up. wait for correction before you take buy entry.
final target on butterfly pattern will also retesting horizontal structure

ADABTC BULLISHINVERTED HEAD AND SHOULDERS, LOOKS BULLISH TO ME, CARDANO ALREADY HAS AMAZING FUNDAMENTALS AND HAS COME DOWN OFF THE 2017 BULL MARKET ENOUGH TO WHERE ITS ALMOST AT ICO PRICE
TAKE ADVANTAGE OF THIS OPPORTUNITY WHILE YOU CAN!

JNUGbeen watching this chart for months eyeing this upsloping IHS. bullish volume pushes and if we do get a sustained pullback on these indices it should be a nice runner.

XRP INVERTED HEAD AND SHOULDERS?Possibly an inverted head and shoulders formed for the reversal from the downward trend of xrp, leading to the breakout of the longterm downwards resistance trendline and head heading to the nearest heavy resistance of around the 0.35 mark.

USDCAD Inverted H & S SetupPossible setup with an inverted Head and Shoulders. I normally would like to wait until a retest of the neckline breakout but I've entered this one a bit early with so much support from the 200 SMA on the daily as well ass channel support. Also Oil trading into resistance after a significant runup. I also believe the fundamentals in the Canadian economy will start to show cracks leading up to the fall federal election. While some of the data in the US economy may also be showing signs of weakening especially after the government shutdown, the other currency alternatives are not much better. I'm expecting broader USD strength against most currencies even in light of recent dovishness. The eventual target is around 1.36 which would be a retest of the late 2018 highs.

EURNZD Inverted Head and ShouldersPrice in the making of right shoulder.
after double bottom price hit the neckline and just rejected from 61.8 level

XRPUSD finds support on IH&S Neckline as 4hr goldencross begins.I'm leaning bullish here even though the 1 day candle closed just under the inverted head and shoulder patterns neckline we are now seeing a decent rebound back above the neckline on the current 4hr chart candle with 20 minutes left to go before the next 4hour candle and we can also see the 4hr golden cross is just now starting to set in. Boh bullish signals....however I'm leaving this idea neutral however because we haven't yet gotten a 1 day chart higher high on btcusd which we will need soon to continue the bullish momentum and hand control of the market over to the bulls. Even though the 4hr golden cross has just now started to occur...in this crucial window for at least the next 3-5 4hour candles it is a zone where a golden cross can end up being a fakeout...to sustain solidify and confirm the golden cross we will definitely need to see the inverted head and shoulder neckline maintain strong support as well as trigger the pattern. until we have confirmation a fakeout is still a possibility. Overall I have a slight bullish bias for now but wanna be prepared for a potential inverted head and shoulder fakeout or even a golden cross fakeou possibility. t

my former bnb chart's about to hit ih&s target & trigger a c&h!We can see the former inverted head and shoulder breakout target I had charted on bnb awhile back is getting closer and closer to its breakout target...it had a retracement before reaching that target however which just so happened to retrace at just the right time to create a perfect cup and has now broken up from a small handle retrace at just the right time...should it reach the inverted head and shoulder target it will also simultaneously break above the rimline of its new cup and handle pattern. Typically priceaction retraces shortly after reaching price target projections so it will be important to make sure after the inverted head and shoulder target is reached that price action doesn't suddenly creep back under the rimline and pull a fakeout...should it trigger the cup and handle breakout as well though we could actually double its price from here which would be phenomenal as it is already at an All Time High I believe. Best to wait for confirmation and not allow yourself to get faked out.

ADABTC @ precipice of ih&s brkout & both a 4hr & 1day goldncrossAll Ada has to do now is overcome the 1 day 200mas resistance(dotted blue line) if it can and flip it to support it will likely then trigger it's inverted head and shoudler breakout as well as both the 4hr golden cross and the 1 day golden cross which will extend it bullishly for quite sometime. Bst to stay reserved on ADA until we see it flip the 1 day 200ma to solidified support first though.


USDCAD weekly outlookUSDCAD
On the weekly moving in a down trend
On the daily we formed an inverted head and shoulder and in the middle of forming the right shoulder pushing down. The move started after a rejection from a weekly zone.
Price on the 1H chart is near a daily zone about 14 pips away from entering that zone. I would look for the pair to continue to push down only because of the holiday and then see a push up afterwards within the days that follow.
If it continues down smoothly in the current direction, at most I see it pushing down to around 1.31947 and this would be a 51.1 pip move from current price.
(SELL)
If it continues down smoothly in the current direction, at most I see it pushing down to around 1.31947 and this would be a 51.1 pip move from current price.
TP1: 1.32175
TP2: 1.31947
(SELL)
If this plays out in the 1.31947 and get a break of the daily zone I’d wait for a break and retest to sell down to the head.
TP1: 1.31547
TP2: 1.31250
TP3:1.30969
(BUY)
If we see the rejection from the daily zone this would trigger the buy scenario. This would also complete the Daily inverted head and shoulder pattern and push from daily zone to zone. The overall move is 154 pips but we will need to see a break above the trend line to confirm this move. The recent down trend rejected the combination of the trend line and a the daily zone.
TP1:1.32189
TP2:1.32431
TP3:1.32726
TP4:1.33129
TP5:1.33505

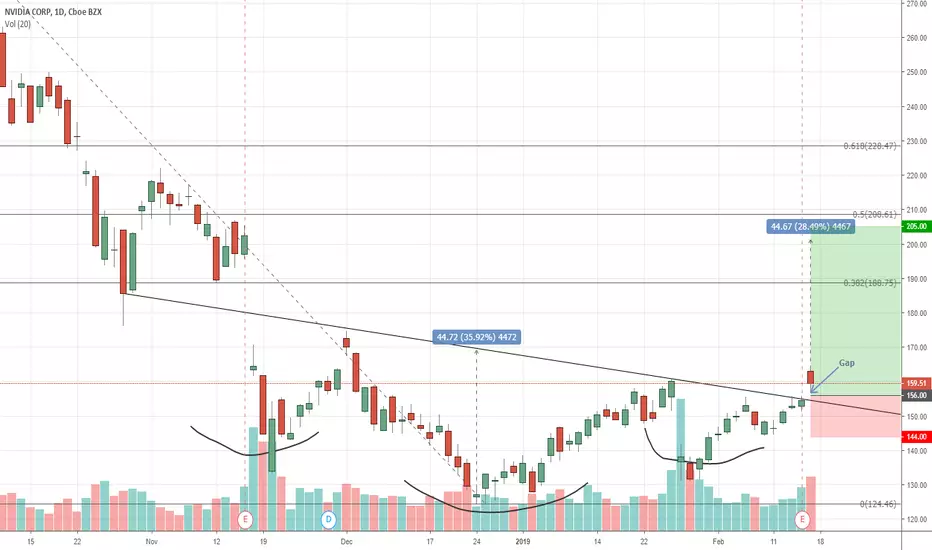
NVDA - Inverted Head & Shoulders (Bullish Reversal)The formation of an inveted Head & Shoulders Pattern plus a gap above the neckline today looks to confirm that the trend is reversing up. It would have been double confirmation if the gap was stronger (ie decisive green candle with a large gap prefered). Nevertheless this could be the start of a new bullish trend with target around 200 mark. I would put a stop loss just below the right shoulder at 143. Let's hope it plays out.
BTCUSD H4/D1 charts (2/15/2019)Good morning, traders. Price is attempting to push its way through the descending wedge's resistance as H4 RSI is pushing through its own resistance. H4 MACD is curled up and nearing a bullish cross above centerline. As we can see, the green target, which is based on the height of the wedge, is near the previous swing high. Traders need to be cautious as price nears that area. A close above that swing high is what is needed. A wick above but close below prints a bearish SFP which will likely have price reversing. However, a close above that swing high opens up the targets I discussed yesterday as price begins closing above the pattern resistances. While anything is possible at all times, there is little-to-no reason to think price is ultimately headed down from here at this time. At the very least, we should see price move up toward $3900. A daily close above $3615 should make this much more likely as that gets price back above the daily pivot. I am still not a big fan of the possible IHS but have left it for those of you who are interested in it.
BTCUSD Shorts may be finding a temporary bottom at the very least. More importantly, they are nearing the area where they have previously bounced and price headed down as a result. Just because it has happened before does not mean it will continue to happen, though, but it is something to keep an eye on. If Shorts happen to drop below that level this time around it may be an indication that the market is reversing.
Every day, we have a choice to act positively or negatively, so if you get a chance, do something decent for someone today which could be as simple as sharing a nice word with them. You just might change their day, or even their life.
Remember, you can always click on the "share" button in the lower right hand of the screen, under the chart, and then click on "Make it mine" from the popup menu in order to get a live version of the chart that you can explore on your own.

USOIL Long (Daily)We got a inverted head-and-shoulder here. We need a weekly close above 63.90/64.00. Potential target to at least Ma200 and 23.6% Fibonacci.
TVC:USOIL
