Invertedheadandshoulders


USDCAD - Broken Resistance Becomes Support !The USDCAD Price Reached a daily Resistance Level !
Currently, the Price is in Strong Support Level (Broken Resistance) and he is testing a support line !
I Expect a Bullish Move 📈
i'm waiting for a confirmation...
TARGET: 1.38250🎯
...
if you agreed with this IDEA, please leave a LIKE, SUBSCRIBE or COMMENT!

The hilarious tale of CardanoKnock, knock!
Who's there?
Cardano.
Cardano who?
Cardano, the financial asset that's creating an inverted head and shoulders pattern. It's currently struggling to break 42 cents, but if it does, it could quickly approach 60 cents!
Wow, that's impressive. But why is it called Cardano?
Well, apparently the creator of the cryptocurrency was a big fan of the Italian mathematician Gerolamo Cardano. And just like Cardano's mathematical formulas, this asset's price movements are pretty complex too!
Haha, sounds like a real brain-teaser.
You got that right. But here's the thing - if Cardano can break 42 cents, it'll be smooth sailing all the way to 60 cents. And that just happens to be where a previous area of resistance was back in August of 2022.
So, Cardano is not just a financial asset, it's also a history buff?
You could say that. But hey, who cares about the past when you've got such a bright future ahead? Once Cardano hits 60 cents, it'll be party time for everyone who invested in it.
Well, count me in! I'm ready to ride this Cardano train all the way to the bank.
Just don't forget to sell when it's time to cash out. Otherwise, you might end up with a bunch of worthless digital coins and a broken heart.
Note: It's best to wait for the 42 cent area to break before getting heavily involved. A nice bounce here, but we're not out of the woods yet.

INVERTED HEAD & SHOULDER FORMATION !!!#OBEROIRLTY📊
👉Inverted Head & Shoulder Pattern📈📉
👉Breakout above 890+ Closing✅
👉Entry after Breakout
👉After Breakout possible targets 930/950/1000+🎯
👉Add to your watchlist👍

MTF Analysis THAT ARE SO OBVIOUS: BTCUSDDo i need to explain lol
i like color coding my timeframes, lines and other markings that correspond to a TF
so everything in color...
Black - Monthly
Green - Weekly
Blue - Daily
Other TFs
Violet - H4
Teal - H1
Orange - M15

Potential for Inverted HSQuick 3 daily chart on FARM/BTC pairing:
- RSI and OBV have been moving up as Harvest Finance moves down vs. Bitcoin.
- Pattern confirmation would be a close and hold above the yellow neckline

BDMS | Inverted Head & Shoulders | Entry @ Breakout SetupPrice Action & Chart Pattern Short-term Trading
> Inverted Head & Shoulders
> Entry @ Breakout Setup
> Target at previous high
> Stoploss @ right shoulder
Indicator:
> Banker Smart Money & Banker Chip Volume Support at significant level
> BBD bullish divergence crossed above baseline
> Banker Fundflow uptrend but not overbought
> KDJ ribbon on uptrend above 70
Trading with affordable risk ratio 2:1 for short term trade
Always respect your stoploss

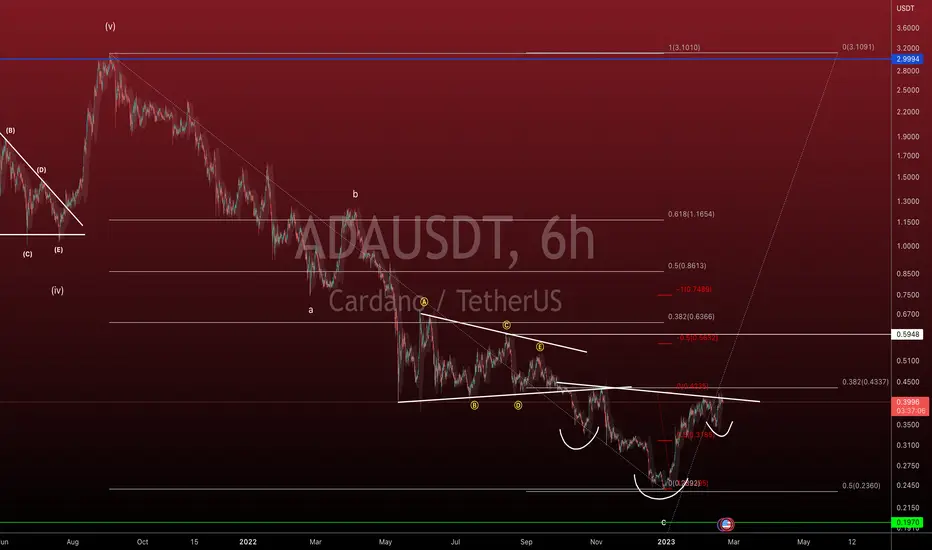
Cardano at a critical pointI gave a pretty vague outlook on Cardano the other day so I figure I should probably fess up a bit and let you all know exactly how I feel about it. Right now, it looks like we're in an inverted head and shoulder pattern. It looks like it wants to explode out of here and o straight for the target which is $0.75 but not so fast. Lets discuss a few things here.
First, do you actually know how to trade a head and shoulders pattern? Pattern trading can be pretty decent as long as you do it right. Ideally, we'll break out of the current pattern and do a nice solid retest of the neckline. Your stop loss should be the low of the right shoulder and your target should be 100% of the size of the head to the neckline. That puts us at right below 75 cents.
To compare, ADA is trading at 40 cents now. That's a pretty good reward, but what is the risk? Currently a 13% risk. That's not insignificant. Play your cards right and you'll be okay but don't do anything dumb. Wait for a breakout and get a retest of this level we're at now (around 40 cents) and you'll be ok. Just keep that stop loss to make sure you survive another day.
DYDX/USDT - Inverted Head & ShoulderCan take a long position if Inverted H%S neckline of 3.269 is broken

BTCUSD: Bearish Divergence at Potential Future NecklineBTC has been forming what looks to be a big Inverted Head and Shoulders pattern at the 0.786 PCZ of a Macro Bullish Cypher and today it tried to make a higher high but failed to maintain relative strength. Now we are in a scenario where it is quite likely that BTC will retrace from here and form what would be a Potential Right Shoulder to test $20k-$16k one last time before ripping to the upside.

ETH [SHORT TERM TRADE]ETH has given a long rally since a week, now it's time for a pullback and then again a rally.
So at daily timeframe it is showing support at 200 EMA and golden zone is at 1449.
- If price closed below 1500 at 1 hour time fame then take a short entry till 1500.
- If price closed above the 1553 at one hour time frame then take a long entry till, easily you can take it till 1580 and second target is 1619.
Note - You can still go long from 1500 and go on till same levels. Manage you risk and follow 1:2 Risk reward ratio.

NIO looking bullish on 4hThe price action may be trying to form an inverted head and shoulders (currently in the process of forming the right shoulder). The RSI seems to be bullish and creating an ascending triangle seem to have completed wave D and now waiting on wave E which should be the breakout wave bringing the RSI hopefully into the overbought territory.

Century Aluminum Company - IHS CENX has managed to claim back the 200dma and has formed a nice inverted head and shoulders pattern to launch off..
$14.50 level above will be the first likely target.
Stop and Target on the chart.

Trippy! MATIC Head & Shoulders 5 DAY INVERTED CHART!We've been in a bear trend for a while, so we are used to looking at down-trends. So..look at MATIC Polygon in the 5 Day time frame, huge Head and shoulders forming, and if this chart plays out, remember it's INVERTED target is $1.60 the common FIB 0.5 retracement of actually increase.
Really Trippy buy if you understand it Matic could have enough steam, but HOT already, Only one or 2 more 5 day periods left before a big marklet cool off, shows in BTC also.
REMEMBER INVERTED CHART

BTG | Elliott Wave Projection | Inv. H&S Breakout +8%Price action and chart pattern trading setup:
> A potential reversal pivot point with an inverted head & shoulders breakout and pullback ENTRY
> Target: 1.0-1.618 fibonanci extension ABC uptrend wave +7-8%
> Stop: Inv. head zone position -4%
> RRR: 2:1 minimum
Always trade with affordable risk and respect your stoploss

KUCOIN GEM: FINDORA LOG CHARTHere you can see the same chart on the log scale. This shows just how beautifully perfect this double bottom pattern + the inverted h&s is.

WC0123 GU Outlook: Overall bullish, short-term bearMTF Analysis
Check annotations in the anchored notes for M-W-D-H4 analysis.

Inverted HS Forming on Bitcoin?Just a quick thought here - this would fake out the bulls and the bears for a little while, and would correspond with DXY moving up very soon from the re-test of the channel it broke out of (area around 99-104 LFTs, 101-103 HTFs).
Failure or success of the HSi would hinge on DXY movement as well:
See related DXY ideas below.
Not marking this as long or short, just want to see if the pattern plays out and then fails and moves down or succeeds and moves up to either set of targets on the chart.

Inverse head and shoulder pattern on Ultratech Cement chartsNSE:ULTRACEMCO
Formation of inverse head and shoulder pattern
Current Price - 7237
Target 1 (diff from left shoulder) - 7650 - remaining upside 413 (5.7%)
Target 2 (diff from right shoulder) - 7825 - remaining upside 588 (8.1%)
Stop Loss (low of last candle) - 6863 - downside risk -374 (-5.1%)
Disc - invested, for educational purpose only.

BPP | Wave Analysis | Bullish Divergence Uptrend Target +25%Price action and chart pattern trading setup:
> ABC correction - main downtrend channel breakout in TFW and bullish Anti Nenstar pattern - possible a major trend reversal pivot point
> Indicator: MACD / RSI bullish divergence - strong reversal signal in TFW
> Entry @ Breakout retest zone SMA50 - 20
> Target @ TP1 17.2 + 15% Inverted Head & Shoulders Target / TP2 18.7 + 25% - Falling Wedge Target - 0.618 Fibonacci retracement and volume profile POC
> Stop @ Inverted head position -7%
> Risk reward ratio: 2:1, 3:1
Always trade with affordable risk and respect your stoploss - nothing 100%

Confirmed Inverse Head/Shoulders on DailySuper quick post - FARM has a confirmed inverted HS on the daily chart. Targets on the chart, fails if we lose the neckline - halfway point to TP 1 lines up exactly with the 200 day EMA, which will likely act as a pit-stop as it begins moving up.
Related longer-term bullish FARM chart below:

NZDUSD (BUY) Inverted H&S OUTLOOK D1NZDUSD is trading at an area of interest which we are currently in a bullish trend. A short term consolidation is needed to complete a potential bullish continuation structure or we may just breakout upwards of the neckline as we have Inverted H&S pattern in completion.
I personally expect short term growth of USD before continuing the bullish trend. Looking for a buy opportunity around 0.62200.
What's your view on USD?
Leave a comment below and share your opinion!
Trade Safe
Thanks
