The Final Parabola: What History Says About Bitcoin’s July MovesIf you’ve been following here for a while, you know we’ve been nearly pinpoint in calling all the moves for Bitcoin. The altcoin market, not so much, but check out previous TAs to catch up on my perspective.
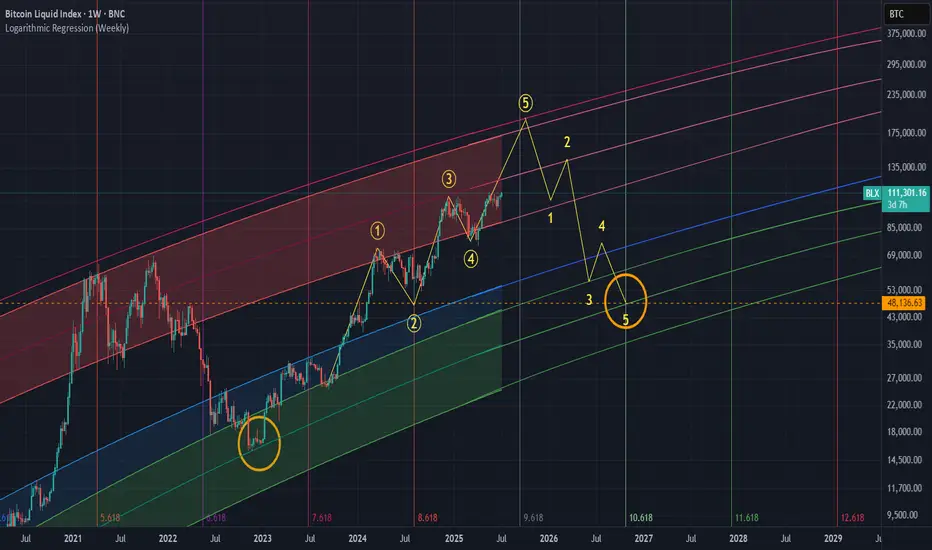
The two wave counts you see on the main chart have been in place for many months, I believe since around October 2024. As you can see, things have been playing out perfectly so far. The four year cycle continues to follow its path.
If the same thing happens this cycle like the last two, we should see a top sometime between October and December 2025, anywhere from 185K to 225K, followed by a cycle low somewhere around 48K in October 2026.
Bitcoin’s Julys
Every July during the 4th cycle year, Bitcoin begins its final parabolic run. This has happened without fail since the beginning of the Bitcoin Index chart. July consistently marks a major bottom, and then it's off to the races. The “only up” period that follows typically lasts 4 to 6 months and happens just once every four years like clockwork.
Here we are once again, the 4th year of the cycle, in July. Bitcoin has just hit all time highs and we've had a Hash Ribbon buy signal.
The perfect storm is brewing. Like always, the stars align in the second half of the 4th year of the Bitcoin cycle.
Time Cycles and Fibs
Looking at this time wave chart, we can see that every two waves like clockwork have marked a top. The next major wave appears to land in December 2025.
If we zoom into this smaller time wave, it has pinpointed the bottom of every small wave so far. The fact that we are once again at a bottom in July during the 4th year of the Bitcoin cycle is just another sign of the magical stars aligning.
This smaller Fibonacci sequence I’ve been tracking has already hit twice and predicted two major moves. The next dates to watch are August 2025 and January 2026.
There’s plenty of talk about an extended cycle. But during the last bull run, many traders and analysts said the same thing. In the end, Bitcoin topped out at exactly the same timeframe as the previous cycles.
If we reach the top of this model in Q4 2025, and we see a Pi Cycle Top signal along with a Mayer Multiple over 2.0, that will be our trigger.
If you've been sidelined this entire time, it's now or never. You don’t want to be the one buying in at 185K in Q4 2025 when everyone is calling for a million dollars. The time to act is now.
Invest
CULT DAO ON ITS WAY TO A BILLION DOLLAR MARKET CAPIf you want an in-depth look at everything CULT DAO, check out the TA below:
This is just a technical update.
A massive breakout occurred as expected. I’ve been highlighting the divergence forming in the MACD for months — it’s all detailed in the TA above.
Over the last 1,096 days, CULT DAO has formed a giant descending wedge — both in price structure and on the MACD. The path was clear.
Onwards and upwards.
A billion-dollar market cap is very possible by Q4 2025.
Breakthrough tech.
Mainnet launch around the corner.
Rocket ship loading.

INDIANB - 640 ABOVEIndianb no have in very good levels, long consolidation breakout and sustaining near
ATH...
Above 640 possible good rally up side for short term gain

Stocks & ETF : Breaking out and Ready for Massive Bull runBelow is the list of stocks and ETFs that are in the early stage of breakout with ultra volume level. Good time to buy.
NSE:SCHNEIDER
NSE:ASAHIINDIA
NSE:HINDZINC
NSE:ABREL
NSE:TATAINVEST
NSE:UJJIVANSFB
NSE:PNBHOUSING
NSE:BANDHANBNK
NSE:DLF
NSE:ICICIGI
NSE:IDFCFIRSTB
NSE:SHRIRAMFIN
NSE:AUTOBEES
NSE:INDUSINDBK
NSE:ABB
NSE:TATACHEM
NSE:GODREJPROP
NSE:SIGNATURE
NSE:JPPOWER
NSE:HFCL

USDCHF: weekly overviewHello Traders,
In long-term, we anticipate a bearish move to 0.76500 for this pair. but for this week, our most important zone is the 0.81911
**********************************************************
The indicated levels are determined based on the most reaction points and the assumption of approximately equal distance between the zones.
Some of these points can also be confirmed by the mathematical intervals of Murray.
You can enter with/without confirmation. IF you want to take confirmation you can use LTF analysis, Spike move confirmation, Trend Strength confirmation and ETC.
SL could be placed below the zone or regarding the LTF swings.
TP is the next zone or the nearest moving S&R, which are median and borders of the drawn channels.
*******************************************************************
Role of different zones:
GREEN: Just long trades allowed on them.
RED: Just Short trades allowed on them.
BLUE: both long and short trades allowed on them.
WHITE: No trades allowed on them! just use them as TP points

Why is ROBINHOOD dropping in afterhours? Robinhood's stock (HOOD) is dropping in after-hours trading due to several factors:
1. Regulatory Scrutiny: The company is facing increased attention from regulators, particularly regarding its expansion into unconventional financial offerings like sports betting-related features.
2. Analyst Downgrade: Wolfe Research recently downgraded Robinhood's stock from "Buy" to "Hold," citing valuation concerns and suggesting that the stock's upside potential has already been priced in.
3. Competitive Pressure: Traditional banks and fintech startups are ramping up their offerings, making it harder for Robinhood to maintain its market dominance.
4 Investor Uncertainty: Some investors are skeptical about Robinhood's new ventures, such as its push into banking services and prediction markets, which blur the lines between trading and gambling.
5. Technical Resistance: A clear parallel channel is bringing Hood back to planet earth. This stock has had a 160% run with minimal pullback, profit taking is highly likely.

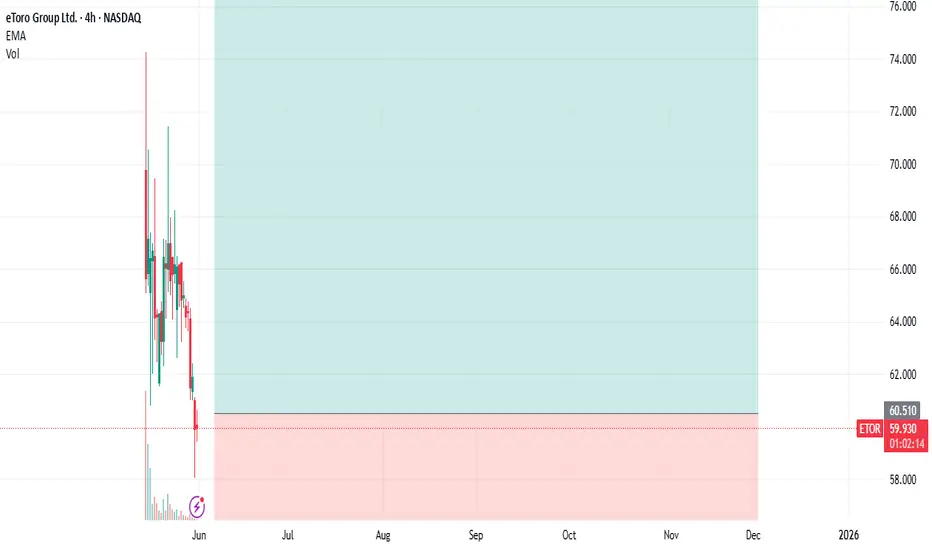
ETOR : Entry after IPOKind of social trading platform.
Etoro Platform also uses artificial intelligence.
I researched that it also allows trading of crypto assets.
$10B SPAC initiative canceled in 2022.
We re approaching mid 2025 .
Current market cap: around $5-5.3B.
Ground for progress may be present in good market conditions.
While institutions bought at $52, individuals were most likely able to buy above $70.
This was a great misfortune.
Very high opening of the IPO caused sharp sales, but holding for the medium term may be beneficial.As I briefly mentioned above, parameters that will bring momentum to stock may occur.
Constantly looking at the screen so much in such instruments can create a huge sense of panic and failure.
Target price: 90.00 - 94.00
Stop: 50.00
Amount: 1/3 of your portfolio's financial technology stocks ( e.g)
Risk - Reward Ratio > 2.80
Regards.
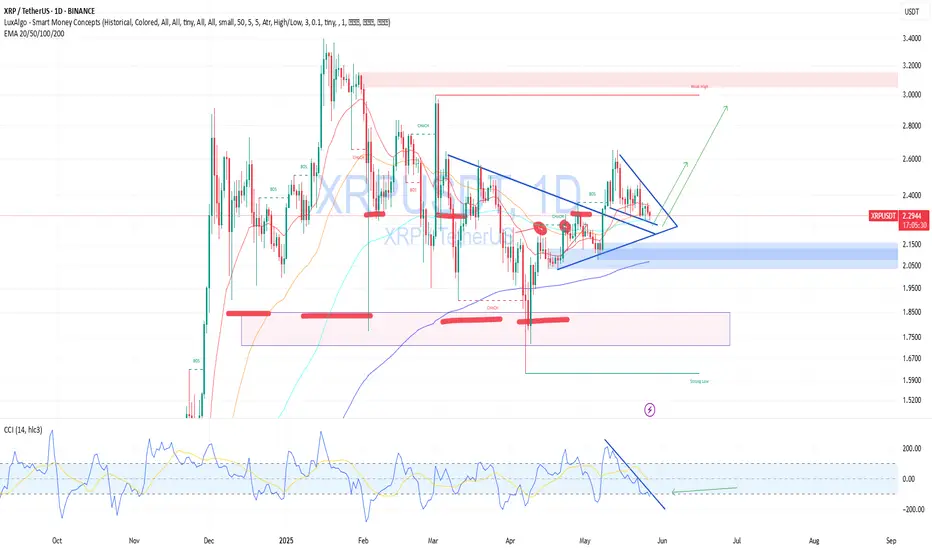
XRPUSDT — Buy From Support, Waiting for Triangle BreakoutOn the 4H chart, XRP is consolidating inside a symmetrical triangle and holding above an ascending trendline — a key support zone that has held multiple times.
🧠 Fundamentally:
Ripple continues expanding partnerships with fintech and banks.
The SEC lawsuit has lost its grip on price action.
A potential Fed rate cut could push crypto sentiment up again.
📌 I’m entering positions near $2.31, gradually accumulating. A breakout above the triangle could trigger a strong move.
🎯 Targets:
$2.50 — initial resistance
$2.65+ — if breakout is confirmed with strong momentum
🔽 If price breaks below $2.20, I’m looking to buy confidently near $1.80, where major demand sits. I don't expect such a dip, but markets can surprise.
Primoris Services: A Long-Term Pick in US Energy Infrastructure◉ Abstract
Our latest analysis focuses on the booming U.S. utility and energy sector, set to hit a massive $1.1 trillion! Learn about the key drivers fueling this growth, from our increasing electricity needs and the electric vehicle revolution to the exciting rise of clean energy.
We have also given a “Buy” rating on Primoris Services Corporation NYSE:PRIM , a major player in building this energy infrastructure. Our analysis reveals their strong financial performance, attractive valuation compared to its peers, and promising technical indicators. While acknowledging potential headwinds like regulatory shifts, we believe Primoris presents a compelling long-term investment opportunity with significant upside potential. Read detailed analysis here and invest smartly.
Read full analysis here...
◉ Introduction
Imagine the companies that bring electricity to your home, the gas for your stove, and are building the future of clean energy. That's the U.S. utility and energy sector! It's a massive part of the American economy, and it's getting even bigger. By 2025, experts predict it will be worth a whopping $1.1 trillion! This includes everything from generating electricity to delivering it through power lines and pipelines, as well as distributing natural gas across the country.
This sector has been steadily growing at about 2.7% each year between 2020 and 2025, and it looks like this growth is going to continue. This article will give you a snapshot of the major reasons behind this growth, top players in this sector, and investment opportunities.
◉ Major Factors Behind the Growth of US Energy Sector
1. Electricity Use is Climbing: Americans are using more power than ever. The EIA expects electricity consumption to hit 4,205 Billion kWh in 2025, up from 4,097 Billion kWh in 2024. This surge is fuelled by increased usage in residential, commercial, and industrial sectors.
2. Everything’s Going Electric: Think about electric cars, heat pumps that heat and cool homes, and even cleaner machines in factories. More and more things are switching to electricity, which means we need even more power! This big shift towards using electricity is called electrification, and it's a major driver for the energy sector.
3. Clean Energy on the Rise: Solar panels and wind turbines are becoming a bigger part of how we get our electricity. These renewable energy sources are growing fast. By 2026, it's expected that they will provide about 27% of all the electricity in the U.S., up from around 25% in 2024. This move towards cleaner energy is really important for the future.
4. Massive Investments Ahead: To keep up with this growing demand and the shift to new technologies, utility companies are investing a lot of money. They are upgrading power grids (the network of lines that deliver electricity), building charging stations for electric vehicles (EVs), and using smart technologies to manage energy better. Experts at S&P Global predict that total spending on these things could be over $790 Billion between 2025 and 2030!
◉ Big Players in Building the US Energy Infrastructure
1. Quanta Services, Inc. NYSE:PWR : A premier provider of specialized infrastructure solutions for the electric power and oil & gas sectors. They are also heavily involved in renewable energy projects like solar and wind farms. You can learn more about them on their official website .
2. Primoris Services Corporation NYSE:PRIM : They provide construction and engineering services for the energy, utility, and infrastructure markets. They are increasingly focusing on building projects related to renewable energy. You can explore their details on their official website .
3. MasTec, Inc. NYSE:MTZ : This is a top infrastructure company in North America, working on energy, utility, and communication projects. This includes building renewable energy facilities, telecom networks, and oil & gas pipelines. You can find more information on their official website .
This report offers an in-depth analysis of Primoris Services Corporation , a prominent player in the U.S. energy infrastructure space.
Our long term recommendation is backed by Primoris Services Corporation ’s technical analysis and fundamental performance.
◉ Investment Advice
💡 Buy Primoris Services Corporation NYSE:PRIM
● Buy Range - 67 - 68
● Sell Target - 88 - 90
● Potential Return - 30% - 45%
● Approx Holding Period - 12-14 months
◉ Revenue and Profit Analysis
● Year-on-Year
- In FY24, Primoris reported revenue of $6,367 Million, marking an 11% increase from $5,715 Million in FY23.
- EBITDA grew to $415 Million, up from $366 Million the previous year, with the EBITDA margin slightly improving to 6.5% from 6.4%.
● Quarter-on-Quarter
- Q4 FY24 revenue reached a record $1,741 Million, up from $1,649 Million in Q3 and 14.9% higher than $1,515 Million in Q4 FY23.
- Despite the revenue growth, Q4 EBITDA declined to $110.6 Million from $123 Million in Q3.
- Diluted EPS (LTM) rose to $3.30 in Q4, up from $3.00 in Q3 FY24, indicating solid earnings momentum.
◉ Valuation
1. P/E Ratio (Price-to-Earnings)
● Compared to Peers:
- PRIM’s P/E is 17.9x, much lower than the peer average of 32.7x. This means the stock is cheaper than most competitors based on earnings.
● Compared to Industry:
- With a P/E ratio of 17.9x, PRIM trades below the industry average of 26.4x, suggesting it offers strong value within the sector.
2. P/B Ratio (Price-to-Book)
● Compared to Peers:
- PRIM’s P/B is 2.6x, while peers average 4.5x—again showing the stock may be undervalued.
● Compared to Industry:
- Compared to the industry average of 4.4x, PRIM still appears to be a bargain.
3. PEG Ratio (Price/Earnings to Growth)
PRIM’s PEG ratio is 0.43, which suggests the stock is not only cheap but also expected to grow earnings strongly—an attractive combination for investors.
◉ Cash Flow Analysis
- Primoris saw a strong improvement in operating cash flow, which jumped to $508 Million in FY24 from $196.8 Million in FY23—a sign of better cash generation from its core business.
◉ Debt Analysis
- With a debt-to-equity ratio of 0.42, the company maintains a solid financial position, suggesting its debt levels are well under control and not overly risky.
◉ Top Shareholders
- The Vanguard Group holds a substantial 11.6% stake in Primoris, reflecting strong confidence in the company.
- BlackRock also increased its investment by 9.65% from Q3 FY24 and now owns approximately 11.3% of the company.
◉ Technical Aspects
- On the monthly chart, the price is in an overall uptrend and has bounced off the trendline support, indicating continued upward momentum.
- On the daily chart, the price has broken through a rounding bottom pattern and is holding above the breakout zone, suggesting a potential for further upside movement.
◉ Potential Risks & Challenges
1. Regulatory Uncertainty: Ongoing concerns about global trade policies, tariffs, and regulatory changes, especially in the solar and battery storage markets, could impact future project economics and timing.
2. SG&A Expenses: Increased by $10.9 Million year-over-year, driven by higher personnel costs and $3.2 Million in severance expenses.
3. Energy Segment Backlog: Experienced a decrease due to the timing of new solar awards, potentially affecting future revenue visibility.
◉ Conclusion
Primoris Services Corporation NYSE:PRIM stands out as a promising investment, backed by consistent growth, strong financials, and a strategic focus on renewable energy and infrastructure. Despite facing risks like regulatory changes and backlog fluctuations, its solid position in the U.S. energy sector—especially with increased demand for clean energy solutions—gives it a clear path forward. With a competitive valuation and support from major investors like Vanguard and BlackRock, Primoris is poised for sustainable growth, making it an attractive long-term opportunity for investors.

CRYPTO ALT COIN GEM HUNTING!I hope you guys enjoyed the video! Feel free to comment down below other Alt coins that you are buying!

This Low Cap Alt will 20-50x (CULT DAO)This crypto cycle has been brutal for alts. There have been massive shakeouts over and over, a relentless onslaught of rug pulls and scams, and the "Pump.fun" casino on Solana that’s drained billions of retail liquidity and transferred it to the few.
The few always seem to win, and the many always seem to lose. Today, if you’re reading this, it might all change.
CULT DAO could easily 20-50x from now until October 2025. Let’s take a look at the MACD divergence.
### Technical Divergence
For 750 days, this bullish divergence has been forming on the histogram MACD. Every new low on price has formed a higher low on the MACD.
Let’s take a look at a case study of what happens when we get this form of divergence.
I traded this exact same pattern in 2022 that resulted in a nearly 425% move. The play function doesn’t work because they rebranded, and that ticker is no longer valid, but you can scroll to the bottom in my comments on that TA and see the move. I’ll post it under this as well.
As you can see, we got that 425% move. Currently, CULT DAO is showing exactly the same histogram divergence.
Here are some examples of zigzag impulses on low-cap alts. You tend not to get 5 waves; instead, you get this zigzag pattern. This is what I predict CULT DAO will do since it’s only a 5 million market cap.
We can also see in the chart that the 0.618 time Fibonacci level hits at the end of October 2025, which is exactly where I think the altcoin market will top. Check out previous TA on that.
This is only scratching the surface of what is to come for CULT DAO. I have presented to you the technical reason why a big move is stirring and why, at the apex of these divergences, the stars align, and you have the catalyst present itself, and boom—the explosive move comes all at once, and it will be extremely volatile because of its low market cap.
### Let’s Start with the Tokenomics
Every time someone sells or buys CULT DAO on Uniswap, there is a 0.40% tax that goes to a treasury. The top 50 stakers get to pass proposals that fund projects/investments. The idea is to remove the centralized component of funding a project.
121 projects have been funded over the last three years with 3 million dollars.
- Total CULT Funded: 479,751,081,214 CULT
- Total ETH Funded: 1,573 ETH
- Proposals Funded: 121
- Total USD Funded: $3,289,596
- Total ETH Burned: 303 ETH
Allocating these funds has been a learning process over the last three years, but every failure has been necessary in preparing the DAO for what’s to come next.
### The Big Catalyst
The creator of CULT DAO has been working on a blockchain that will function on a custom gas token—that’s right, and that custom token will be CULT DAO. You heard correctly.
Every transaction, every deployment on the blockchain will require the CULT DAO token as gas to execute. The implications are massive. There are multiple dApps that are currently being constructed on the Modulus blockchain.
A privacy-first zkEVM blockchain like Modulus means a scalable, Ethereum-compatible blockchain that prioritizes user privacy through zero-knowledge proofs, allowing optional private transactions while maintaining decentralization.
Modulus is a privacy-first zkEVM blockchain and is scheduled to release this year between April and August 2025. I hope now you’re starting to see the picture.
### CULT DAO and ETH Liquidity Pools
So, why does the price of CULT go down if there is currently very little volume? Well, CULT DAO and ETH liquidity pools are tied together, so if the ETH price goes down, so does CULT. In turn, if ETH goes up, so does CULT.
You can see that CULT is nearly at a 1:1 ratio with ETH for now, coming in at a 0.91 ratio.
In other words, if my thesis is correct about ETH and it goes to 15,000 dollars, the price of CULT would be as follows:
- ETH at $10,000:
CULT Price: $0.000005008 (4x increase).
Market Cap: $21.38M (4x increase).
- ETH at $15,000:
CULT Price: $0.000007512 (6x increase).
Market Cap: $32.08M (6x increase).
That’s right—if nobody even bought CULT, not one dollar, the base liquidity increase of ETH would bring the market cap to possibly 32 million, in other words, if you were thinking of buying ETH, why don’t you just buy CULT DAO?
You can buy ETH now; from this price, 15,000 is 7x, or you can buy CULT DAO, get 6x plus whatever extra volume is coming in. It seems like a logical play, really.
Everything you’ve seen so far is why I believe this MACD histogram divergence has been forming for 750 days. As I said, the stars will align at the apex, and the explosion will come.
### Unruggable and No Whales Controlling Supply
As you can see from the bubble map, the largest wallet that is not an exchange has a cluster total of 0.7%. The rest of the clusters you see in the image are basically exchange wallets, which are the red and dark green circles mostly.
Liquidity is also locked for over 200 years.
- Burned Supply = 1.29664T
- Circulating Supply (including staked) = 4.27T
- Staked Supply = 1.07599T
- Remaining Tradable Supply (excluding burned and staked) = 4.27T - 1.29664T - 1.07599T ≈ 1.89737T
So, no whales, and it’s not possible to rug because liquidity is locked.
### Modulus Blockchain Liquidity Injection
The average liquidity injection for DAOs in ZK would be anything from 200,000 to 10 million. Let’s assume it’s a $1M injection that is split 50/50 between CULT and ETH, a common practice for Uniswap-style pools.
- CULT Amount in Pool: At the current price of $0.000001252, $500,000 buys ~399.36B CULT ($500,000 ÷ $0.000001252).
It would increase the price to a 10 million market cap overnight.
### Conclusion
- Liquidity is locked for 200 years
- No whales
- Not possible to rug
- Mainnet launching this year
- ETH pools tied to CULT
- MACD histogram divergence
The target I have for CULT is just based on Fibonacci levels. Honestly, it’s unpredictable what will happen, how high it will go, or the impact the Modulus chain will have. 120 million is my low-end estimate; the macro Fibonacci is much higher.
The last extension puts it at a 1.4 billion market cap and 266x from where we are now.
This is where you want to be for the upcoming alt season—right here, down 98% with this massive divergence and all these factors that come into play. Just the mainnet launch and ETH going to 10,000 basically sends this to a 30-50 million market cap.
Cult DAO and Satoshi Nakamoto share a common ethos of decentralization and anti-centralization. We need to embrace this notion and bring back the power to the many. If CULT DAO hits 1.4 billion dollars, the treasury funds would be in the millions; we fund our own future.
moduluszk.io
cultdao.io
cultdao.io
coinmarketcap.com

Bitcoin Bearish Dead Cat BounceI am not a financial advisor. This is not meant to be and does not constitute financial, investment, trading, or any other types of advice or recommendation.

ITS TIME , FINAL WAVE FOR BITCOIN HAS BEGAN The final wave for Bitcoin has officially started; 200k by September 2025 is the call. So far, since October 2024, we have been getting every macro move correct. Going to avoid repeating a lot of content from the previous two TAs; check it out below.
The lower high on the RSI called the momentum shift on this one; it was clear.
December 17th, 2024, calling for a pullback down to 82k for wave 4 to complete; it hit 77k, pretty close.
So last time, I was wrestling with two different dates for a cycle top; the first one was May 2025, and the second was September 2025.
It is clear to me now that mid to late September 2025, Bitcoin will peak at around 200k. It could go slightly higher, but the 185-200k region has a higher outcome.
So, I've been using this small-time Fib, and last time when we hit the 0.618, it was the breakout week for Bitcoin from the long range. We're here again; this week is the big pivot and start of wave 5.
The hash ribbon has confirmed a buy signal, and more importantly, it flashed buy in my Time Fibonacci week. Amazing. If you've been with me for years, you already know that this is the best signal for Bitcoin there is. It is so damn good; this gives so much more weight to my thesis.
Stars seem to align again. They constantly try to shake you out; this is the game. Who is going to fade the hash ribbon buy? It's been the easiest play time and time again.
Seriously, though, for just a moment—are you really going to fade the hash ribbon? :)

XLMUSDTXLMUSDT From the specified range (of course, now) it should reach the price of 0.5169, in the middle of the way it will correct at the price of 0.3755 and then it will rise towards the target, this is certain
Market geometry is right


XRP Weekly-Monthly Analysis / Retracement Levels for BuyWeekly - Monthly trend: Bearish
Chart Pattern: Head & Shoulders (H&S) - Bearish Continuation Pattern
Bearish Candlesticks signals:
HANGING MAN (Bearish, Single Candlestick pattern) / Weekly Timeframe / 09 DEC 2024
BEARISH ENGULFING (Bearish, Double Candlestick pattern)/ weekly Timeframe / 27 JAN 2025
TWEEZER TOP (Bearish, Double Candlestick pattern) / 1 Day timeframe / 20 FEB 2025
FALLING THREE METHODS (Bearish, five-fold Candlestick pattern) / 1 Day timeframe / 07 MAR 2025
Retracement Fib Price Levels:
0.00% (3.4000)
23.60% (2.6879)
38.20% (2.2474)
50.00% (1.8914)
61.80% (1.5353)
78.60% (1.0284)
100.00% (0.3827)
Good prices for buy (the lower the better):
61.80% (1.5353) – Golden Zone / Golden Pocket
78.60% (1.0284) – Entry Zone
Between 78.60% (1.0284) and 100.00% (0.3827) is the Risk Zone, which we have the Neckline of the ‘’ Quadruple Bottom Pattern ‘’ at the price range ‘’ 0.6291 – 0.7850 ‘’
I am having buy limit at 0.78500 on the neckline of ‘’ Quadruple Bottom Pattern ‘’.

Monthly Breakout but still...Monthly Breakout; However, still at Important Resistance zone.
Once 10.70 is Crossed & Sustained, 12 - 12.50 can be easy Targets.
It has given a Breakout from Rectangular Channel around 8.70 - 9.
& also re-tested it.
Hidden Bullish Divergence has also appeared.
as of Now, it should not break 6.60.

POL buying opportunity PSX:POL shows signs of potential support at $0.25-0.3, aiming for a triple bottom. If it holds, expect a move to $0.55. Always do your own research before investing. #crypto #investing

ISSC: A Key Investment Opportunity in Aerospace and Defense◉ Investment Advice
💡 Buy Innovative Solutions and Support NASDAQ:ISSC
● Buy Range - 11.5 - 11.8
● Sell Target - 14.6 - 15
● Potential Return - 25% - 30%
● Approx Holding Period - 08-12 months
◉ Company Overview
Innovative Solutions and Support, Inc., founded in 1988 and based in Exton, Pennsylvania, is a systems integrator specializing in aviation technology. The company designs, manufactures, and services flight guidance systems, autothrottles, cockpit displays, and related products, including air data computing devices, flight management systems, GPS units, and inertial reference systems. It also provides magnetic variation software and operates manufacturer system software. Serving commercial airlines, corporate aviation, the U.S. Department of Defense, government agencies, foreign militaries, and OEMs, the company delivers advanced solutions for aviation and defense sectors globally.
◉ Market Capitalization - $207 M
◉ Other Key Players in the Same Industry
1. GE Aerospace NYSE:GE - $219.6 B
GE Aerospace is a leading global provider of commercial and military aircraft engines, systems, and services. The company is a subsidiary of General Electric (GE) and has a rich history dating back to 1917.
2. Honeywell International NASDAQ:HON - $144.8 B
Honeywell is a multinational conglomerate that produces a wide range of products, including aerospace systems, industrial control systems, and consumer products. The company's aerospace division is a leading provider of avionics, engines, and other aircraft systems.
◉ Key Drivers of Future Revenue and Profit Growth
1. Growth in Military Programs: New contracts, like the U.S. Army's adoption of the ThrustSense Autothrottle and multifunction displays for foreign military platforms, signal strong future revenue potential in defense markets.
2. ISSC Next Strategy: Focused on commercial growth, this strategy includes new OEM and retrofit programs, product acquisitions, and launches like UMS2, aiming to accelerate revenue growth and improve operating margins.
3. Manufacturing Expansion: Increased in-house production and capacity enhancements are expected to boost operating margins and EBITDA by reducing reliance on external suppliers and improving scale efficiencies.
4. Strategic Acquisitions: Acquisitions, particularly from Honeywell, provide revenue synergies and cross-selling opportunities, diversifying offerings and expanding customer bases to drive profitability.
5. Investment in Advanced Technologies: Innovations like AI-integrated cockpit automation position the company to meet future demand in both commercial and military sectors, supporting long-term earnings growth.
◉ Key Risks to Consider
1. Margin Pressure from Military Sales: The company's reliance on military contracts, which typically have lower gross margins than commercial contracts, may negatively impact overall profitability.
2. Integration Challenges from Acquisitions: The integration of recent acquisitions, such as those from Honeywell, is uncertain and may prove difficult, potentially affecting revenue growth and operating margins.
3. Debt-Related Financial Risks: The significant debt incurred from the Honeywell acquisitions poses a financial risk, which could lead to cash flow constraints or higher interest expenses, impacting net income.
4. Operating Expense Pressures: The planned increase in manufacturing capacity and R&D investment may add pressure on operating expenses. If not managed effectively, this may not translate to proportionate revenue growth, impacting net margins.
5. Revenue Realization Risks: The long sales cycle and complexities associated with military contracts may delay revenue realization. If anticipated backlogs do not convert as scheduled, this could affect short- to mid-term revenue expectations.
◉ Technical Analysis
➖ Following a record high of $14.6, the stock plummeted by nearly 90% and entered a prolonged period of consolidation.
➖ However, a bullish reversal pattern, known as an Inverted Head & Shoulder, has formed during this phase.
➖ With a decisive breakout, the stock has also cleared its long-term trendline resistance, indicating a potential trend reversal.
➖ We expect this upward momentum to persist, driving the stock price higher.
◉ Revenue and Profit Analysis
● Year-on-year
➖ FY24 sales soared 36% to $47.2 million, up from $27.7 million in FY23.
➖ EBITDA jumped to $12.6 million, a significant increase from $8.5 million in FY22.
➖ EBITDA margin expanded to 26.7%, up from 24.32% in the same period.
● Quarter-on-quarter
➖ Q4 sales reached a record high of $15.4 million, surging 30% from $11.8 million in Q3 and 18% from $13 million in Q4 2023.
➖ Q4 EBITDA climbed to $5.9 million, up from $2.6 million in Q3.
➖ Q4 diluted EPS rose to $0.40 (LTM) from $0.37 (LTM) in Q3 2024.
◉ Valuation
● P/E Ratio
➖ ISSC's P/E ratio stands at 29.8x, which is relatively in line with the industry average of 33.7x, indicating fair valuation.
● P/B Ratio
➖ With a P/B ratio of 3.3x, ISSC appears undervalued compared to the industry average of 4.5x.
● PEG Ratio
➖ ISSC's PEG ratio of 1.83 suggests the stock is fairly valued, considering its anticipated earnings growth.
◉ Cash Flow Analysis
➖ ISSC achieves remarkable growth in operational cash flow, rising 176% to $5.8 million in FY24 from $2.1 million in FY23.
◉ Debt Analysis
➖ ISSC's debt-to-equity ratio stands at 0.60, signalling that debt is not a significant concern for the company.
◉ Top Shareholders
➖ The Vanguard Group holds a significant 3% stake in the company, indicating institutional confidence in its growth prospects.
◉ Conclusion
The U.S. aerospace and defense market is projected to grow significantly, reaching an estimated $694.86 billion by 2030, with a compound annual growth rate (CAGR) of 5.76%. This growth is fueled by rapid technological advancements, including innovations in artificial intelligence (AI), advanced materials, 3D printing, and autonomous systems, which are reshaping the industry landscape.
Innovative Solutions and Support, Inc. (ISSC) is strategically positioned to capitalize on this expanding market, leveraging its expertise in advanced aviation systems, strong military and commercial contracts, and ongoing investments in cutting-edge technologies.
For investors seeking exposure to the aerospace and defense industry, ISSC represents a compelling opportunity, supported by its solid financial performance, favorable valuation metrics, and alignment with long-term market trends.

The Bitcoin Peak: When Will the Cycle End?Been a while since I published a TA. I’ve been digging deep trying to decipher when the cycle top will come in for Bitcoin. Some say it’s an impossible feat. Well, let’s give it a go.
There are two major dates and one minor date for a possible cycle top:
May 2025
**Volume Flow**: 1157 Days
**From June Bottom**: 1064 days
**ETH clear bottom**: June 2022
**Bar Pattern Fractal**: From 2015 bottom
**221k Price Target**: Target crosses with the model in May.
September 2025
**From November Bottom**: 1064 days
**Major Macro Time Fibonacci**
**Chainlink Fractal**
**Chainlink Time Fib**
March 2025
**Small Time Fibonacci**
**Bull Flag End**
**Average % move and time since 2019**
As you can see, there is a lot of evidence to unpack here, so it’s going to be a long one. Let’s start with the first date: May 2025.
---
May 2025
Volume Flow on Heikin Candles on the Monthly shows that from the Bearish cross to the cycle top is 1126 days, which ends up being May.
Every cycle, Bitcoin has always put in a double bottom to mark its cycle low. As you can see, in 2022 we had two major crashes, and even though it’s not 100% clear here, we got a double bottom.
The amazing thing about the first bottom in June 2022 is that it mirrored the first bottom of the cycle low of 2015. That fractal was a mirror, showing the importance of this first low in Bitcoin in June 2022.
If we overlay the 2015 fractal, we get the top coming in May.
For anyone who doesn’t know, the last two cycles, Bitcoin has taken 1064 days from Cycle Low to Cycle Top. 1064 days from the June 2022 low is May.
ETH has a much clearer bottom than Bitcoin this cycle. It also took 1064 days, which puts it in May.
So you can see, there is a lot of evidence pointing towards a May 2025 Cycle Top for Bitcoin.
---
September/October 2025
1064 days from the second bottom in November 2022 would be October 2025.
For years, I have been using this Major Macro Time Fibonacci sequence that shows me important moments in Bitcoin’s cycles. The last pointed to a move down to 48k in August 2023, which is hard to see on the 2Week chart.
As you can see, it comes close to pinpointing moves, so the next date is the end of September 2025, which lines up with the 1064 days from November 2022.
I have been following this Chainlink fractal for more than a year. We traded LINK using this fractal back in October 2023. You can check my TAs from that period. The fractal is still valid and tops in September 2025.
Chainlink Fibonacci Time Sequence has been hitting home runs time and time again, from pinpointing the top all the way down to the bottom. The next date is late August 2025, very close to September 2025.
---
March 2025
This date has far less weight for a cycle top but could be part of a major local top and correction.
A small Time Fibonacci sequence taken from this level shows that March 31st is the next date, and the one after that is late August 2025, the same as the Chainlink fractal.
240% over 162 days is the average that Bitcoin moves up since 2019. If we just overlay the average, we get 127k by mid-February 2025.
A mirror move from October 2023 to March 2024 puts us in March 2025.
---
Elliott Wave Section
I’m not an expert in this field but will throw in some takes.
Could we possibly be in Wave 4 out of 5?
Or could we be finishing Wave 3 right now and in for the first large correction of this bull market?
The fact is, the last time we hit this band on this model was January 2021. After that, there was a 31% correction lasting 31 days.
Sometimes 5 waves are very clear. Take GOLD, for example: there is a clear 5-wave pattern at max Fibonacci extension. This is a massive macro sell signal, in my opinion. Crazy how GOLD hit this level on Wave 5 as Bitcoin breaks 100k.
---
### **Price Targets
If we take the first cycle and overlay to 2015 cycle, it gave us the cycle top in 2021.
If we do the same for this cycle and overlay the 2015 cycle, we get a price target of 221k, which puts it at the top of my model in May 2025. Just discovered this—that’s one more point for May 2025.
As you can see, in the last two cycles it worked. Will it work this time? Who knows.
---
Pi Cycle Indicator
If we just run a rough projection on when the next cross will be, it crosses in April 2025, very close to May. Keep in mind this is a very rough idea of when it could cross.
---
Conclusion
We have 5 points in favor of May 2025, 4 points in favor of September 2025, and 2 points for March 2025. As always, the path is never clear for Bitcoin. Until we get much further down the road, I won’t conclusively know which date it will be.
This model I have been using has been so accurate thus far. We are so high up the last bands that we are most likely going to get some sort of long consolidation period with a correction soon, which would give the altcoin market a run.

$BTC Long long term Short Short term seems like its following VHi all how are we!? hope spirit are well stay strong!
This is update to my first of this idea the same idea I posted at the line it started. Its slowly moving to a LL Low low currently shaping a HL high low. When it swaps into a LH Low High that is confirmation of bullish sentiment between the LL nd HL. Basically a prime time to buy if other signals and analytics tell you to make a buy/long position. Never go of what I or anyone in Ideas say ALONE.. or reddit soil even Bloomberg or Forbes..
Anyway share your input o we can all learn more and grow as the Bitcoin Community!

Bitcoin Soars: January 3, 2025
Bitcoin has surged to an impressive **$102,870**, setting the stage for what could be a historic bull run! Experts predict it could hit **$120K by Q1** and even **$150K by mid-year**, driven by strong institutional interest and upcoming crypto policy shifts.
This is your moment to act! Whether you’re new to crypto or a seasoned trader, I’m here to help you maximize this opportunity.

Indo Count Industries: Stitching Together a Sustainable Future◉ Abstract
Indo Count Industries Ltd., a leading Indian home textile manufacturer, has reported significant growth, with FY24 revenue reaching ₹3,557 crore, an 18% increase year-over-year. Despite supply chain challenges and a decline in sales volume, the company remains optimistic about future growth, driven by strong demand and strategic initiatives. The company’s focus on sustainability and strategic acquisitions has further strengthened its position.
Currently trading at a P/E ratio of 20.3, below the industry average, Indo Count appears fairly valued. Increasing institutional interest indicates growing confidence in the company’s long-term potential. As Indo Count continues to prioritize operational efficiency and market expansion, its future growth prospects remain promising.
Read full analysis here.........
◉ Introduction
The US bed and bath linen market is projected to experience significant growth in the coming years. As of 2024, the market size is estimated at approximately $10.73 billion, with expectations to reach $13.14 billion by 2029, reflecting a compound annual growth rate (CAGR) of 4.14% during this period.
This growth is driven by several factors, including:
1.Increased Homeownership: Rising homeownership rates are boosting demand for essential bed and bath linens like sheets and towels.
2.Consumer Spending: Higher disposable incomes are leading to increased spending on home furnishings, including premium and luxury linen products.
3.Sustainability Trends: There is a growing consumer preference for eco-friendly and sustainable products, influencing purchasing decisions in the bed and bath linen segment.
The market is characterized by a low concentration of major players, indicating a competitive landscape with numerous brands catering to various consumer preferences.
◉ Major Players in the Industry
Several key players dominate the US bed and bath linen market:
1.Indo Count Industries Ltd.: As the largest manufacturer of home textile bed linens globally, Indo Count is a significant player in the US market, known for its extensive product range and commitment to sustainability.
2.Brooklinen: This brand offers modern and luxurious bedding products, appealing to consumers seeking comfort and style.
3.Peacock Alley: Known for its premium quality and craftsmanship, Peacock Alley focuses on high-end bed and bath linens.
4.Crane & Canopy: This company provides stylish yet affordable options for a wide range of consumers.
5.Tempur Sealy International, Inc.: A leading player in the bedding industry, known for its innovative mattress solutions that complement bed linen offerings.
6.American Textile Company: Offers a variety of bedding products with a focus on quality and comfort.
Today, we'll take an in-depth look at Indo count Industries, a prominent player in the US bed linen manufacturing sector, exploring its market positioning and competitive dynamics.
This detailed report undertakes a thorough evaluation of ICIL's technical capabilities and core business fundamentals.
◉ Company Overview
Indo Count Industries Limited NSE:ICIL , established in 1988, is a leading Indian home textile manufacturer. The company offers a diverse range of products, including bed sheets, fashion bedding, utility bedding, and institutional bedding. With showrooms in the UK and US, Indo Count sells its products under 17 distinct brands through multi-brand outlets, large format stores, and e-commerce platforms. Headquartered in Mumbai, India, the company exports its products globally.
◉ Market Capitalization - ₹ 6,288 Cr.
◉ Revenue Breakup (Location Wise)
➖ With a staggering 97.5% of its revenue generated from the US and UK markets, Indo Count Industries Limited has established itself as a prominent global player in the home textile industry.
➖ The remaining 2.5% of its revenue comes from domestic Indian sales.
◉ Challenges and Headwinds:
➖ Sales volume and revenue decline YoY due to supply chain issues, leading to higher inventory.
➖ Anticipated clearance of 2.5 million meters of deferred shipments in upcoming quarters.
➖ Revised EBITDA margin guidance: 15-16% due to upfront HR and brand promotion costs
◉ Margin Guidance and Future Outlook:
➖ Despite near-term challenges, Indo Count Industries Limited's management remains upbeat, fueled by a strong demand outlook and solid market positioning.
➖ Strategic investments in branded segments are expected to yield returns within the next four years, driving improved margin guidance.
➖ To further propel growth, the company is focused on enhancing operational efficiencies and scaling up operations in high-potential segments.
◉ CAPEX
➖ Indo Count Industries Limited has revised its FY25 capital expenditure (CAPEX) upwards to ₹413 crores, a significant increase from the initial estimate of ₹165 crores, driven by strategic acquisitions and investments.
◉ Strategic Acquisitions
➖ Recent acquisitions of Fluvitex Inc. and Modern Home Textiles, enhancing U.S. manufacturing footprint.
➖ Acquisitions strengthen presence in critical U.S. regions, expanding customer base without overlapping existing clientele.
◉ Technical Aspects
➖ Over a prolonged consolidation phase, the stock price developed a Cup & Handle pattern.
➖ Following a breakout, the stock surged sharply, hitting an all-time high near the 448 level.
➖ Nevertheless, it faced significant resistance and retraced to the previously established breakout level.
➖ Currently, the price is at a crucial point that could act as an important support zone.
➖ There is strong anticipation that the stock may rebound from this level and begin to rise again.
◉ Relative Strength
The chart reveals that Indo Count Industries Limited (ICIL) has lagged behind the Nifty Small Cap Index over the past year, generating a 12.7% return compared to the index's impressive 26.3%.
◉ Revenue & Profit Analysis
● Yearly
➖ Indo Count Industries Limited reported strong growth in Fiscal Year 2024, with revenue reaching ₹3,557 crore, an 18% increase from ₹3,012 crore in FY23.
➖ EBITDA surged to ₹562 crore, up from ₹455 crore, while the EBITDA margin improved to 16% from 15%.
● Quarterly
➖ In the quarter ending September, the company's revenue rose to ₹1,036 crore, a 10% increase from ₹941 crore in the previous quarter, slightly higher than ₹1,009 crore in the same quarter last year.
➖ EBITDA for the quarter increased to ₹157 crore, up from ₹145 crore in the previous quarter.
➖ However, diluted EPS (LTM) declined to ₹15.62 in September from ₹17.27 in June 2024.
◉ Valuation
● P/E Ratio
➖ The company's present price-to-earnings (PE) ratio stands at 20.3, lower than its 1-year median PE of 21.4.
➖ When we look at the industry average PE of 26, it indicates that the stock might be considered somewhat undervalued at this time.
● P/B Ratio
➖ ICIL's P/B ratio of 2.86 indicates considerable overvaluation compared to the industry average of 1.46.
● PEG Ratio
➖ A PEG ratio of 0.49 suggests that the stock is undervalued relative to its expected earnings growth.
● Intrinsic Value
➖ Indo Count Industries is currently trading at ₹307, which is nearly 1.1 times its intrinsic value of ₹279, indicating that the stock is fairly valued at this moment.
◉ Cash Flow Analysis
➖ The operating cash flow for Indo Count Industries Limited experienced a notable decline from ₹755 crore in FY23 to ₹146 crore in FY24. This decrease can be attributed to the strategic allocation of capital towards acquiring prominent brands, such as Wamsutta, as part of the company's expansion and growth initiatives.
◉ Debt Analysis
➖ ICIL's debt of ₹1,461 crore and debt-to-equity ratio of 0.66 indicate robust financial health. Furthermore, its impressive interest coverage ratio of 5.74 suggests the company is well-positioned to manage its debt obligations, ensuring greater financial flexibility and stability.
◉ Top Shareholders
➖ The promoters have maintained their 58.74% stake for the last two years.
➖ Foreign Institutional Investors (FIIs) have maintained their stakes since June, now holding 10.69%.
➖ Domestic Institutional Investors (DIIs) have continuously increasing their stakes from June 2023 and now holding 3.67%, significantly up from 2.16% from the June quarter.
➖ At the same time, retail investors have been consistently selling their shares over the past few quarters.
**Additionally, Mukul Mahabir Agarwal , a veteran investor, places a strategic bet on Indo Count Industries Limited, acquiring 1.17% of the company's shares, a move poised to reap rewards.
◉ Mutual Fund Exposure
➖ Indo Count Industries Limited witnessed increased institutional interest in October 2024, with thirteen funds holding 70 lakh shares, representing a 9.3% rise from September's 64.1 lakh.
◉ Conclusion
Based on our analysis of key technical and financial metrics, Indo Count Industries Limited's strategic focus on diversification, acquisitions, and premium products positions the company for sustained growth and long-term value creation.
We anticipate that this positive trajectory will be reflected in its stock price performance.
