TSLA Honey Ticking Bull Trap! UPDATE 1This is an updated chart, as I keep being prompted to reach "My Target" by TV.
No matter how bad things get for Elona and TSLA, there are always people who are willing to pile in and buy at any price. The problem is the chart is showing lower highs, as TSLA no longer attracts the people needed to boost price, just like TSLA the brand. As a result, people keep getting honey ticked.
Don't Get HONEY TICKED!
As I always say, never EVER!! Invest in toxic people like Elona. They always blow themselves up in the end. It's in their nature!
Click Boost, Follow, subscribe, and let's reach 5,000 followers. ;)
Investing

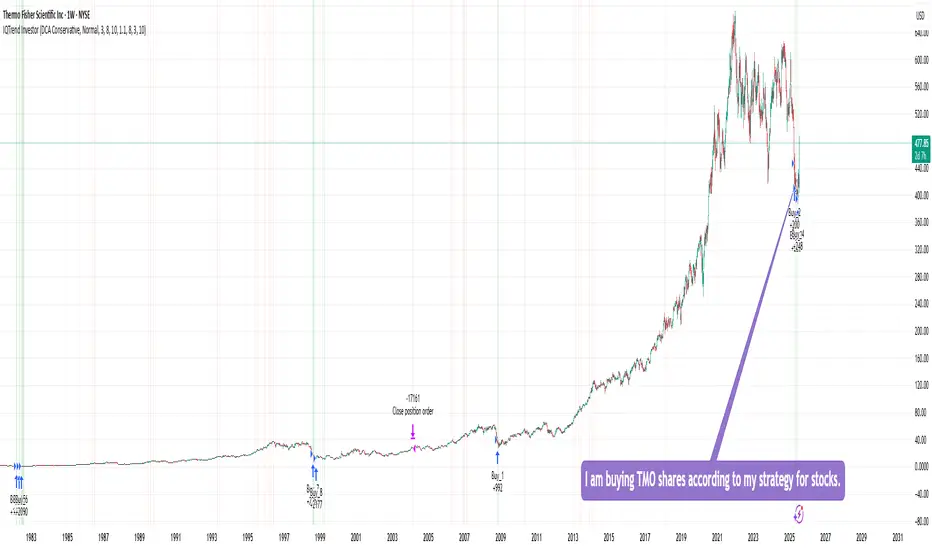
Buying TMO sharesI am buying TMO shares according to my strategy for stocks, ETFs, and precious metals.
This strategy shows 100% performance on this stock on a weekly timeframe. Therefore, I am investing a small percentage of my deposit in it and will wait for it to perform. I hope that everything will work out this time too :)
Of course, the price may go even lower, but I will buy more if the strategy shows a buy signal. In the long run, I think there will be an excellent profit.
DYOR
STOXX50: Still at good place for buysHello,
The Eurostocks 50 is in a bullish correction forming an expanding triangle pattern. We still see an opportunity for investors who missed the entry at the bottom of the correction to join the risk averse trade once we have a strong breakout of the corrective pattern. The STOXX50 is coming close to the moving average being a further confirmation that we are setting up for an upwards move.
To reinforce our bullish bias, the MACD is showing signs of a zero bullish crossover. We remain aligned with our target of Eur 5980 on this.
Disclosure: I am part of Trade Nation's Influencer program and receive a monthly fee for using their TradingView charts in my analysis.

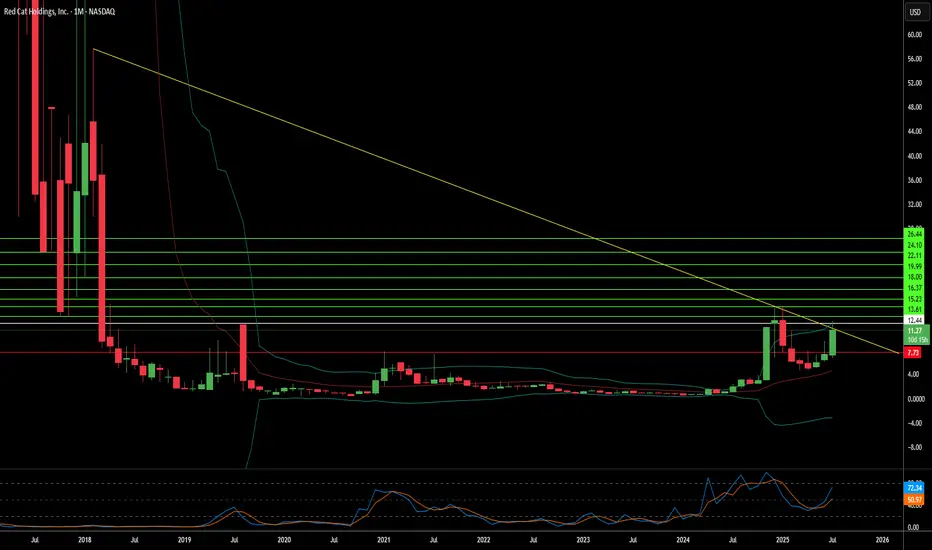
Is Red Cat Holdings a Drone Industry Maverick?Red Cat Holdings (NASDAQ: RCAT) navigates a high-stakes segment of the burgeoning drone market. Its subsidiary, Teal Drones, specializes in rugged, military-grade uncrewed aerial systems (UAS). This niche positioning has attracted significant attention, evidenced by contracts with the U.S. Army and U.S. Customs and Border Protection. Geopolitical tensions, particularly the escalating demand for advanced military drone capabilities, create a favorable backdrop for companies like Red Cat, which offer NDAA-compliant and Blue UAS-certified solutions. These certifications are critical, ensuring drones meet stringent U.S. defense and security standards, differentiating Red Cat from foreign competitors.
Despite its strategic positioning and significant contract wins, Red Cat faces considerable financial and operational challenges. The company currently operates at a loss, with a net loss of $23.1 million in Q1 2025 against modest revenues of $1.6 million. Its revenue projections of $80-$120 million for 2025 underscore the lumpy nature of government contracts. To bolster its capital, Red Cat completed a $30 million equity offering in April 2025. This financial volatility is compounded by an ongoing class action lawsuit. This lawsuit alleges misleading statements regarding the production capacity of its Salt Lake City facility and the value of its U.S. Army Short Range Reconnaissance (SRR) program contract.
The SRR contract, which could involve up to 5,880 Teal 2 systems over five years, represents a substantial opportunity. However, the lawsuit highlights a significant discrepancy, with allegations from short-seller Kerrisdale Capital suggesting a much lower annual budget allocation for the program compared to Red Cat's initially intimated "hundreds of millions to over a billion dollars." This legal challenge and the inherent risks of government funding cycles contribute to the stock's high volatility and elevated short interest, which recently exceeded 18%. For risk-tolerant investors, Red Cat presents a "moonshot" opportunity, contingent on its ability to convert contract wins into sustainable, scalable revenue and successfully navigate its legal and financial hurdles.
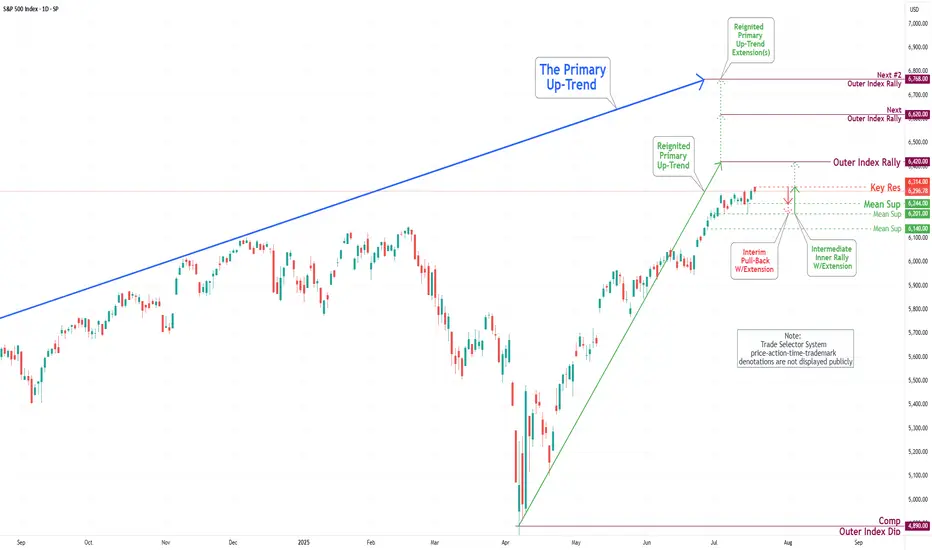
S&P 500 Daily Chart Analysis For Week of July 18, 2025Technical Analysis and Outlook:
During the current trading week, the S&P 500 Index has demonstrated a predominantly upward trajectory. It has successfully retested the Mean Support level at 6200 and established a new Key Resistance level at 6314. Currently, the index displays a bullish sentiment, with the objective for the Outer Index Rally set at 6420.
Nevertheless, it is essential to recognize that the current price action may result in a decline, potentially leading to a retest of the Mean Support at 6244 and extending to the Mean Support at 6201. Following this potential downward movement, it is anticipated that the index will resume its upward trend, driving the price action towards the Key Resistance level at 6314 and ultimately achieving the Outer Index Rally target of 6420.
EUR/USD Daily Chart Analysis For Week of July 18, 2025Technical Analysis and Outlook:
In the current trading session, the Euro has continued its decline, completing our Mean Support level of 1.160. Recent analyses indicate that the Euro is likely to experience a sustained downward trend, with an anticipated retest at the Mean Support level of 1.159 and a possible further decline to reach a Currency Dip of 1.152. Nevertheless, it is crucial to consider the potential for a dead-cat bounce toward the Mean Resistance level of 1.167, which could trigger a significant reversal of the downtrend and target a Currency Dip of 1.152.

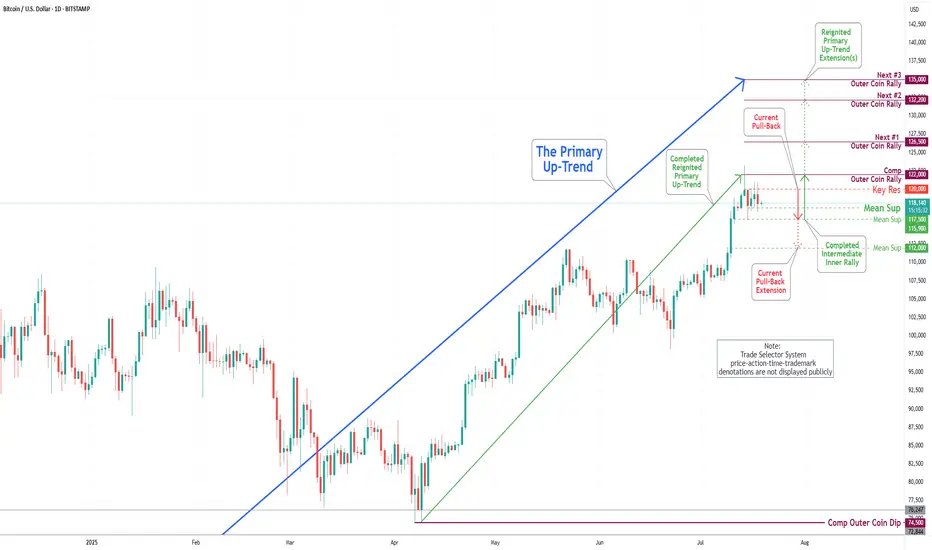
Bitcoin(BTC/USD) Daily Chart Analysis For Week of July 18, 2025Technical Analysis and Outlook:
In last week's trading session, we achieved a new historical high by completing our Outer Coin Rally at 122000. Following this milestone, the coin retraced, as expected, to the newly established Mean Support at 115900 and is currently trading at the Intermediate Mean Support at 117500. Presently, the coin is set to retest the Mean Support at 115900, with the potential for a further pullback to the Mean Support at 112000. This anticipated decline will necessitate a retest for the completed Outer Coin Rally at 122000. The designated targets for the renewed Primary Up-Trend are 126500, 132200, and 135000.
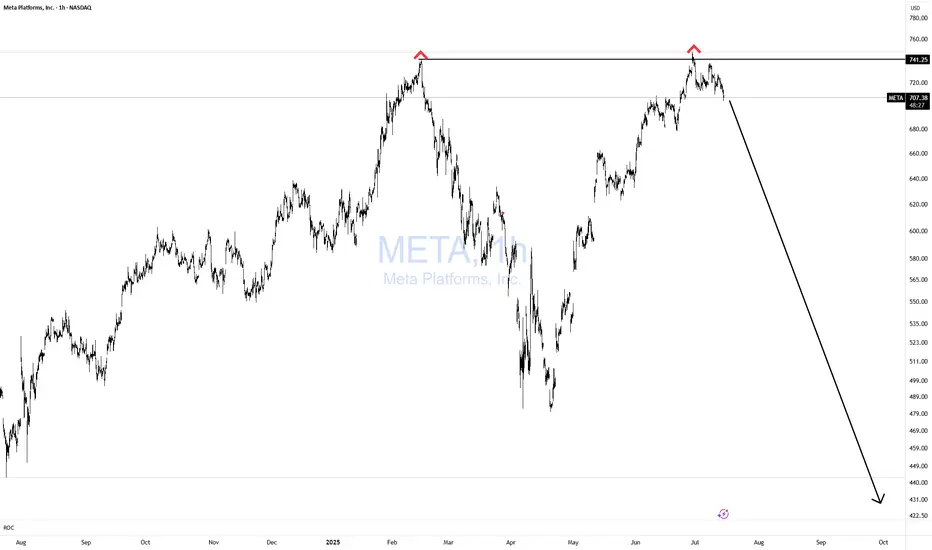
META Double Topping!Does it get any easier than this? NOPE!
If you can't spot this pattern from 1000 miles away, then you need a lot more time in the seat, training yourself in TA.
Simple with great risk reward!
Bulls GTFO!
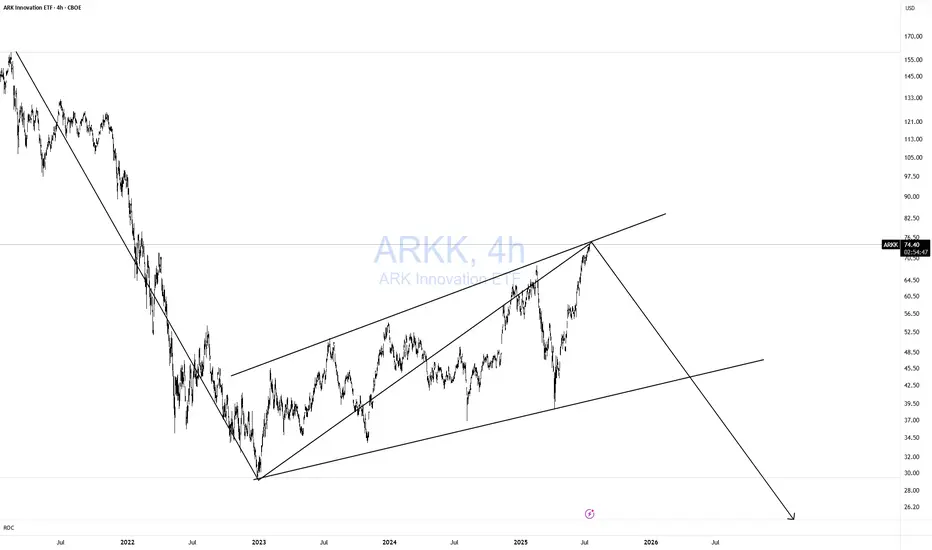
ARKK DOOMED!Classic 123 wave move down! As I like to say Short when no one else is looking! Not when everyone is looking. TOO LATE!
Simple but very effective pattern with excellent risk-reward. Remember, I am a macro trader, so don't expect to see a return on this investment tomorrow.
I won't get into the macro stuff.
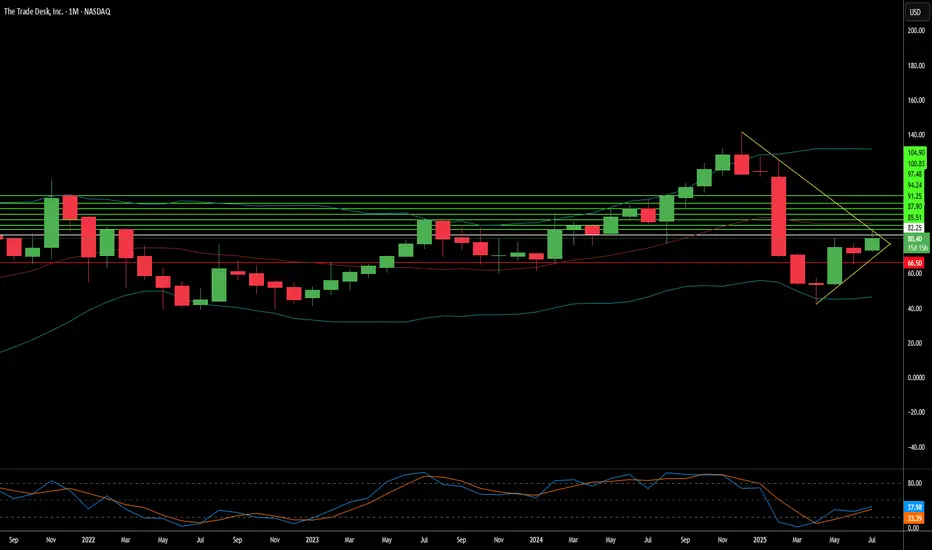
The Trade Desk: Why the Sudden Surge?The Trade Desk (TTD) recently experienced a significant stock surge. This rise stems from both immediate market catalysts and robust underlying business fundamentals. A primary driver was its inclusion in the prestigious S&P 500 index, replacing Ansys Inc. This move, effective July 18, immediately triggered mandated buying from index funds and ETFs. Such inclusion validates TTD's market importance and enhances its visibility and liquidity. This artificial demand floor, coupled with TTD's $37 billion market capitalization, underscores its growing influence within the financial landscape.
Beyond index inclusion, TTD benefits from a significant structural shift in advertising. Programmatic advertising is rapidly replacing traditional media buying, expected to account for nearly 90% of digital display ad spending by 2025. This growth is driven by advertisers' need for transparent ROI, publishers avoiding "walled gardens" through platforms like TTD's OpenPath, and AI-driven innovation. TTD's AI platform, Kokai, greatly lowers acquisition costs and enhances reach, resulting in over 95% client retention. Strategic partnerships in high-growth areas like Connected TV (CTV) further reinforce TTD's leadership.
Financially, The Trade Desk demonstrates remarkable resilience and growth. Its Q2 2025 revenue growth of 17% outpaces the broader programmatic market. Adjusted EBITDA margins hit 38%, reflecting strong operational efficiency. While TTD trades at a premium valuation - over 13x 2025 sales targets-its high profitability, substantial cash flow, and historical investor returns support this. Despite intense competition and regulatory scrutiny, TTD's consistent market share gains and strategic positioning in an expanding digital ad market make it a compelling long-term investment.
S&P 500 Daily Chart Analysis For Week of July 11, 2025Technical Analysis and Outlook:
During this trading week, the S&P 500 Index has shown a predominantly downward/upward course of action and created a new Key Resistance at 6280. Currently, the index exhibits a bullish bias, with the Outer Index Rally objective set at 6420. However, it is crucial to note that the current price action may cause prices to see in a new light from their current fluctuation to push toward the Mean Support at 6200 before resuming their upward movement.

EUR/USD Daily Chart Analysis For Week of July 11, 2025Technical Analysis and Outlook:
In this week's trading session, as expected, the Euro continued its decline, reaching our Mean Support level of 1.168. Recent analyses suggest that the Euro is likely to experience a further downward trend, with the next target set at the Mean Support level of 1.160. However, it's essential to consider the possibility of a rebound toward the Key Resistance level of 1.181, which could lead to the completion of an Outer Currency Rally reaching 1.187.

Bitcoin(BTC/USD) Daily Chart Analysis For Week of July 11, 2025Technical Analysis and Outlook:
In the last week's trading session, Bitcoin has demonstrated a significant surge, achieving historical prices as anticipated by TSS for an extended period. The cryptocurrency has successfully completed both the Outer Coin Rally 114500 and the Inner Coin Rally 118200. Presently, Bitcoin is poised to celebrate this notable accomplishment with a victory lap, but it may face a potential downward trajectory, targeting the Mean Support level of 112000. This anticipated decline will necessitate the resilience to a retest of Inner Coin Rally 118200. The designated targets for the Outer Coin Rally at this juncture are 122000, 126500, 132200, and 135000.

$ETH - See you later!CRYPTOCAP:ETH - See you later!
CupnHandle breakout
Volume gap up to $3400
Cupnhandle MM up to $4400+

Royal Gold (RGLD) Poised for Growth with $3.5B Sandstorm Acq.🚀 **Royal Gold (RGLD) Poised for Growth with $3.5B Sandstorm Acquisition!** 🥇
Royal Gold ( NASDAQ:RGLD ) is making waves with its $3.5B all-stock acquisition of Sandstorm Gold ( NYSE:SAND ) and a $196M cash buyout of Horizon Copper, announced July 7, 2025. Here’s why this could be a game-changer for investors! 📈
**🔥 Financial Highlights:**
- **Q2 2025 Performance**: Sold 40,600 GEOs at $3,248/oz gold, $32.91/oz silver, with an impressive 87% gross margin. $11.1B market cap reflects strength. 💰
- **Acquisition Impact**: Sandstorm deal adds 40 producing assets, boosting 2025 GEO production by 26%. Expect revenue & earnings growth post-Q4 2025 close. 🚀
- **Dividend Confidence**: Declared $0.45/share Q3 dividend, signaling robust cash flows. 💸
**📊 Sector Edge & Valuation**:
- **Undervalued?** Compared to Wheaton ($56B) & Franco-Nevada ($44B), Royal Gold’s lower valuation (per RBC Capital) could signal a bargain. Post-deal scale (75% gold revenue) may close the gap. 📉
- **Performance**: Sandstorm’s record Q1 2025 results + Royal Gold’s aggressive expansion outpace peers in growth potential. 🚀
**⚠️ Risks to Watch**:
- 6%–8.5% stock dip post-announcement reflects dilution fears (~19M new shares). 📉
- Commodity price volatility & regulatory approvals (due Q4 2025) pose risks. ⚖️
**🎯 SWOT Snapshot**:
- **Strengths**: Enhanced portfolio, 87% margins, leading North American royalty player.
- **Opportunities**: Analyst optimism (BMO $197 target) & copper exposure via Horizon.
- **Weaknesses**: Short-term dilution concerns.
- **Threats**: Commodity price swings, peer competition.
**💡 Why Buy Now?**
Royal Gold’s stock dip could be a buying opportunity, with analysts like BMO ($197 target) and unusual options activity signaling confidence. If precious metals stay hot ($3,342.80/oz gold futures), RGLD’s diversified portfolio could shine! 🌟
📅 **Deal Close**: Q4 2025, pending approvals.
🔎 **Dive Deeper**: Check Royal Gold’s IR page or Yahoo Finance for details.
What’s your take on NASDAQ:RGLD ’s big move? Bullish or cautious? 🐂🐻 #StockMarket #Gold #Investing

Can Ondas Holdings Redefine Defense Tech Investment?Ondas Holdings (NASDAQ: ONDS) is carving a distinct path in the evolving defense technology landscape, strategically positioning itself amid escalating global tensions and the modernization of warfare. The company’s rise stems from a synergistic approach, combining innovative autonomous drone and private wireless network solutions with shrewd financial maneuvers. A pivotal partnership with Klear, a financial technology firm, provides Ondas and its growing ecosystem with non-dilutive working capital. This off-balance-sheet financing mechanism is crucial, enabling rapid expansion and strategic acquisitions within the capital-intensive defense, homeland security, and critical infrastructure sectors without shareholder dilution.
Furthermore, Ondas's American Robotics subsidiary, a leader in FAA Type Certified autonomous drones, recently cemented a strategic manufacturing and supply chain partnership with Detroit Manufacturing Systems (DMS). This collaboration leverages U.S.-based production to enhance scalability, efficiency, and resilience in delivering American Robotics' advanced drone platforms. This domestic manufacturing focus aligns seamlessly with initiatives like the "Unleashing American Drone Dominance" executive order, which aims to bolster the U.S. drone industry, fostering innovation while safeguarding national security against foreign competition.
The company's offerings directly address the paradigm shift in modern warfare. Ondas's private industrial wireless networks (FullMAX) provide critical secure communication for C4ISR and battlefield operations, while its autonomous drone solutions (like the Optimus System and Iron Drone Raider for counter-UAS) are integral to evolving surveillance, reconnaissance, and combat strategies. As geopolitical instabilities intensify, driving unprecedented demand for advanced defense capabilities, Ondas’s integrated operational and financial platform is primed for significant growth, attracting considerable investor interest with its innovative approach to capital deployment and technological advancement.

$SOFI - Just getting started!NASDAQ:SOFI - Just getting started!
Monthly CupnHandle Breakout
Looks like we will push into new ATH's this year.
Targets: $23.73/ $28.18/ $32.57

Nike Looks Ready — A Smart Time to Consider InvestingOn the monthly chart, NIKE has been in a downtrend since November 2021, but the signs are pointing toward a potential trend reversal. Here's why I believe the bottom may already be in:
✅ MACD Histogram shows a strong positive divergence, signaling weakening bearish momentum.
✅ The RSI downtrend line has been broken and successfully retested, confirming bullish strength.
✅ A clear hammer candle has formed at a historical wide support zone, showing strong demand.
Now, price is facing three consecutive resistance levels — and with each breakout, the next zone becomes the new target, (87.5 → 102 → 122).
The structure suggests a step-by-step move higher if momentum holds. Keep an eye on the breakout above the descending trendline — that’s where things could accelerate.

Howmet Aerospace: Navigating Geopolitics to New Heights?Howmet Aerospace (HWM) has emerged as a formidable player in the aerospace sector, demonstrating exceptional resilience and growth amidst global uncertainties. The company's robust performance, marked by record revenues and significant earnings per share increases, stems from dual tailwinds: surging demand in commercial aerospace and heightened global defense spending. Howmet's diversified portfolio, which includes advanced engine components, fasteners, and forged wheels, positions it uniquely to capitalize on these trends. Its strategic focus on lightweight, high-performance parts for fuel-efficient aircraft like the Boeing 787 and Airbus A320neo, alongside critical components for defense programs such as the F-35 fighter jet, underpins its premium market valuation and investor confidence.
The company's trajectory is deeply intertwined with the prevailing geopolitical landscape. Escalating international rivalries, particularly between the U.S. and China, coupled with regional conflicts, are driving an unprecedented surge in global military expenditures. European defense budgets are expanding significantly, fueled by the conflict in Ukraine and broader security concerns, leading to increased demand for advanced military hardware incorporating Howmet’s specialized components. Simultaneously, while commercial aviation navigates challenges like airspace restrictions and volatile fuel costs, the imperative for fuel-efficient aircraft, driven by both environmental regulations and economic realities, solidifies Howmet’s role in the industry’s strategic evolution.
Howmet's success also reflects its adept navigation of complex geostrategic challenges, including trade protectionism. The company has proactively addressed potential tariff impacts, demonstrating a capacity to mitigate risks through strategic clauses and renegotiation, thereby protecting its supply chain and operational efficiency. Despite its premium valuation, Howmet’s strong fundamentals, disciplined capital allocation, and commitment to shareholder returns highlight its financial health. The company's innovative solutions, crucial for enhancing the performance and cost-effectiveness of next-generation aircraft, solidify its integral position within the global aerospace and defense ecosystem, making it a compelling consideration for discerning investors.

Bitcoin(BTC/USD) Daily Chart Analysis For Week of July 4, 2025Technical Analysis and Outlook:
During this week's trading session, Bitcoin rebounded from our Mean Support level of 104900 and, with significant momentum, subsequently completing the Mean Resistance level of 110300. Currently, the cryptocurrency is poised for a continuation of its downward trajectory, with a target set at the Mean Support level of 105500. This downward trend may necessitate heightened resilience to address the Key Resistance point at 111700 and the emerging historical price action of the Outer Coin Rally at 114500 and beyond. Nonetheless, it remains essential to acknowledge the possibility that current prices may experience an uptick from this juncture, bolstering the rally mentioned above.

EUR/USD Daily Chart Analysis For Week of July 4, 2025Technical Analysis and Outlook:
During the trading session this week, we witnessed the successful completion of the Outer Currency Rally at a level of 1.177. Recent analyses suggest that the Euro is likely to encounter a downward trend, with an initial target set at the Mean Support level of 1.168 and a potential extension to an additional Mean Support of 1.160. Nevertheless, it is crucial to acknowledge the possibility of a subsequent increase toward the next Outer Currency Rally level of 1.187 before any definitive downward movement transpires.

S&P 500 Daily Chart Analysis For Week of July 3, 2025Technical Analysis and Outlook:
During this abbreviated trading week, the S&P 500 Index has primarily shown an upward course, hitting and surpassing our target for the Outer Index Rally of 6235. Currently, the index demonstrates a consistent bullish trend, with the following objective for the Outer Index Rally set at 6420, followed by forthcoming targets of 6620 and 6768. Nevertheless, it is crucial to acknowledge the current price action may cause prices to retrace from their current fluctuation to test the Mean Support at 6200 before resuming their upward movement.

$AMSC - Small Cap Semi with 100% Upside!NASDAQ:AMSC - Could be the next $NVTS...👀
✅ Cup&Handle breakout
✅ Bullish H5 Indictor
✅ Bullish Flow
✅ Volume shelf launch
Only a 1.7B Market cap too! 😱
