NVTS - 300% Move back on the table!💾 NASDAQ:NVTS Trade Alert! 💾
Locked & Reloaded 🔫
▫️ Falling Wedge B/O
▫️ Green H5 Indicator
▫️ Volume Shelf
▫️ BULLISH WCB
▫️ Above 9ema & Smoothing Line
🎯 $4.65
🎯 $6.00
🎯 $7.62
🎯 $11.17
🎯 $12
Not financial advice!
Investing

CAT: Will be a beneficiary of disastersNYSE:CAT - SWING TRADE:
Sadly after the flooding in NC, the fires in CA, and hurricanes a lot needs rebuilt. Leading to CAT to profit from the destruction. Also, pullback and recession proof for the most part. Safe swing that could turn into a long play.
-Falling Wedge breakout
-Green H5 Indicator about to cross through smoothing line
-Volume shelf launch
-Wr% running into red barrier, will wait for that to peel off and stay in until H5 indicator or WCB breaks after it creates support.
3 SOLID PROFIT TARGETS!
Not financial advice

Key Elements in Trading & Investing ManagementKey Elements in Trading & Investing Management: Your Blueprint for Success 📊
🔍 Risk/Reward Analysis:
Every trade or investment should start with a thorough risk/reward assessment. This ensures you're not just chasing gains but are aware of the potential downside.
🎯 Clear Entry & Exit Strategies:
Define your entry and exit points before you trade. This discipline keeps your strategy on track, whether the market moves in your favor or against it.
🏞️ Embrace Market Volatility:
Accept drawdowns as part of the trading journey. Just as you'd celebrate profits, handle losses with the same composure to maintain your strategic approach.
🔄 Consistency in Strategy:
Avoid tweaking your strategy after a loss. Stick to your rules to foster a consistent trading methodology.
🔧 Utilize All Available Tools:
Leverage every tool at your disposal on platforms like TradingView—indicators, charts, and risk management features—to make informed decisions.
🎯 Set Profit Targets & Stop Losses:
Implement break-even points and stop-loss orders to secure profits and minimize losses, ensuring each trade is managed with precision.
💰 Focus on Capital Preservation:
Your primary goal should be to protect and grow your capital, not just to celebrate short-term wins. Long-term sustainability is key.
📈 Compound Your Success:
Use your gains wisely to compound your investments rather than risking them on speculative bets. Let your edge work for you over time.
🌟 Master Your Trading Edge:
Identify what gives you an advantage in the market, be it technical analysis, fundamental insights, or a unique approach, and harness it consistently.
💵 Implement Dollar Cost Averaging for Stability:Dollar Cost Averaging (DCA) is your ally for those looking to invest without timing the market. By investing a fixed amount at regular intervals, you buy more shares when prices are low 📉 and fewer when prices are high 📈, averaging out the cost over time. This strategy mitigates the impact of volatility 🌪️ and reduces the risk of investing a lump sum at a peak price.
Consistent Investment: Set up a schedule to invest, say, weekly or monthly, into your chosen assets. 🗓️
Emotional Discipline: DCA helps remove emotion from investing decisions, promoting a disciplined approach. 😌
Long-Term Growth: Over time, this method can lead to significant returns as you accumulate more shares at varied price points. 🌱📈
Incorporate DCA into your broader strategy to enhance your risk/reward balance, ensuring that you're not just reacting to market highs and lows but methodically building your investment base. 💡

UNH - Took the GREEN PILL! 15% Move Inbound!NYSE:UNH 💊
H5_Swing Trade:
Playing small with one $560 Call heading into earnings. Fundamentally undervalued and beaten down stock since their CEO was murdered.
Good earnings and the fact they are a safety play make me really like this play.
H5 Trade and WCB look great too!
🎯$623
⏳Before March
Not financial advice

Bull Market is about to Flip to Bear Market!AMEX:SPY
SO EASY A CAVEMAN CAN DO IT! 🤷♂️
It's the same thing on the NASDAQ:QQQ too
If we hold this month outside this WCB, it's over!❌
Not financial advice

$GLD - GOT GOLD?!AMEX:GLD - GOT GOLD?!
Day/ Week/ Month all breaking out!
- Green H5 Indicator
- Two symmetrical triangle breaking out
- Daily WCB thriving
- Launching off volume shelf
- Safe haven when FUD hits
All pointing to measured move: $268 🎯
Not financial advice

JP Morgan (JPM): Correction on the HorizonJP Morgan ( NYSE:JPM ) is back on our radar as the upcoming earnings season begins, with the banking sector leading the reports. We’ve analyzed JP Morgan before, and the current setup offers intriguing opportunities. Since 2023, the stock has maintained a steady upward trend that continues into 2024.
Currently, NYSE:JPM appears to be in sub-wave ((iii)) within the larger wave (3) or possibly wave 5. However, we anticipate that sub-wave ((iv)) correction is yet to occur, aligning with the broader structural narrative of the chart.
Presently, the stock is trading near a critical trendline originating from the top of sub-wave ((i)). This trendline, which has shifted from resistance to support after multiple touchpoints, now risks being broken. Should it fail, the price could fall from its current level of $243 into a range between $204 and $173. A drop to $173 would represent the maximum correction in our view, while a more realistic pullback would fall within the $204 to $188 range.
On the bullish side, the wave 5 could push up to approximately $260, a modest increase from the current price. This scenario fits within the Elliott Wave framework, anticipating a wave ((iv)) correction before the final upward moves to complete wave 5 and the larger wave (3).

Bitcoins Next Move will be HUGE!The markets have pulled back to pre-election areas, will Bitcoin meet the same fate?!
CRYPTOCAP:BTC - Bitcoin
- Bearish Expanding Triangle
- Red H5 Indicator
- Volume shelf with Volume GAP
- Right at the bottom of the box: Either a huge bounce or a huge breakdown
Not financial advice

S&P 500 Daily Chart Analysis For Week of Jan 10, 2025Technical Analysis and Outlook:
During the recent trading session, the S&P 500 demonstrated a robust rally, exceeding a notable support level at 5872. This upward movement, however, resulted in a significant decline of the index to a critical support level at 5870 and lower lows. The volatility associated with this upward trend has introduced instability by destabilizing the bullish trend by flagging a new downward target marked at Outer Index Dip 5645. However, it is crucial to acknowledge that encountering subsequent support levels of Mean Sup 5770 may trigger a substantial rally, potentially leading to the Mean Res at 5920, before plunging again to drop toward the targeted level of 5645.

EUR/USD Daily Chart Analysis For Week of Jan 10, 2025Technical Analysis and Outlook:
The Eurodollar has experienced a significant increase during this week's trading session, surpassing our initial target of Mean Resistance at 1.034. It then encountered strong resistance at a Mean Resistance of 1.043, leading to a notable pullback that brought it down to an Outer Currency Dip of 1.025 and lower. We are now looking at the next target at Outer Currency Dip 1.020, with additional extension levels at Outer Currency Dip 1.016 and 1.005, respectively. Reaching our first target, Outer Currency Dip 1.025, will likely trigger an interim rebound toward the designated level at Mean Resistance 1.030.

Bitcoin(BTC/USD) Daily Chart Analysis For Week of Jan 10, 2025Technical Analysis and Outlook:
Bitcoin has surpassed our crucial Mean Resistance of 99500 in this week's trading session by plunging sharply back to a critical Mean Support of 91800. This decline suggests that a significant interim pullback may be underway, potentially bringing the cryptocurrency to the Outer Coin Dip 83400 before any resurgence in the bull market occurs. However, an interim strong upside move to Mean Res 97300 might be in the works.

SPY H&S is breaking. The market may have just flipped!H&S Broke it's neckline and the overall $580 Support.
We are seeing this break of support across the NASDAQ:QQQ AMEX:IWM as well.
This is all leading me to believe strongly that we are now in a crash or correction in these markets. I personally sold out of all my TRADES and am HOLDING and DCAing in all my INVESTMENTS.
The difference here is my Trades where to the upside and with the markets telling us where we are most likely heading now I am not staying in trades to find out if it will be for 5% or more to the downside from here as this would lead to all long trades getting pulled to the depths of hell.
There are no certainties, and before, based on what I was seeing, I said I believed we would bounce and hold this area (Which could still be the case), but all reasoning behind that has been ruptured, and I have nothing left to believe in that besides small criteria.
To be a good or profitable trader, you need to be not stubborn, follow a set trading strategy, and be reactive to the markets and what they are telling us—not go against the overall trend! All we have are charts and indicators to help us make our best assumptions of what will happen. More criteria pointing in one direction is the way you have to assume we will go...well we went from pointing up and for an imminent bounce to most criteria pointing down for what will either be one of the biggest fake outs ever's or a correction/ crash in the markets after a massive 2 year bull run. Only time will tell at this point, but I wanted to make this post to inform everyone here about what I personally did and what I'm seeing.
I DID TALK ABOUT A CORRECTION/ CRASH THIS YEAR IN THE MARKETS IN MY 2025 PREVIEW BUT SAID SECOND HALF AND THAT WAS MY BEST GUESS...
As always this is NOT FINANCIAL ADVICE and NEVER WILL BE!
Everyone needs to play their own book and make their own ADULT decisions.

NVTS TRADE UPDATE - Massive upside potential...STILL!NASDAQ:NVTS UPDATE 💾
The H5 Trade is still intact...for now. We are at an inflection point in the markets and although I believe we get a big bounce higher soon nothing is concrete.
If we do get a bounce and what I believe will be a blow off top in this bull market then this name base on the setup will do very well to start blasting through these profit targets.
- H5 indicator is green
- At volume shelf
- Higher low
- Already successfully retested falling wedge breakout area.
- Broke out of downtrend
-Volume gap to fill
-WCB is formed and thriving
When companies break out and successfully retest it is common for them to consolidate above the breakout area to create new support before continuing higher
Don't make buy/ sell decisions based solely off price action, have a strategy and follow it so you don't get burned up in the massive swings...especially on volatile stocks. This name has given me 70% gains off the initial breakout and after we loaded back up off the retest.
Not exiting this name unless my strategy indicates a correction or crash in the markets is upon us or my strategy tells me to exit this name (Red H5 Indicator/ Break of support on WCB).
NOT FINANCIAL ADVICE

MOBILEYE - A Merger & Acquisitions target! Downside limitedNASDAQ:MBLY - M&A Target 🎯🚘
Here's my thoughts of what I believe to be limited downside on Mobileye with my thesis that they could be a prime M&A target for a slew of Mega-Cap companies with the new administration pegged to be more lax in this area of business. More details in this post. 👇
I personally love Mobileye - NASDAQ:MBLY as a fundamentally undervalued company with great tech. I believe its a great investment with great technicals as well.
My thesis is that the downside is limited at this point due to this M&A realm we are about to step into here shortly.
Jensen just clarified what I had already perceived to be true which is the AV and Robotaxi market is a multi-trillion TAM over the next decade. These words alone increase any M&A price targets of any company in this space to include a robust Top 3 player such as $MBLY.
They currently sit at a 13.75B Mkt Cap after the massive 25% flush the last two days due to no new news. Not actually based off of fundamentals or the technology.
I would put a MINIMUM M&A target on this name of 15B and Maximum of 30B IMO.
A lot of big tech getting into this space and are way behind the Top 3 players in this realm of Mobileye/ NASDAQ:TSLA / NASDAQ:GOOGL (Waymo). It's obvious who would get gobbled up by a deal that is too good to resist which I believe personally is north of 20B as they are already on a solid path forward with headwinds turning into tailwinds (interest rates/ inflation/ china recovery/ auto-market recovery)
My personal theory of the companies most likely to take their shot are as follows in order:
NASDAQ:QCOM - Big chip player who is partnered with majority of legacy car brands. (Did a write-up in the past when they were thinking of acquiring/ merging with Intel in which own 80% share in Mobileye)
NASDAQ:NVDA - Announced there ambitions in this sector and have already been working within it. They've recently lost Hyundai though which tells me they aren't so close to having solid breakthroughs. But I believe they have the money and will to throw at M&A and take short-cut.
NASDAQ:GOOGL - Their robotaxis use very expensive lidars and I could see them make this purchase to get Mobileyes much cheaper technology that can be fitted to cars a lot simpler and with a cheaper price tag.
Others that I'm less confident on but have the money and could become a player: NASDAQ:META $APPL NASDAQ:AMZN
Great post Za! I hope I was able to add something for any Mobileye investors/ traders. Have a great market day off friend.
Not financial advice.

MOBILEYE DD - A COMPLETE UPDATE!It's been a tough two days with getting ZERO news at CES2025. Mobileye has reported news here every year for the past couple of events. Thus, no news was devastating while pouring colder water on the situation with Riskier names falling like a knife, the market overall condition being unclear, FUD setting in the markets, and people being scared of an NASDAQ:NVDA competitor. It was an avalanche of multiple criteria, all of which weren't the potential Honda deal I spoke about. Which I was wrong on and I'll admit that, but all I was doing was taking all data in front of me and created a thesis were I truly saw it happening, it didn't, oh well. My initial technical or fundamental investment thesis didn't include Honda anywhere in it when I started researching and investing in this company many months ago! I share IDEAS HERE, NOT FINANCIAL ADVICE! Only the fact that there was no deal announced at all. The CEO in a recent Bloomberg interview identified the reason the stock was falling but said:
"We are not ready with announcements, I think we'll have major announcements throughout the year but we're not ready yet" Amnon Shashua - Mobileye CEO
I don't see the NVDA news as a bad thing and people don't understand that they already had this sector of their business up and running. In which Hyunda just left them and are looking for a different supplier of AV technology. Also, Nvidia called this a multi-trillion-dollar market and validated everything I already knew. Which is this sector is going to be a massive investment opportunity. Mobileye is still Top 3 in Autonomous vehicle technology alongside Waymo and Tesla. NVDA is nowhere to be found in that conversation, and the same is to be said about AMZN, who also is in this space. It's the same thing when AMZN got into the pharma delivery market and everyone sold off HIMS to turn around and be right back in stock price in a few weeks.
These large companies do certain things really well, but they try to have their hands in too many cookie jars at once and don't invest the attention and necessary manpower to make them the best they could be or even competitive to smaller companies whose only business is in said sector!
This is 60% and investment for me and 40% trade. I'm in this for the most part, the long haul. I will only sell my 40% trade allocated position when we hit our profit targets or my strategy tells me to exit. Which leads us to the charts.
Weekly: (Chart Shown)
-H5 Indicator is still Green
-We are at a Volume shelf
-At the smoothing line (yellow) to the 9ema
-We have further support from the 25MA
-We have this DIP BUY BOX that I've called out in the past multiple time in which we've built up this area of support from all the back and forth and volume within this box.
-We had a one week red candle the like we've only seen a couple other times when things were a lot worse and unknown before earnings or when they lowered rev. guidance (THINGS ARE A LOT BETTER NOW THAN THEY WERE THEN! WE JUST DIDN'T GET NEWS YET! THATS IT!) Typically the week or weeks after we get these massive amount of sell volume we get a bounce back week or weeks.
-Finally, this name still to my knowledge pending new data has a 23% SHORT FLOAT and as such this trade of a short squeeze and parabolic move is very much still on the table!
Daily Chart:
-At the same big S?R zone
-Same large volume shelf
-In my eyes taking a breather and collecting/ rallying the troops before another run at $23
-Most importantly, when we smashed into the red barrier of the Williams percentage range (Wr%) and the 50MA on the daily and 100MA on the weekly, we rejected hard. Do we get the same bounce move when we are running into the Wr% GREEN bounce support beam? While also being extremely oversold on timeframes under the daily timeframe. Finally, being right at the volume shelf, 50MA that already did a bullish cross of the 100MA!
- We are still in an uptrend!
The fundamentals haven't changed, and based on my investing spreadsheet, which is mostly a DCF model, it's still a $30+ stock!
- Headwinds are still becoming tailwinds (Falling interest rates/ inflation, China recovering, Auto market recovering)
NOTHING HAS CHANGED BUT THE PRICE OF A STOCK TICKER!
The haters can honestly kick rocks until they realize they are in control of their own financial decisions and can THEN come back, understand this game and learn! Some said I owed them an update, which I laughed at as I DON'T OWN YOU ANYTHING! The ideas I post here are FREE, and I'm paying to be on this service, just as some of you are! Some of you really need to look in the mirror and self-reflect. I'll still help you, too, friend; I don't like to hold hate in my heart for anyone; it's unhealthy!
I'll never let the haters win or get me down! I will continue to do me with this stock and post my ideas for all of the people out there that have learned and appreciate my work! Too many great people out there that truly want to learn and become better and I will help them do that EVERY STEP OF THE WAY!
So, here is my DD Mobileye Technical and Fundamental update for all my amazing followers who aren't TOXIC! I LOVE YOU!
AS ALWAYS, NOT FINANCIAL ADVICE!

$NVTS - A Free 140% anyone?NASDAQ:NVTS
A free H5 Trade that ran 70% on the breakout and again after the pullback to retest said breakout!
That's 140% in gains in ONE MONTH!!!! 😘
We call that a DOUBLE TROUBLE Target Smash!!!
$4.65 🎯🎯🏹🏹
Not financial advice

Coca-Cola (KO): Is Risk-to-Reward Favorable Now?We have been filled on our second entry on $KO.
Coca-Cola is now back trading within its range, and with the first bullish divergence on the RSI appearing, we believe that despite the current weak chart structure, the risk-to-reward ratio and dividend yield make this a worthwhile opportunity.
As a traditionally slow-moving stock, Coca-Cola could gain some momentum if market focus shifts back from risk-on assets to safer, dividend-yielding stocks like $KO. This transition could provide the stock with room to grow.
Key to the next move will be reclaiming the resistance at $65.14. As long as $59 holds as support, we remain optimistic. With our stop loss in place, this trade remains secure, and we are well-positioned for any developments.
We are also working on improving how past analyzed assets are displayed for easier tracking. 🫡

[Education] Why You Can't Break Free From Get-Rich-Quick TrapYou already know the get-rich-quick mindset is killing your trading career. You read the books. You understand that consistent profits come from proper risk management and patience. Yet somehow, you still find yourself hoping for that one trade that will change everything.
I understand that feeling. I spent 5 years trapped in this cycle. Let me share something embarrassing. I was previously managing a $200,000 funded account. My strategy was making a consistent 1-2% monthly. I got greedy. I saw a "perfect" setup and decided to risk 5% instead of my usual 1%. "Just this once. This setup is different.”
That one decision wiped out my profits and I lost that account in a single trade.
The Psychology Behind Our Self-Sabotage
Here's what makes this mindset so dangerous. We can intellectually understand it's wrong while emotionally believing we're the exception. It's like knowing fast food is unhealthy but convincing yourself that this one burger won't hurt.
The truth is our brain is wired for quick rewards. Whenever we see those trading “gurus” posting screenshots of their profits, or a picture of them partying, driving sports car, and flying first class, we can sense that they are fake. However, our emotional brain lights up with possibility. "What if it's real? What if we're missing out?"
This creates an internal battle in our mind. We know we should focus on consistent execution and proper risk management. We have to play the long game. But our emotional side keeps whispering, "Just one big trade. Just this once."
The Hidden Influence of Social Media
We're surrounded by images of instant success. Traders posting five-figure profit days. Twenty-somethings with Lamborghinis claiming they made it trading crypto. Even though we know these are likely fake or cherry-picked results, they affect us more than we realize.
I remember sitting at my desk when I was in my audit job, scrolling through trading contents on Instagram during lunch breaks. Every post showed massive profits. Nobody was posting their losses, their blown accounts, or their struggles. This created an unrealistic benchmark in my mind. My 2% monthly gain felt insignificant compared to these supposed overnight millionaires.
This distorted perspective leads to a dangerous form of self-sabotage. We start taking larger risks, not because our strategy dictates it, but because our normal profits feel "too small" compared to what we see online. We “need” more profits.
The Compound Effect of Impatience
The most insidious part of the get-rich-quick mindset isn't that it makes us take bigger risks. It's that it makes us unable to appreciate the power of compound growth.
Let me show you what I mean. When I first started trading properly, I was making about 3% per month on a $10,000 account. That's $300 a month. It felt painfully slow. I kept thinking, "At this rate, it'll take forever to reach my goals."
But here's what I didn't understand then. Consistent 3% monthly returns, when compounded, turn $10,000 into $43,891 in five years. In ten years, that becomes $192,577. Add in regular deposits from your salary, and the numbers become even more impressive.
Instead of appreciating this mathematical certainty, we chase the fantasy of turning $10,000 into $100,000 in a month. The irony? This pursuit of faster growth usually leads to account blow-ups that set us back years.
The Real Cost of "Just This Once"
We all know the phrase "just this once" is trading's version of "one last drink". It's never just once. Each time we break our rules and survive, or worse, profit, we reinforce the behavior. Our brain logs it as a successful strategy, making it harder to stick to proper risk management in the future.
I learned this lesson the hard way with prop firm challenges. I'd be up 5%, nearly passing the challenge, and then decide to take a larger position to "speed things up." Almost every time, this decision led to failing the challenge. What's worse, even when it worked, it reinforced bad habits that would eventually cost me more money.
Breaking Free From The Cycle
The solution isn't just knowing better. You already know better. The solution is building systems that make it impossible to act on these impulses.
When I finally became consistent, it wasn't because I found better self-control. It was because I removed my ability to make emotional decisions. I created rules that were specific and inflexible:
My position sizing is calculated before the market opens.
No adjustments are allowed during trading hours.
Every trade must be pre-planned with exact entry, stop loss, and target levels.
No deviation from my trading plan is allowed.
I only opened my trading platform during specific hours that I’m allowed to trade.
These rules might seem extreme, but they protect me from myself. They make it impossible to act on those "just this once" impulses that we all feel.
The Professional's Perspective
Want to know what real professional trading looks like? It's boring. Mind-numbingly boring. I now manage multiple six-figure funded accounts, and most of my trading days are completely uneventful.
I take 2-3 trades per week. Each risk is exactly 1% of my account. My average winner makes 2R. Some months I make 5%. Some months I make 1%. Some months I lose money. But over time, the consistency compounds.
This is what trading success actually looks like. No excitement. No massive winning days to screenshot. Just steady, consistent execution of a proven process.
Embracing The Slow Path
The hardest part isn't learning to trade properly. It's learning to be satisfied with "boring" profits. It's learning to celebrate a 2R winner instead of feeling disappointed it wasn't 10R. It's learning to find pride in perfect execution rather than profit size.
This shift requires a complete redefinition of trading success. Instead of measuring success by profit, measure it by how well you followed your rules. Instead of comparing your returns to Instagram traders, compare them to bank interest rates or index funds.
The Path Forward
You already know the get-rich-quick mindset is destructive. The question is: Are you ready to embrace the boring path to success?
This means accepting that:
Your first year of proper trading might only make you a few thousand dollars.
You'll have to watch other traders post bigger profits than you (real or fake).
Some days you'll do absolutely nothing but watch setups fail to materialize.
Success will come so gradually you might not even notice it at first.
The choice is yours: Continue fighting this battle alone, or get the support you need to finally break free.

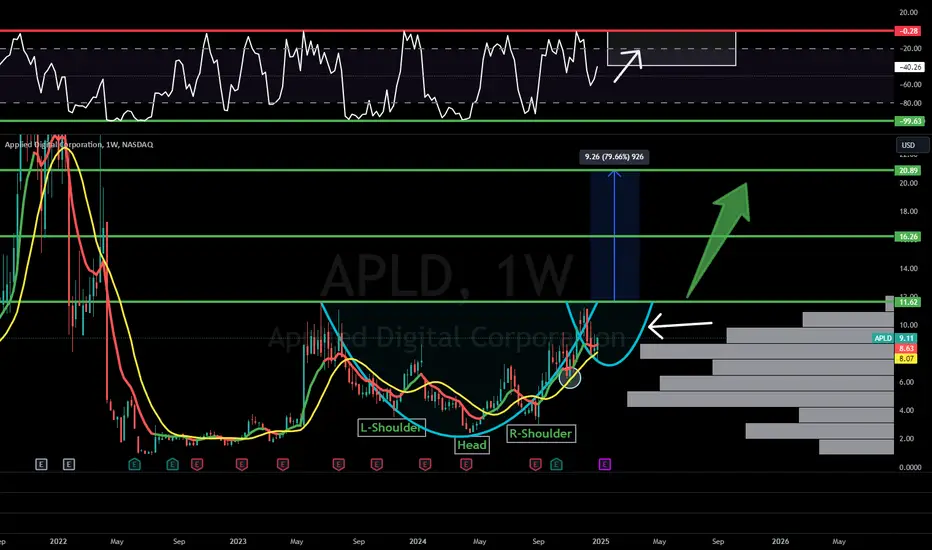
APLD - A name you NEED to add to your watchlist NOW!CHARTURDAY - NASDAQ:APLD
A good name to add to your watchlist friends!
Good:
-CupnHandle Pattern
-Inverse H&S
-Volume Shelf
-Bullish Wr%
Bad:
-Red H5 indicator
-No breakouts yet.
If we get a breakout and green H5 then...
🎯$16🎯$21
Not financial advice
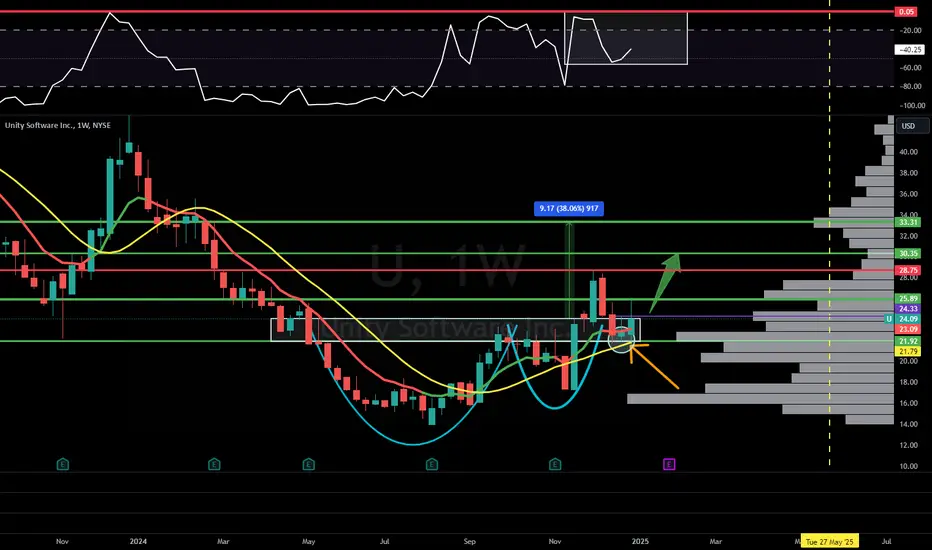
Unity - In Roaring Kitty Limbo!CHARTURDAY - NYSE:U - UNITY
Good:
-Roaring Kitty Post
-Retesting CupnHandle pattern
-Williams CB is forming
-Volume shelf
Bad:
-H5 Indicator is green
-Very Volatile name with big swings
🎯$26🎯$30🎯$33
Not financial advice
Amazon: Ready to Explode in 2025! 40% UPSIDECHARTURDAY - NASDAQ:AMZN Ready to Explode in 2025!
A great fundamental and technical setup for 2025!
-Multi-year CupnHandle with successful retest and we haven't realized the measured move yet
-Green H5 indicator
-Volume shelf w/ free space
-Williams CB is thriving
Pulled back to 9ema and previous resistance to flip into support and bounced.
🎯$231🎯$280 🎯$310
Not financial advice

$NVTS Ready to Soar! 200% UPSIDECHARTURDAY - NASDAQ:NVTS
ALL SYSTEMS GO!
-H5 Indicator is GREEN
-Broke out and successfully retested falling wedge and downtrend
-Volume shelf with GAP
-Weekly Hammer candle
-Williams CB thriving
A break over recent highs is VERY BULLISH!
🎯$6🎯$7.62 🎯$11
Not financial advice

$REAX: The Moment of Truth - Ready for a Skyrocket or a Crash?NASDAQ:REAX : The Moment of Truth - Ready for a Skyrocket or a Crash? 📉🚀
🚨 A make or break moment here, friends! 🚨
Good:
At strong cup-and-handle retest area (Strong Support Zone) 💪 *Measured Move for cup-and-handle breakout hasn't been realized yet
Falling wedge pattern into support 📈
Bad:
Off the volume shelf and in the volume gap ⚠️
Red H5 Indicator 📉
Short Williams CB formed and thriving
🚀 Going to $8.20 or sub $4 🚀
Not financial advice.
