Walgreens Boots Alliance: Stability and Growth in the Healthcare1. Stable position in the healthcare sector
Walgreens Boots Alliance is one of the leading pharmaceutical chains in the world. With a network of thousands of pharmacies and health centers, the company plays a key role in the provision of healthcare services, especially in the US and Europe. This makes it resilient to economic cycles, as healthcare is an indispensable part of life.
2. Dividends for shareholders
Walgreens is known for regularly paying dividends to its shareholders, which makes it attractive to investors looking for passive income. The company is part of the so-called Dividend Aristocrats, which means that it has increased its dividends for decades.
3. Expansion in the field of digital healthcare
Walgreens invests in technology and digital solutions to improve access to medicines and healthcare services. Online pharmacy and telemedicine platforms are part of their strategy for future development, which provides them with a competitive advantage.
4. Strategic Partnerships and Innovation
The company has partnered with leading healthcare organizations and technologies such as VillageMD to create clinics in Walgreens stores. This improves access to healthcare services and increases revenue.
5. Revenue Diversification
In addition to pharmacies, Walgreens also has a strong presence in the cosmetics and personal care sector through Boots, which diversifies revenue and makes it less dependent on one sector.
6. Opportunities at a lower stock valuation
Walgreens shares have been under pressure in recent years due to macroeconomic factors and changes in the sector. This could represent a buying opportunity if an investor believes the company will recover and continue its growth.
7. Global Presence
Walgreens has business operations in multiple countries, which provides access to different markets and reduces the risk of local economic shocks.
Potential Risks:
Competition from online giants such as Amazon entering the healthcare sector.
Pressure on margins due to regulations in the pharmaceutical sector.
It needs significant investments in innovation and modernization.
Investing

Psychedelic Stocks About to Trip! 100%+ UpsidesPsychedelic Stocks About to Trip! 🍄
RFK Jr. has been named the top health official in Trump's administration, and he's known for his stance against big pharma and preference for natural products like psychedelics. This could be a game-changer for psychedelic stocks!
In this video analysis, I dive deep into the potential impact RFK Jr. could have on key psychedelic stocks: AMEX:CYBN , NASDAQ:CMPS , NASDAQ:ATAI , and $MNMD.
These stocks are poised for significant movement, and you won't want to miss out on the insights and strategies I share. Not financial advice. 👇

Mobileye is Ready for Launch: Don't Miss the Countdown!NASDAQ:MBLY 🚘
When the rocket is about to be launched a calm and silent presence takes over the control room.
This is the scenario right now with Mobileye, the countdown is about to commence and this is your last chance to climb aboard. 🚀
Targets: $23 then $28
Not financial advice

SPY Triple Bottom, Rally time?!AMEX:SPY SP:SPX
I'd really like us to end the week above $580 in order to have this either Double or Triple bottom friends!
I could see a flash crash down to fill the price GAP at $574.81 as well.
Either way from what I'm seeing on the TVC:VIX , Economic numbers, and the charts I believe we are getting close to a bottom friends.
Consolidate down to only the best names until we receive that confirmation. They did a fake out today and another FED putting FUD into the market didn't help with the GDP projection.
Not financial advice.

Are the Top 3 China Stocks set to fly in 2025?!Are the Top 3 China names set to fly in 2025?!
China is still stimulating it's economy and believed to be turning head winds into tailwinds. I'm liking what I see on the charts for NYSE:BABA NASDAQ:BIDU NASDAQ:PDD
Check out my thoughts 👇

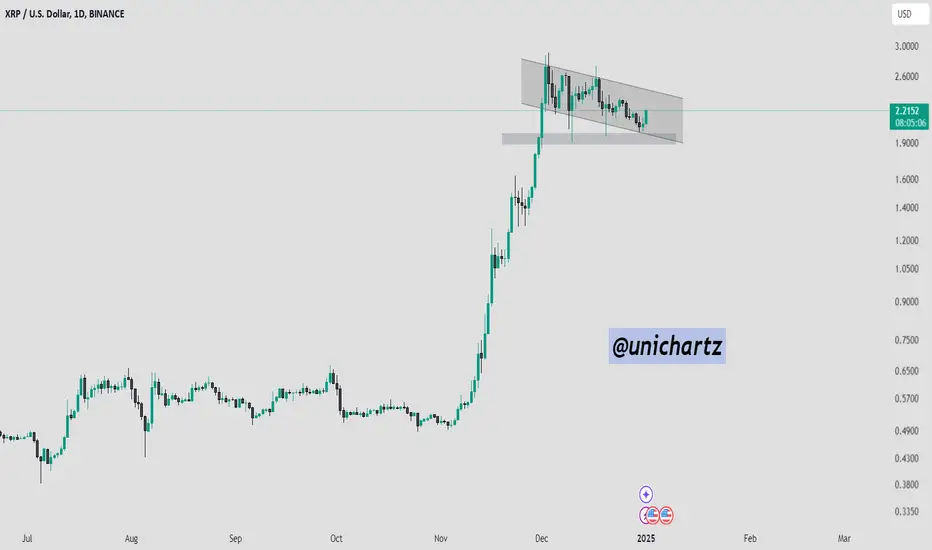
XRP Price Prediction: Breakout Above $2.25 or Further Downside?The XRP/USDT chart is displaying a descending channel following its impressive rally. The price action is consolidating, respecting both the upper and lower boundaries of the channel.
The support zone around $1.89 to $1.98, as previously highlighted, remains intact.
DYOR, NFA
LIC - retesting breakout levels. Looks good for long term.LIC - retesting breakout levels. Looks good for long term.

2025 STOCK MARKET PREVIEW – It's a BEAST!2025 Stock Market Preview – It's a BEAST!
You are going to want to watch this video as it's JAM packed with great information for the new year! It may be long but aren't you trying to learn and become a better investor or trader?!
Get ready for 1 HOUR of action-packed, game-changing insights:
-Economic data
-Technical analysis on NASDAQ:QQQ AMEX:SPY AMEX:IWM
-My 2025 predictions
-How to prep for the next stock market crash
-How I'll be monitoring the markets
What do you think will happen in 2025? Share your thoughts in the comments below!
You won't find this much FREE CONTENT anywhere else! Let's dive in!

We would buy quite a lot of NATGAS when $2 levels are reachedWe hope the price will go down so we can buy cheaper

S&P 500 Daily Chart Analysis For Week of Dec 27, 2024Technical Analysis and Outlook:
During this short trading week, the S&P 500 made significant gains and is approaching our main target, Key Resistance at 6090. This movement is expected to support the next phase of the interim rebound, with the goal of breaking through the Key Resistance level at 6090 and continuing the bullish trend. However, it's important to acknowledge that a retest of the Mean Support at 5870 is still a likely scenario.

EUR/USD Daily Chart Analysis For Week of Dec 27, 2024Technical Analysis and Outlook:
During the current abbreviated trading week, the Eurodollar is exhibiting a narrow trading range above the Outer Currency Dip level of 1.035. Current analysis suggests that the Euro is poised to resume its upward trajectory, with anticipated targets of Mean Resistance 1.051 and a potential extension to Mean Resistance marked at 1.060. It is important to note that a pull-down movement may occur towards Mean Support at 1.039; with a possible retest of the completed Outer Currency Dip level of 1.035, before resuming the upside movement.

Bitcoin(BTC/USD) Daily Chart Analysis For Week of Dec27, 2024Technical Analysis and Outlook:
During this week's trading session, Bitcoin exhibited fluctuations within the newly defined Mean Resistance of 99500 and Mean Support of 91800. The analysis suggests a high probability that the cryptocurrency will experience a decline to the Inner Coin Dip 88500 prior to initiating a significant rebound. This rebound is expected to facilitate the re-establishment of its bullish trend. It is essential to consider that a rebound bull movement may indeed occur from the Mean Support 91800.

We already bottomed, you just don't know it yet! NASDAQ:QQQ
We already bottomed, you just don't know it yet!
Daily Chart analysis:
A look back at 2024 shows us that every time we have come down to the Green support line on the Wr% we've bounced hard all the way back up to the red barrier.
It coincides with every time we've went below the 9ema that this occurs then we rocket back up. This time could be different but what I'm seeing on the weekly chart as well it doesn't look like it to me as we've already rebound back above the 9ema to this point.
I'm just a nerd who loves all things stock market, I'm no oracle but from my TA and my GUT we should bounce hard heading into the new year and back up to ATH's in January friends!
Not financial advice.

MOBILEYE: Best looking trade in a sea of RED! MOBILEYE - NASDAQ:MBLY 🚘
-H5 Indicator is GREEN
-CupnHandle B/O (daily)
-Bullish UpTrend
-Volume Shelf with Volume GAP
-Williams CB is thriving
-Green when market is RED
No reason to be BEARISH! I bought more!
Not financial advice

THIS will take place before the end of this BULL RUNAMEX:IWM CAPITALCOM:RTY AMEX:TNA
HERE ME NOW!
This CupnHandle Retest then move Higher will be the final DRIVE of this Bull Market before we get that 20% or more crash!
This will send us to a measured move of $306 and play the catchup to the AMEX:SPY NASDAQ:QQQ to conclude the bull run. Timeframe is before Nov2027 so it could be awhile but I'm making my call!
Not financial advice

POET is writing a POEM! 86% UPSIDEPOET TECHNOLOGIES - NASDAQ:POET 🧠
-H5 Indicator's GREEN
-Cup&Handle close to B/O
-Broke out of downtrend
-Massive Volume Shelf w/free space
-Bullish Wr%
✅ H5 Trade on BREAKOUT!
Entry: $6.01
Stop-Loss: $4.08
Risk/Reward: 2.51
🎯 $7.75 🎯 $11
Not financial advice

UNITY: Breakout - Retest - Higher, 40% Movie InboundUnity Software - NYSE:U 🎮
Breakout👏Retest👏Higher👏
CupnHandles have the highest success rate after they breakout!
-H5 isn't GREEN but only by centimeters, being patient due to last weeks shenanigan's
-Williams CB just formed support
🎯$26🎯$30🎯$33
Not financial advice

The HIGH TIDE is coming in! 50% UpsideHigh Tide - NASDAQ:HITI 🌊
Breakout👏Retest👏Higher👏
CupnHandles have the highest success rate after they breakout! I added more shares/ options.
-H5 is GREEN
-Williams CB thriving
🎯$4.15🎯$4.95
Not financial advice

Don't FOMO into $EOSE, Be a LION and wait for your moment! NASDAQ:EOSE 🔋🪫
Another BANGER from Charturday!
I've adjusted the CupnHandle Breakout as it's now right at the Measured move of the Bull Flag breakout while also being at prior wick high.
IMO this is not a good entry and would be considered chasing. I'm going to wait for the Wr% to peel off the Williams CB red barrier and look for support to form and enter then.
If it doesn't happen and continues to run it's OKAY! You can't have endless plates or delicious HAM or PIE during the Holidays! The same goes for the stock market friends!
Not financial advice.

C3.AI is allergic to $35! 55% UPSIDEC3.AI - NYSE:AI 🤖
All the bad news, downgrades, and FUD!
THEY STILL CAN'T GET THIS NAME UNDER $35!
5 WEEKS in a row of wicking off of $35 friends!
DO I REALLY NEED TO TELL YOU HOW BULLISH THAT IS OR CAN I STOP USING ALL CAPS BC YOU GET IT!
🎯$39🎯$46🎯$49🎯$58
Not financial advice

TIME IS RUNNING OUT TO BUY MOBILEYE! Reason #6 to BUY NASDAQ:MBLY NOW! 🚘
We are breaking out of the Cup&Handle...again!
If you can't see it yet, you'll never see it! 👀
Other 5 reasons in the linked video👇

MERRY CHRISTMAS & HAPPY HOLIDAYS FRIENDS!Leading by Example This Christmas! 🎄
I'm out of here and going to focus on what truly matters most. Lets put the phones down, accounts to the side, and focus on Family, Faith, & Friends which are most important! Go be with them and cherish these moments! ❤️
Wishing you all a Merry Christmas & Happy Holidays, I'll be off the grid until Thursday. 🫡

NVTS - 50% already, 300% more to go! Massive 2025 StockNASDAQ:NVTS 💾
A top 5 trade for me right now!
We are up a massive 50%+ since we called this name out for a breakout retest then move higher. We got exactly that friends. It's a massive move but what if I told you that this move pales in comparison to the overall 300%+ move I see coming over 2025! Buckle up this is going to be a wild ride friends.
Weekly Analysis:
-H5 Indicator is GREEN
-Broke out of downtrend & falling wedge in which we hit our first profit target and now we successfully retested the breakout and bounce higher! I bought more shares/ options this past week.
-Sitting on a volume shelf with a lot of room to run!
-Williams CB has created support and formed!
🔜🎯$4.65🎯$6🎯$7.62🎯$11.17🎯$12.29
⏲️Before May2026
Not financial advice.
