Nu Holdings: Is Latin America's Fintech Star Sustainable?Nu Holdings Ltd. stands as a prominent neobank, revolutionizing financial services across Latin America. The company leverages the region's accelerating smartphone adoption and burgeoning digital payment trends, offering a comprehensive suite of services from checking accounts to insurance. Nu's impressive trajectory includes acquiring 118.6 million customers, accumulating $54 billion in assets, and consistently demonstrating robust revenue and net income growth, primarily driven by its strong presence in Brazil, Mexico, and Colombia; - this strategic alignment with digital transformation positions Nu as a significant player in the evolving financial landscape.
Despite its remarkable expansion and optimistic projections for continued customer and asset growth, Nu faces notable financial headwinds. The company experiences an erosion in its net interest margin (NIM), influenced by increased funding costs from attracting new, high-quality customers and a strategic shift towards lower-yield, secured lending products. Furthermore, the depreciation of the Brazilian Real and Mexican Peso against the US dollar impacts their reported earnings. Nu's ambitious ventures, such as the NuCel mobile phone service, require substantial capital investments, introducing execution risks and demanding efficient capital allocation.
Beyond internal financial dynamics, a significant, albeit external, geopolitical risk looms: a potential Chinese invasion of Taiwan. This event would trigger a global embargo on China, leading to unprecedented supply chain disruptions, widespread stagflation, and hyperinflation worldwide. Such a catastrophic economic cascade would profoundly impact Nu Holdings, even given its regional focus. It would likely result in drastically reduced consumer spending, a surge in loan defaults, severe challenges in accessing funding, further currency devaluations, and soaring operational costs, thereby threatening the company's stability and growth prospects.
Ultimately, Nu Holdings presents a compelling growth narrative rooted in its innovative model and strong market penetration. However, internal pressures from evolving interest margins and high capital expenditure, combined with the low-probability but high-impact global economic upheaval stemming from geopolitical tensions, necessitate a cautious and comprehensive assessment. Investors must weigh Nu's demonstrated success against these complex, intertwined risks, acknowledging that its future prosperity is inextricably linked to both regional economic stability and the broader global geopolitical climate.
Investing

GOOG In Trouble!I first started warning about GOOG back on March 18, 2025
Since GOOG has formed this big bear flag outside the structure in the middle of nowhere.
This is an indication of more weakness to come!
GTF out is in order for bulls. It is better to be out of the market wishing you were in and then in the market wishing you were out!
I can only provide the setup. The rest is up to you.
Click like, follow, for more. Let's get to 5,000 followers.

SPY (S&P500 ETF) - Price Testing Resistance Trendline - DailySPY (S&P500 ETF) price is currently testing a resistance trendline above ($593 to $595 price levels).
SPY price in the medium-term has been uptrending since April and May 2025.
SPY price in the short-term has been consolidating sideways, and a large volume breakout or breakdown has not occurred yet.
The 12EMA (blue line) has been holding as support for 5 trading days. Resistance targets to the upside would be $598 to $600.
The grey gap and the 26EMA (purple line) are downside support targets if a rally does not occur this month ($576 to $567).
Breaking news and tariff trade deals are supposed to occur in June and July 2025.

Bitcoin (BTCUSDT) - Price Testing 26EMA and 12EMA - Daily ChartBitcoin (BTCUSDT) price is currently testing the 26EMA and 12EMA price levels on the Daily chart.
Bitcoin price has been in a medium-term uptrend since April and May 2025.
However, a short-term downtrend pullback has occurred and the price recently bounced up from the 26EMA zone ($104,000).
A morning star candle price pattern printed above the 26 EMA support line.
Large buyer volume could confirm the price candle pattern and Bitcoin price could rally up above 12EMA resistance ($106,000).
If price continues to reject and fall below $106,000 the downtrend would likely continue into June 2025.
Breaking news and stock market correlations could affect the price of Bitcoin and cryptocurrencies.
Tariff news and trade deals are supposed to occur throughout June and July 2025.

EURUSD CRACK!I first turned bullish on the EUR back in November 2024 after the disastrous election results.
I have always felt the 105 area was a good area to go long, fundamentally going back all the way to 2017. Here is an example.
After 17 years of data, we can all agree that the 105 area was a great value to get long the EUR. Now we see a major CRACK! in the chart with the fundamentals to back it up.
Again, I remind you I am a MACRO Trader. So my trades hold for a long, long time unless the facts change. I don't do 3 pips and i am out crap!
Let this be a WARNING! To the dollar bulls!
Click Boost, follow, subscribe! Let's get to 5,000 followers so I can help them navigate these crazy markets, too. ))

S&P 500 Daily Chart Analysis For Week of May 30, 2025Technical Analysis and Outlook:
The S&P 500 Index has undergone considerable price fluctuations during the trading sessions of this week, successfully reaching a critical target at the Mean Support level of 5800. Presently, the index is exhibiting an upward trend with a focus on the retest of the Inner Index Dip at 5955 and Key Resistance at 5965. Furthermore, additional significant levels have been identified, including the Next#1 Outer Index Rally at 6073, Key Resistance at 6150, and the Next#2 Outer Index Rally at 6235. Conversely, there is a potential for the index prices to downfall aiming to retest Mean Support 5800 and to complete the Outer Index Dip, noted at 5730.

EUR/USD Daily Chart Analysis For Week of May 30, 2025Technical Analysis and Outlook:
The Eurodollar has experienced significant volatility during this week's trading session. It reached a significant Mean Resistance level at 1.142 while also encountering Mean Support at a target of 1.122. Recent analyses suggest that the Euro is likely to revisit the critical target of 1.142, which includes Key Resistance at 1.151 and the completed Outer Currency Rally at 1.157. However, there is a potential for a downward correction from the current level, which could lead to prices retesting the Mean Support of 1.122. There is also a possibility for further declines, reaching the Outer Currency Dip at 1.108.

Bitcoin(BTC/USD) Daily Chart Analysis For Week of May 30, 2025Technical Analysis and Outlook:
Bitcoin has undergone a significant decline during the current week's trading session and is presently situated at the Mean Support level of $103,000. This downward trajectory has the potential to establish a temporary pause, which may facilitate the emergence of upward momentum from this level, and it could pose a challenge to the Key Resistance level at 109500. A successful breach of this resistance may lead to the completion of the Inner Coin Rally target at $114500. However, it is crucial to acknowledge the possibility of renewed downward momentum from the current level, as this could result in a decline toward the Mean Support of 99000.

NEAR to $45? The Signs Are All There…Just imagine traveling through time.
Many people look back with regret, wishing they had invested in cryptocurrencies before previous bullish cycles. We've all heard phrases like "If only I had bought Bitcoin at $100, I'd be a millionaire by now."
But the real question is: Will you have the courage to make the right decision when the moment comes?
You might think I'm crazy for presenting these targets today — and that's okay. But trust me, in a few months, you'll witness the phenomenal power of our analysis system. The market is fractal by nature; what happens on lower timeframes inevitably plays out on higher ones.
NEAR is one of the most promising blockchains, and all signals are aligning for a move toward $45.
The question is: Do you have the courage to take action now?

$AMD When, not IF! 105% UPSIDENASDAQ:AMD - It's not a matter of if, but when...🚀
Once this downtrend on the weekly is broken out of with a big fat engulfing candle we will launch off this volume shelf like a SpaceX rocket to mars!
All indictors are curling up and I think the time is coming for AMD to make their ascent higher and back to ATHs!

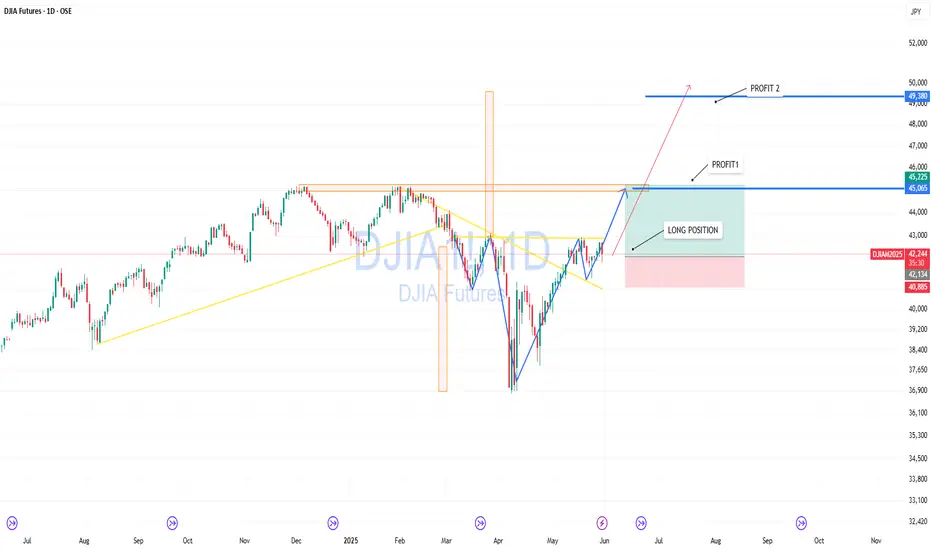
DJIA — Setting Up for Breakout and New ImpulseThe Dow Jones Index is approaching a critical resistance zone. After a deep V-shaped recovery and clear bullish structure, price is preparing for a breakout.
Chart shows a clean long entry with a stop below the recent consolidation. A break and hold above 45,000 could lead to a move toward 46,000, and if momentum holds — up to 49,300.
Partial profit-taking levels:
— Target 1: 45,225
— Target 2: 49,380
Fundamentally, US equity markets remain strong, and DJIA may play catch-up after lagging during the last correction.
$MBLY is BREAKING OUT - 224% UpsideNASDAQ:MBLY is breaking out - 224% Upside! 🚀
🎯$18.09🎯$20.03🎯$24.66🎯$34.26🎯$49.20
- Bullish H5_L Indicator
- Volume Shelf with GAP
- Inverse H&S with a MM to $49.20 (Already broke out and retested)
- Rising WR%
- Undervalued and at the forefront of AV Tech

Round 2 on $FUBO! 92% UpsideEarlier this year we caught the MASSIVE 400% move on NYSE:FUBO 🚀
1st PT is $4.89 🎯
2nd PT and MM of Falling Wedge is $5.86 📏
We've come full circle and we are back in them for another MASSIVE move!

$TEM - GET READY! 30%+ UpsideNASDAQ:TEM - GET READY!
✅ Inverse H&S Breakout
✅ Falling Wedge Breakout
🎯 Targets: $77.43 & $90.63 Before August!

Archer Aviation: Fact or Fiction in the Skies?Archer Aviation, a prominent player in the burgeoning electric vertical takeoff and landing (eVTOL) industry, recently experienced a significant stock surge, followed by a sharp decline. This volatility was triggered by a report from short-seller Culper Research, which accused Archer of "massive fraud" and systematically misleading investors on key development and testing milestones for its Midnight eVTOL aircraft. Culper's allegations included misrepresentations of assembly timelines, readiness for pilot-controlled flights, and the legitimacy of a "transition flight" to unlock funding. The report also criticized Archer's promotional spending and claimed stalled progress on FAA certification, challenging the company's aggressive commercialization timeline.
Archer Aviation swiftly and forcefully refuted these claims, labeling them "baseless" and questioning Culper Research's credibility, citing its founder's "shorting and distorting" reputation. Archer emphasized its strong first-quarter 2025 earnings, which saw a dramatic narrowing of net losses and a substantial increase in cash reserves to over $1 billion. The company highlighted its operational momentum, including strategic partnerships with Palantir for AI development and Anduril for defense applications, a $142 million U.S. Air Force contract, and significant early customer orders exceeding $6 billion. Archer also pointed to its progress on FAA operational certifications, having secured three of four essential licenses, and its preparation for "for credit" flight testing for Type Certification, a critical step towards commercial passenger operations.
Culper Research's past track record presents a mixed picture, with previous targets like Soundhound AI experiencing initial stock declines followed by strong financial rebounds, though some legal challenges persisted. This nuanced history suggests that while Culper's reports can cause immediate market disruption, they do not consistently predict long-term corporate failure or fully validate the most severe allegations. The eVTOL industry itself faces immense challenges, including stringent regulatory hurdles, high capital requirements, and the need for extensive infrastructure development.
For investors, Archer Aviation remains a high-risk, long-duration investment. The conflicting narratives necessitate a cautious approach, focusing on verifiable milestones such as FAA Type Certification progress, cash burn rate, successful commercialization execution, and Archer's comprehensive response to the allegations. While the "fraud" thesis might be "overblown" given Archer's verifiable progress and strong financial position, ongoing due diligence is crucial. The company's long-term success hinges on its ability to navigate these complexities and meticulously execute its ambitious commercialization plan.

GBPCHF: Long Setup – Bounce from Trendline + EMA CrossThe price has bounced from the lower boundary of the ascending channel and confirmed a bullish reversal after EMA cross. Current momentum supports a long position.
📌 Entry: Market buy (current price ~1.1142)
🎯 Targets:
TP1: 1.1291 – minor resistance
TP2: 1.1394 – upper channel border
🛡️ Stop-loss: Below 1.1090 (under channel + EMAs)
This setup favors continuation of the bullish trend after liquidity grab and structure shift.

$CPNG is flying and has more room: 61% UpsideNYSE:CPNG has been on a heater! 🚀
First target is $35 🎯
CupnHandle breaking out = $43.65 📏
Looking for a pullback off the red barrier to enter this name after the breakout! 💪

S&P 500 Daily Chart Analysis For Week of May 23, 2025Technical Analysis and Outlook:
The S&P 500 Index demonstrated a consistent downward trend during this week's trading session, reaching a significant target at the Mean Support level 5828. The index is currently trending lower, targeting the Inner Index Dip at 5730, with additional marks identified at the Mean Support levels of 5660 and 5600. Conversely, the index has the potential to rebound from its present position, advancing toward the Mean Resistance level of 5860 and retesting the previously completed Outer Index Rally at 5955.

EUR/USD Daily Chart Analysis For Week of May 23, 2025Technical Analysis and Outlook:
The Eurodollar has demonstrated significant strength during this week's trading session, attaining a notable Inner Currency Rally at 1.129 and encountering Mean Resistance at 1.137. Recent analyses indicate that the Euro will likely progress towards the forthcoming target levels, specifically the Mean Resistance at 1.142 and the Key Resistance at 1.151. A retest of the completed Outer Currency Rally at 1.157 may facilitate this advancement. However, a potential downward pullback could emerge from the current price range, particularly in proximity to the Mean Resistance level of 1.137, with a possibility of declining to the Mean Support at 1.127.

Bitcoin(BTC/USD) Daily Chart Analysis For Week of May 23, 2025Technical Analysis and Outlook:
In the course of this week's trading session, Bitcoin demonstrated significant upward movement, surpassing both Mean Resistance at 105000 and Key Resistance at 106100. This progression also facilitated the surpassing completed Inner Coin Rally at 108,000, and the highly anticipated Outer Coin Rally marked at 110000. As a result, the cryptocurrency experienced a substantial decline, currently aiming toward Mean Support at 105600, with a potential further decline toward an additional Mean Support target at 101500.
It is essential to acknowledge the possibility of an upward momentum emerging from the current level, which may enable a challenge to Key Resistance at 111700. Success in this regard could result in reaching the Inner Coin Rally at $114500 and, subsequently, the Outer Coin Rally at 122000.

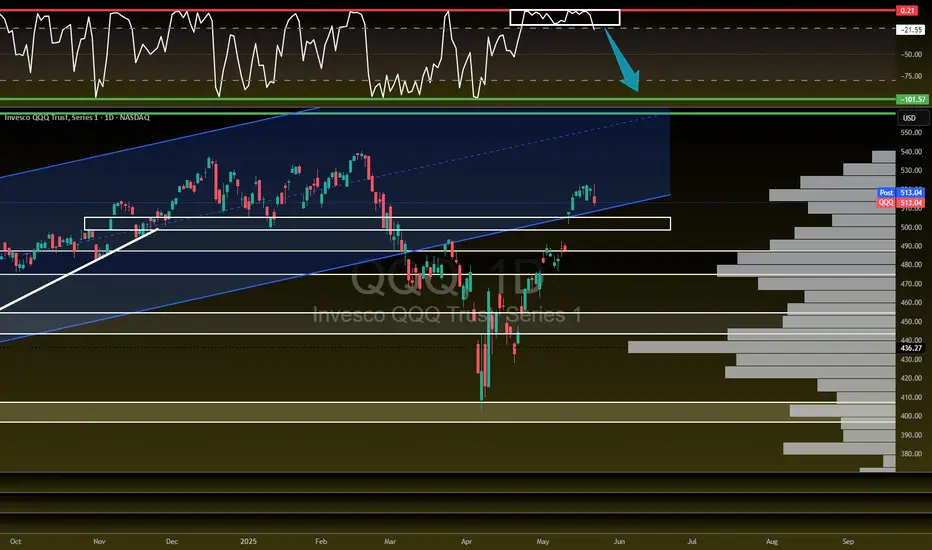
$QQQ Needs this pullback to happen!NASDAQ:QQQ a healthy pullback to fill the GAP and retest the 100/200DMA here going into next week.
A break through these MA's would be very bearish.

QQQ about to FLUSH?! Let's talk about it!I'm not saying it's over but you have to admit it does feel like we are going to see a decent size pullback...2-6% over the next few weeks on the NASDAQ:QQQ AMEX:SPY
- TVC:VIX back over 20
- US20Y hit 52 week high
- USDJPY starting to creep towards April lows
- $491.54 GAP to fill on NASDAQ:QQQ
- $447.58 Bigger GAP to fill on NASDAQ:QQQ
- Credit starting to become and issue
- Banks/ Credit companies tanked today
There is bullish pieces as well but we do look extended here and a healthy 2-6% would be welcomed...A break of $475 level spells trouble on QQQ.
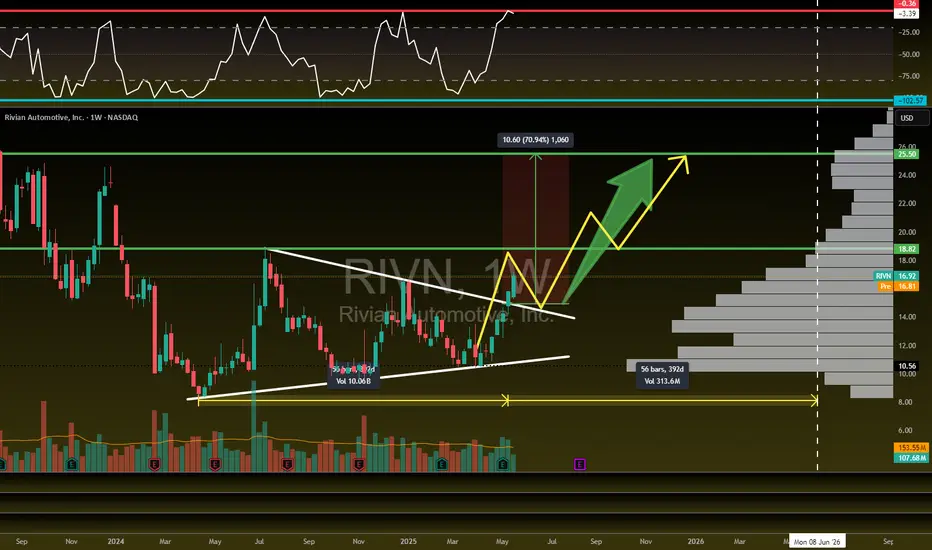
Rivian is flying! 71% UpsideNASDAQ:RIVN is flying! ✈️
Looking for a pullback to retest our breakout then move higher to our profit targets...Posted this setup last week in the community.
🎯$18.82📏$25.50
- Bullish H5_L Indicator
- Running into Red barrier (Need WCB to form)
- Volume shelf launch