GBPUSD#GBPUSD
The short context is strongly pronounced, and due to the bank holidays, a liquidity outflow is evident. I believe the target will be reached within tomorrow's session. Ideally, we'll see liquidity taken above before continuing with the short order flow. Invalidation of the scenario can be considered if the price closes above 1.26500.
Investing

M A L A M A A L - M O N T H L YDEEPAKNTR fut broke out of traingle pattern on DAILY charts with good OI & after very good consolidation.
Not to be missed breakout.
Could be bought for April expiry with mentioned stoploss & targets.

EURUSD1h - The hourly timeframe is currently indicating a short context as well. I'm expecting a breakout above the imbalance and also above the previous day's high (PDH). After that, my main intraday target will be the previous day's low (PDL).
Summarizing the above, both key timeframes are in a short context.

75: Douglas AG: Is it Time to Accumulate at Current Prices?Douglas, the parfumerie chain, has experienced a significant decline in its stock price since its initial public offering (IPO). With the stock now trading around 50% lower than its IPO price, it appears to be approaching a potential accumulation zone between the price range of 20 and 15 euros. This analysis explores the possibility of this price level being an attractive opportunity for accumulation, provided that market participants agree with this valuation.
Technical Analysis:
- Douglas stock has experienced a sharp decline since its IPO, forming a clear downtrend pattern on the charts.
- The stock is currently approaching a critical support level in the range of 20 to 15 euros, where it has historically found buying interest.
- The Relative Strength Index (RSI) indicator suggests that the stock is approaching oversold conditions, indicating potential exhaustion in selling pressure.
Fundamental Analysis:
- Despite the recent struggles in its stock price, Douglas remains a prominent player in the parfumerie industry, with a significant presence across Europe.
- The IPO proceeds were primarily intended to reduce the company's debt burden, indicating a strategic move towards financial stability.
- Douglas has outlined plans for expansion and modernization, which could potentially drive future growth and value creation.
Market Sentiment:
- The current sentiment towards Douglas stock appears negative due to the substantial decline post-IPO.
- However, there may be a shift in sentiment if market participants perceive the current price level as attractive for accumulation.
- Dealer activity and institutional investor sentiment will be crucial in determining whether the stock finds support in the indicated price range.
The recent decline in Douglas stock price post-IPO presents a potential opportunity for accumulation, with the stock nearing a key support level between 20 and 15 euros. However, investor sentiment and dealer activity will play a vital role in confirming whether this price range indeed serves as a favorable accumulation zone. Traders and investors should closely monitor price action and market dynamics before making any investment decisions regarding Douglas stock.

1. Crafting a Trading Plan: Your Compass in the Market StormAs discussed in our previous post, a well-defined trading plan is your invaluable compass, navigating you through the ever-shifting tides of the financial markets. It's not a rigid set of rules, but a dynamic roadmap that evolves with changing market conditions.
Defining Your Trading Goals
Your trading plan begins by clearly defining your trading goals. What do you aspire to achieve through trading? Is it generating consistent income, building wealth, or simply enjoying the thrill of the market? Having clear goals provides direction and motivation, keeping you focused on the long-term. Think “business goals”!
Identifying Your Trading Style
Next, identify your trading style. Are you a day trader, seeking quick profits by capitalising on short-term market movements? Or are you a swing trader, looking for larger gains by holding trades for days or even weeks?
Understanding your trading style helps you choose the right strategies and instruments. This will also depends on your current “life” circumstances, private and professional, i.e. how can you “fit” trading into your day-to-day routine.
Establishing Entry and Exit Criteria
Your trading plan should clearly outline your entry and exit criteria. What conditions trigger you to enter a trade? What signals indicate when to exit? These criteria should be based on sound technical analysis and risk management principles.
Managing Risk and Reward
Risk management is paramount in trading. Your plan should outline your risk tolerance and maximum loss per trade. Never risk more than you can afford to lose. Additionally, consider using stop-loss orders to limit your potential losses. This will be further discussed soon through this media too!
Review and Adapt
Your trading plan is not a static document; it should evolve as you gain experience and market conditions change. Regularly review your plan, assess its effectiveness, and make adjustments as needed. Remember, trading is a continuous learning process.
Remember, your trading plan is your personal roadmap to success. By carefully crafting and adhering to it, you can navigate the complexities of the financial markets with greater confidence and achieve your trading goals.
In our next post, we will expand on the 2nd key aspect of our initial post which will be about “ Unveiling Market Secrets ”.

S&P 500 Daily Chart Analysis For Week of April 5, 2024Technical Analysis and Outlook:
The S&P 500 index experienced a severe drop below our Mean Sup 5203; however, the market rebounded swiftly and returned to an active crime scene. The current upward trend indicates that it will reach the target of Key Res 5260 and, subsequently, Outer Index Rally 5280, the long-awaited target. On the downside, Spooz may revisit the newly created Mean Support level of 5150, which is expected to act as a launching point to reignite its bullish trend.

EUR/USD Daily Chart Analysis For Week of April 5, 2024Technical Analysis and Outlook:
The Eurodollar has broken through our Mean Support level of 1.077 and has quickly risen to hover around the Mean Resistance level of 1.084. This momentum is expected to generate further selling pressure, resulting in a decline to the Mean Support level of 1.074. Ultimately, the Eurodollar is expected to reach an Inner Currency Dip of 1.065. However, it is essential to note that an intermediate fluctuation at the Mean Resistance level of 1.084 may require action.

Bitcoin(BTC/USD) Daily Chart Analysis For Week of April 5, 2024Technical Analysis and Outlook:
In this week's price action, Bitcoin rapidly moved towards a Mean Support level of 66700 and, in the process, established a new Mean Support level of 65600. This new level is being used as a base to ignite the bullish trend further. Currently, the market is experiencing consolidation, with the expectation of moving toward reaching the Key Resistance level of 73200 and beyond. However, a potential decline may occur, resulting in Bitcoin falling to the Mean Support level of 65600.

Wheaton (WPM): Is 88 CAD the Next Stop?Due to the significant rise in gold prices, our primary scenario for Wheaton Precious Metals has been invalidated, and we've recharted the entire course for you. We now believe what we're witnessing could be a potential Wave 5 of Wave (3), meaning we're in the overarching Wave (3). This wave should reach at least 88 Canadian dollars, stretching potentially above 250, which of course will largely depend on how the gold price performs. We consider the Wave 4 to have concluded at the low of 39 Canadian dollars, and we're now in a Wave ((iii)), with Wave ((ii)) having concluded at just about 52 Canadian dollars. We anticipate a possible short rise to then develop a subordinate Wave (ii), which likely will see the high at 71.39 CAD acting as a strong resistance, and we might witness a relatively short downtrend for our Wave (ii), where we'll place new entries. We'll let you know as soon as we place a limit order.

EURUSDGood morning!
Daily review of EURUSD: After yesterday's corrective movement in the long direction (I remind you that on higher timeframes we continue to be in a short context on the daily timeframe). In the New York session, we witnessed a breakdown of the market structure into a short context. My intraday target is the minimum formed during the Asian session.

GBPUSDThe pound, like the euro, has been in a short context since yesterday. The clear priority is to work in the short direction. A local magnet for price is the FVG formed above, from which we would like to see a reaction, with targets set at the Frankfurt minimum.

GBPUSD
#DayPlan
The pound, like the euro, remains in a long context after yesterday's news-driven movements. The clear priority is also to work in the long direction. I am ready to consider positions for continuation from the fractals formed during the Asian session.

Bitcoin Counter WickoffEverything is in Graph. if you don't know about Wickoff Strategy, i invite you to DYOR it.
- i will try to explain you how to counter Whales/institutionals as small retails investors
- of course this method can be adjusted with your portofolio, i just made it very simple to make peoples understand how to invest wisely.
- This Chart is based on the Money you don't need for living!
- if you use this method correctly and adapt it to your portofolio, you will always restart a new cycle with more money.
- if you look at the chart closely, you will understand that i didn't use higher points to take profits and keep always 10,000$ in Market, so this chart is based on human mistakes and not much greed.
-----------------------------------------------------------------------------------------------------------------------------
- in this method we starts with 10,000$ invest as exemple.
- Take profits 2 Times, keep base investment in market ( because we don't know the real potential Top ).
-----------------------------------------------------------------------------------------------------------------------------
- The Second Phase is waiting for the Dip and buying back
- Re-inject Money 3 Times in the Dip and Wait for market recovery phase ( because we don't know the real potential Bottom )
-----------------------------------------------------------------------------------------------------------------------------
- if the bottom was a mistake and BTC fall down more.
- just invest slowly what you don't need for living and be patient, BTC is fundamentally poised to go up.
-----------------------------------------------------------------------------------------------------------------------------
- This method can be done with 10$ - 100$ - 1000$, no matter money because everything is based % invest and Time.
- Remember that your management is the most important, if you don't manage your money correctly, Tears will come.
"You have to believe that you are the one who creates your success and also that you are the one who creates your mediocrity".
Happy Tr4Ding !

$MVID can show one more step to topMOEX:MVID shows readiness to move up to 250 for a while before it will move further.
Does not constitute a recommendation.
#furoreggs #investing #stocks #shares #idea #forecast #trading #analysis
If you want to discuss, please subscribe and challenge this point of view )

HSBS Investment Conservative Trend Trade 7FConservative Trend Trade 7F
+ long impulse
+ 1/2 correction
+ T2 level
+ support level
+ biggest volume 2Sp+
Monthly Context:
+ long impulse
+ SOS level
+ 1/2 correction
+ support level
+ 2Sp- + test"

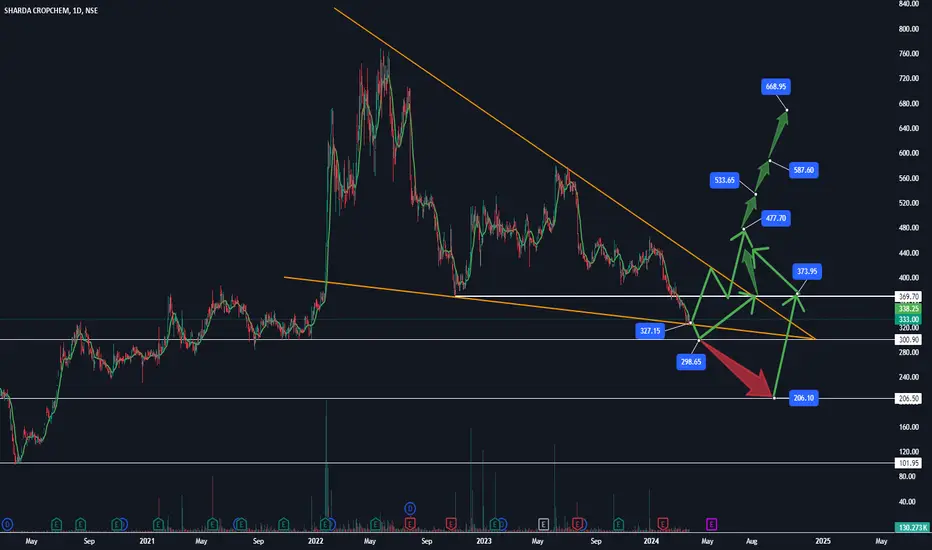
Long term Investment Idea | Sharda Crop | 100% Upside Potential Long term Investment Idea | NSE:SHARDACROP | 100% Upside Potential
✅ Sharda Cropchem CMP - Rs 333
✅ Promoter holding 74.8 %
✅ Company is almost debt free.
✅ Good sales growth over 3-5 years.
✅ Company has good capex and global presence
The negative profit growth observed in companies like UPL, MOL, and Deepak Fertilizers suggests a broader sectoral trend, as similar trends in sales and OPM are evident across all agrochemical stocks.
Valuation is attractive and good to buy/accumulate for Mid to Long term gain from CMP
✅ Add more at Rs 320-300.
The sector is out of flavour and can provide a good contra bet. If good monsoon can further help in earnings.
Targets as per chart drawings.
Thanks