NFLX Head Test Cracking!Head test Cracking! Now we get to see what it's made of.
Head tests patterns take out stops before collapsing.
I was forced into "target reached" by TV. Clearly, my target has not been reached since the H&S never broke to trigger a trade to begin with.
This is a much better setup with very low risk, with potentially huge returns for shorts. A lot of meat on that bone!!
Click boost, follow, subscribe! For more tips, tricks, and calls. Let's get to 5,000 followers and help more people navigate these crazy markets.
Investing

NFLX Bearish Setup!This is a simple setup that almost anyone can read—a Head & Shoulders at the top signaling a reversal pattern.
Contrary to popular belief H&S are continuation patterns if they are not at a top.
The only other time H&S are reversal patterns is if the chart has multiple H&S everywhere.
Time for bulls to take their money and RUN!!! The fun ride is over for a while. Time to go home. ((
CAUTION!
Click BOOST, follow subscribe. Let me help you navigate these crazy markets. ))

TSLA Eiffel Tower Not CompleteEiffel tower patterns are rare but very powerful TA structures when they develop.
They are very hard patterns to short since we can never know when the wave up ends. However, there is so much information we can extract from them during and after the collapse.
When they are rising and going vertical, and you happen to be in it. The benefits will be great! As the price action sucks in everyone all at once with virtually no sellers.
So, what info can we learn?
On the way up, when this is happening, you should have the ability to recognize it at some point without worrying if you got the top. Take your money and RUN!
Never try to get back in and try to chase it up!
Never try to short it, thinking it is too high, this is the top!
When it tops out, never buy the dip! Bc you know how this structure will end.
Never buy based on some silly FIB or bc it's down too much!
Never buy the base thinking it will go back to new all-time highs, and it is now safe to get back in bc it will only keep going lower, more through time, frustrating you until you puke it up.
So remember this gimmicky sound bite.
"If they don't scare you out, they will wear you out!"
Ain't nobody got time for that! Your money has a much better place to be allocated to make you money instead of being fixated on a chart like this.
The reason people get stuck is bc the move provoked emotion! Then, when they get involved thinking they will be Buffett tomorrow from this one trade, they will experience Euphoria, sadness, anger etc., further provoking even more emotions to the point they become obsessed! Guessing, waiting, hoping, doubling down on and on...
Ask me how I know! hahaha!
While I made a lot of money shorting GME, here is an example of an Eiffel tower with many, many people that have this trading disease I just spoke about.
In conclusion, anyone who believes that TSLA will hit $1,000 blah blah blah and suckered into buying it. You now know you are being honey dicked by a bunch of armatures and bots on X. Beyond TSLA there are many such charts out there tight now that have formed the beginnings of ET. As such, you should know how to recognize it quickly and avoid the pitfalls out there.FYI I called the Top on TSLA ))
Click Like, Follow, Subscribe to learn much more about real macroeconomics and technical analysis. Let me help you navigate these crazy markets.

Bitcoin Stabilizes at $94,000 — What's Next?Following a strong rally in early 2025, Bitcoin is now showing signs of stabilization, hovering around the $94,000 mark. For a notoriously volatile asset, this steady price movement might seem unusual. However, this calm may be the calm before the storm—either a breakout or a pullback. So, what’s behind this current phase of Bitcoin’s price?
Firstly, all eyes are on the U.S. Federal Reserve. Investors are nervously anticipating its next interest rate decision. As always, monetary policy acts as a major catalyst for risk assets. A rate cut could boost inflows into the crypto market, while a hike might lead to capital outflows and dampen sentiment.
Secondly, retail investor activity appears to be cooling. Trading volumes have declined compared to the high levels seen in February and March, when the market was filled with euphoria. Now, we are witnessing a period of cautious waiting. The "Fear and Greed Index" reflects this, hovering around neutral territory, indicating market indecision.
From a technical standpoint, analysts identify two key levels: strong resistance near $100,000 and a support zone around $90,000. As long as Bitcoin remains within this range, short-term traders are operating in a sideways market while longer-term investors remain on standby.
Beyond macroeconomic factors, crypto-specific developments will also influence BTC’s price. Important upcoming events—such as Ethereum’s upgrade, potential regulatory changes in the UK and Japan, and global crypto conferences—could all act as catalysts.
Institutional investors are another major factor. Companies like MicroStrategy continue to accumulate Bitcoin, adding confidence to the asset’s long-term outlook. If more institutions follow suit, Bitcoin could see increased demand and stronger bullish momentum.
In the near term, market participants are advised to stay cautious. Bitcoin may continue consolidating until a clear macro or market-specific catalyst emerges.
All in all, $94,000 is more than just a number. It represents a temporary equilibrium of forces—bullish and bearish. The question is not whether Bitcoin will move again, but when and in which direction.

Axon's Ascent: More Than Meets the Eye?Axon Enterprise, a leader in public safety technology, anticipates a robust first quarter for 2025, with analysts projecting significant increases in revenue and earnings per share. This optimistic outlook builds upon the company's consistent track record of exceeding market expectations in previous quarters. Driving this performance are strong fundamentals, including sustained demand for core TASER products and cartridges, alongside substantial growth in the Software & Sensors division, fueled by expanding user networks, increased adoption of cloud services, and the successful launch of new hardware like the Axon Body 4 camera.
The company actively pursues strategic expansion, entering into key partnerships with entities such as Skydio for drone technology and Ring for community safety integrations. Recent acquisitions, including Dedrone for airspace security, further bolster Axon's comprehensive ecosystem, which is designed to enhance real-time public safety operations. These collaborations and acquisitions, coupled with the introduction of advanced AI-powered tools like Axon Assistant and Draft One, demonstrate Axon's commitment to innovation and its ability to capture new market opportunities, positioning it as a forward-thinking player in the sector.
Investor confidence remains high, evidenced by significant holdings from institutional investors and predominantly positive ratings from Wall Street analysts. This financial backing reflects belief in Axon's growth strategy and its improving profitability profile. While some fringe discussions have attempted to link Axon's trajectory to unrelated societal issues, the company's growth is demonstrably rooted in technological advancement, strategic business development, and meeting the evolving demands of public safety agencies globally. Axon's focus on responsible innovation and building integrated solutions underscores its genuine business drivers.

$HIMS is HIMS! 80% Upside AheadNYSE:HIMS is HIMS! 80% Upside Ahead
Demolished earnings and I have this name at a fair value of $76 per share based on HIMS 2030 $6.5B Rev. Guidance.
Also, H5_L Indicator is about to cross bullish while the Wr% is rising and swinging from green to red!
Profit Targets:
- $50
- $60
- ATHs!
Before EOY!
Not financial Advice

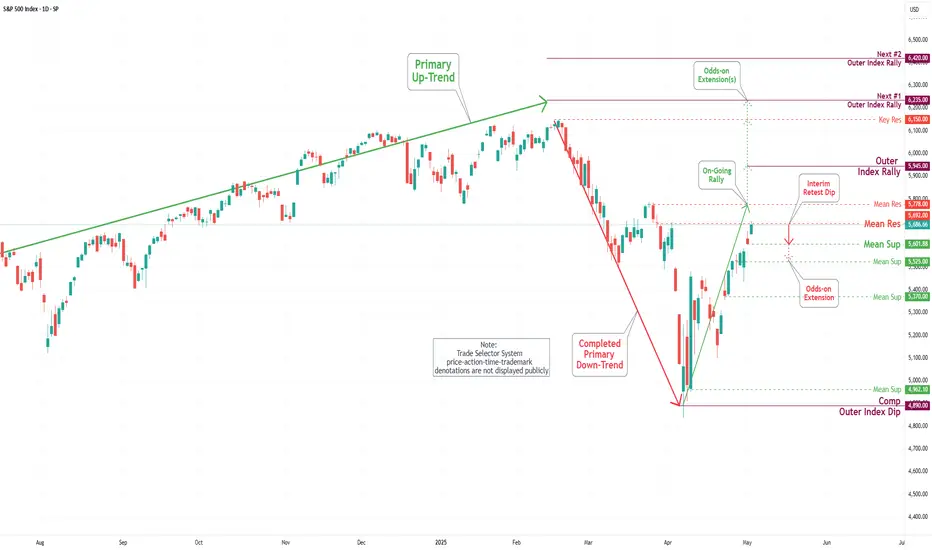
S&P 500 Daily Chart Analysis For Week of May 2, 2025Technical Analysis and Outlook:
During this week's trading session, the Index demonstrated a steady to higher price movement, achieving a key target at the Outer Index Rally level of 5550 and successfully surpassing the Mean Resistance level of 5672. This trajectory establishes the foundation for sustained upward momentum as it approaches the Mean Resistance level of 5778 and sets sights on reaching the next Outer Index Rally target marked at 5945. However, it is essential to acknowledge the substantial risk of a sharp retracement from the current price level to the Mean Support level of 5601, with the potential for further decline to the Mean Support level of 5525.
EUR/USD Daily Chart Analysis For Week of May 2, 2025Technical Analysis and Outlook:
The Euro currency has shown weakness in this week's trading session and is resting at the Mean Support designation marked at 1.128. The current trajectory indicates that the Euro is targeted to the downside, with a Mean Support level of 1.119 and an Outert Currency Dip of 1.111. However, it is essential to recognize that upward dead-cat rebounds may re-emerge from the Mean Resistance level or Outer currency Dip.

Bitcoin(BTC/USD) Daily Chart Analysis For Week of May 2, 2025Technical Analysis and Outlook:
Bitcoin prices have significantly exceeded our previously completed Interim Rally 95000, thereby positioning the cryptocurrency to aim for the forthcoming Interim Coin Rally marked at 100000. Nevertheless, current price movements indicate a potential retracement toward the Mean Support level at 94000, with a further possible decline likely toward an additional Mean Support target at 91800. It is imperative to recognize the potential for upward momentum to develop from a retest of either support level, as this could facilitate a trajectory toward the next Interim Coin Rally at $100,000 and beyond.

AVGO -Break Test GO!This is a classic setup of a break structure, test the bottom, and GO!!!!
These moves are designed to provoke emotion, both to the downside and to the upside. They go up to give false hope and then rip it lower to deliver a perfect knockout combo.
Such setups are all over the charts in big names such as AAPL
Its better to be out of the market wishing you were in than in the market wishing you were out.
Take your profits and GTFO!

Major shift on the S&P 500: Is the bull market really over ?
After three years of almost uninterrupted gains, the U.S. market has finally shifted gears.
In early March, following a sharp escalation in trade tensions between China and the United States, the S&P 500 officially entered a bear market.
The tariff shock acted as a catalyst: buyers failed to defend critical levels, and the bullish momentum broke down.
Today, my scenario is clear:
I believe we are entering a wide range similar to what we saw in 2022, between 4700 and 5500 points.
In this controlled volatility environment, both investing and trading strategies must adapt.
💰 For long-term investing:
I'm staying fully in cash.
I prefer to wait until my personal indicator flashes green again before re-entering the market.
Patience is my best weapon in uncertain environments.
🎯 For swing trading:
The approach here is more active.
Each touch of the lower boundary (around 4700) will be considered a tactical buy, aiming to resell around 5500 points at the top of the range.
No rushing, no chasing moves: I only act at the extremes.

USOIL CAUTION! BREAK - TEST - GO!This is my new updated chart of Oil.
Trump's "Drill baby Drill" interfering with the free market is the absolute worst thing he could do. His ridiculous tariffs will put us in an economic depression!
Oil prices are driven by demand! As I have mentioned here on TV so many times before! Increasing supply while heading into a recession is the dumbest thing possible! You never want to consume your own oil when you can consume others first! Simultaneously, F your own nation's oil company's profit margins and gov tax revenue!
This is why we shouldn't put toddlers as POTUS!
Anyway!!! This is a break test go! setup!
If you haven't seen it before, here is an example I recently posted with AAPL.
Click Boost, follow, subscribe! Let's get to 5,000 followers so I can help them navigate these crazy markets too. ))

Is a Tesla Stock Rebound Imminent?Tesla's stock has recently faced volatility, partly due to first-quarter 2025 delivery figures that did not meet some market expectations. Despite this, several significant factors suggest a potential for upward movement in the share price. As the stock hovers around $292 in late April 2025, market observers are closely watching for catalysts that could shift sentiment and drive value appreciation for the electric vehicle and energy company.
Key indicators pointing towards a potential rebound include notable insider activity and the highly anticipated launch of a dedicated robotaxi service. A Tesla board member and Airbnb co-founder recently purchased over $1 million in TSLA stock, marking the first insider buy of this magnitude in approximately five years. This action signals strong internal confidence. Furthermore, the planned June launch of a robotaxi service in Austin, Texas, using autonomous Model Y vehicles, is viewed as a transformative step that could open substantial new revenue streams and redefine Tesla's market position.
Adding to the bullish sentiment is unusual activity in the options market, where a significant investor placed a large bet on a substantial price increase in the near term through out-of-the-money call options. While recent delivery misses and concerns regarding external factors have contributed to past stock pressure, the combination of insider conviction, a looming disruptive service launch, and aggressive bullish options trading suggests that the market may be poised for a significant reaction to upcoming positive developments. Investors are keenly focused on the successful execution of the robotaxi strategy as a critical determinant of future stock performance.

Invest in STRL: Ride the Coming US Digital Infrastructure Surge◉ Abstract
Sterling Infrastructure (NASDAQ: STRL) is a top pick to benefit from America's digital infrastructure boom, with the sector expected to grow 26% annually through 2034. The company specializes in data centers, 5G networks, and smart city projects, supported by a $1 billion backlog and improving profit margins. While risks like regional market shifts and housing demand exist, STRL's fundamentals are strong—revenue grew 7% in 2024, debt is manageable, and its P/E ratio (17.9x) looks cheap compared to peers (70.5x).
Technically, the stock shows bullish patterns after pulling back 35% from highs. With government infrastructure spending rising and strategic acquisitions likely, STRL could deliver 35-40% returns in the next 12-14 months. A good option for long term investing!
Read full analysis here...
◉ Introduction
The U.S. digital infrastructure market, valued at approximately USD 140 billion in 2024, is expanding rapidly, with a projected CAGR of 26.4% through 2034. This growth is driven by factors like the expansion of 5G networks, increased demand for data centers, rising cloud services adoption, AI automation, and investments in smart cities and edge computing. The 5G infrastructure segment alone is expected to grow at a CAGR of 20.2%, reaching USD 17.26 billion by 2030. North America holds a 42.8% share of the global market.
◉ Key Trends and Opportunities
1. Data Centers: Demand continues to rise, driven by cloud computing, AI, and data-intensive applications. Power availability and location are becoming critical, with providers moving to secondary markets to secure reliable energy sources.
2. Fiber Networks: Expansion is underway to support new data centers and remote connectivity needs. Middle-mile and long-haul fiber, as well as fiber-to-the-home (FTTH), are key areas of investment and consolidation.
3. 5G and Wireless: Ongoing rollout of 5G networks is fueling growth in hardware and network densification, with increased activity expected in wireless infrastructure and tower markets.
4. Edge Computing and Smart Cities: The proliferation of IoT devices and smart city initiatives is driving demand for edge data centers and low-latency networks.
5. Mergers and Acquisitions: The market is seeing consolidation, especially in fiber and data center segments, as major players acquire smaller firms to expand their footprint and capabilities.
Today, we’ll focus on Sterling Infrastructure (STRL), a key player navigating the U.S. infrastructure market.
This report provides a detailed look at STRL's technical and fundamental performance.
◉ Company Overview
Sterling Infrastructure Inc. NASDAQ:STRL is a U.S.-based company specializing in e-infrastructure, transportation, and building solutions. It operates through three key segments: E-Infrastructure Solutions, which focuses on site development for data centers, e-commerce warehouses, and industrial facilities; Transportation Solutions, handling infrastructure projects such as highways, bridges, airports, and rail systems for government agencies; and Building Solutions, providing concrete foundations and construction services for residential and commercial projects. Originally founded in 1955 as Sterling Construction Company, the firm rebranded to its current name in June 2022. Headquartered in The Woodlands, Texas, the company serves a wide range of sectors, including logistics, manufacturing, and public infrastructure.
◉ Investment Advice
💡 Buy Sterling Infrastructure NASDAQ:STRL
● Buy Range - 148 - 150
● Sell Target - 200 - 205
● Potential Return - 35% - 40%
● Approx Holding Period - 12-14 months
◉ SWOT Analysis
● Strengths
1. Strong E-Infrastructure Backlog – With over $1 billion in backlog, Sterling has a robust pipeline of future projects, ensuring sustained revenue growth.
2. Higher-Margin Services Shift – The company’s strategic focus on higher-margin work (21% gross profit margin in Q4) improves profitability without relying solely on volume.
3. E-Infrastructure Growth Potential – Expected 10%+ revenue growth and 25%+ operating profit growth in 2025 position Sterling for strong earnings expansion.
4. Strategic M&A Opportunities – Strong liquidity allows for accretive acquisitions, enhancing market share and service offerings.
5. Share Repurchase Program – Active buybacks reduce outstanding shares, potentially boosting EPS and shareholder value.
● Weaknesses
1. Texas Market Transition Risks – Moving away from low-bid work in Texas may slow revenue growth in the Transportation segment if not managed well.
2. Revenue Loss from RHB Deconsolidation – Excluding $236 million in RHB revenue could distort growth metrics and reduce reported earnings.
3. Residential Market Pressures – A 14% decline in residential slab revenue (due to DFW affordability issues) could persist if housing demand weakens further.
4. Geographic Expansion Challenges – High costs and logistical hurdles in expanding data center projects outside core regions may limit growth opportunities.
5. Competitive Bidding & Acquisition Risks – Difficulty in securing profitable acquisitions or winning competitive bids could hinder margin and revenue growth.
● Opportunities
1. Data Center & E-Commerce Boom – Rising demand for data centers and distribution facilities presents long-term growth potential for E-Infrastructure.
2. Government Infrastructure Spending – Federal and state investments in highways, bridges, and airports could boost Transportation Solutions revenue.
3. Strategic Acquisitions – Pursuing complementary M&A deals could expand capabilities and market reach.
4. Diversification into New Regions – Expanding into underserved markets could reduce dependency on Texas and mitigate regional risks.
5. Operational Efficiency Improvements – Further margin expansion through cost optimization and technology adoption.
● Threats
1. Economic Slowdown Impact – A recession could reduce demand for residential and commercial construction, affecting Building Solutions.
2. Rising Interest Rates – Higher borrowing costs may pressure profitability and delay large-scale projects.
3. Labor & Material Cost Inflation – Increasing wages and supply chain disruptions could squeeze margins.
4. Intense Competition – Rival firms competing for the same infrastructure projects may drive down pricing and profitability.
5. Regulatory & Permitting Delays – Government approvals and environmental regulations could slow project execution.
◉ Revenue & Profit Analysis
● Year-on-Year
➖ FY24 sales reached $2,116 million, reflecting a 7.28% increase compared to $1,972 million in FY23.
➖ EBITDA rose to $334 million, up from $264 million in FY23.
➖ EBITDA margin improved to 15.8%, up from 13.4% in the same period last year.
● Quarter-on-Quarter
➖ Q4 sales decreased to $499 million, down from $593 million in Q3, but showed a slight increase from $486 million in Q4 of the previous year.
➖ Q4 EBITDA was $80.3 million, down from $105 million in Q3.
➖ Q4 diluted EPS saw a notable rise, reaching $8.27 (LTM), up from $5.89 (LTM) in Q3 2024.
◉ Valuation
1. P/E Ratio (Price-to-Earnings)
● Current vs. Peer Average
➖ STRL’s P/E ratio is 17.9x, much lower than the peer average of 70.5x, suggesting the stock is undervalued compared to peers.
● Current vs. Industry Average
➖ Compared to the broader industry average of 22.9x, STRL again looks relatively inexpensive at 17.9x.
2. P/B Ratio (Price-to-Book)
● Current vs. Peer Average
➖ STRL’s P/B ratio stands at 5.7x, slightly higher than the peer average of 5x, indicating overvaluation.
● Current vs. Industry Average
➖ Against the industry average of 3.6x, STRL’s 5.7x P/B ratio suggests a noticeable overvaluation.
3. PEG Ratio (Price/Earnings to Growth)
➖ STRL’s PEG ratio is 0.21, which means the stock appears undervalued relative to its strong expected earnings growth.
◉ Cash Flow Analysis
➖ Sterling Infrastructure's operating cash flow grew to $497 million in FY24, up from $479 million in FY23, showing steady financial strength.
◉ Debt Analysis
➖ The company's debt-to-equity ratio is 0.38, indicating a healthy balance sheet with manageable debt levels.
◉ Top Shareholders
➖ The Vanguard Group has significantly increased its investment in this stock, now owning an impressive 8.3% stake, which marks a 30% rise since the end of the September quarter.
➖ Meanwhile, Blackrock holds a stake of around 8% in the company.
◉ Technical Aspects
➖ On the monthly chart, the stock remains in a strong uptrend.
➖ On the daily chart, an Inverted Head & Shoulders pattern has formed, signaling a potential breakout soon.
➖ The stock is currently trading at about 35% below its all-time high, making it an attractive investment opportunity.
◉ Conclusion
Sterling Infrastructure (STRL) stands out as a strong investment candidate, backed by solid financial performance, a growing E-Infrastructure backlog, and a strategic focus on higher-margin projects. Its attractive valuation, healthy cash flow, and low debt levels provide further confidence in its growth potential. While there are challenges—such as market competition, geographic expansion hurdles, and economic uncertainties—Sterling’s strengths, including a robust project pipeline, strategic acquisitions, and exposure to high-growth sectors like data centers and 5G infrastructure, offer a favorable risk-reward balance. Overall, Sterling is well-positioned to benefit from the ongoing U.S. e-infrastructure boom, making it an attractive long-term investment opportunity.

Gravions IG: Why Apple's Shift to India Could Trigger a Drop in Apple is betting heavily on changing its production geography, planning to move a significant portion of iPhone assembly from China to India by 2026. Analysts at Gravions IG have assessed the situation and concluded that this move could negatively impact the company’s stock value in the near term.
Key Risks of Production Relocation
Indian manufacturing facilities, although growing rapidly, have not yet achieved the level of quality and logistical efficiency seen at Chinese plants. Gravions IG emphasizes that reconfiguring production processes takes time, and potential disruptions in supply chains or reduced quality in the early batches could trigger dissatisfaction among consumers and partners.
According to their analysis, the transition could increase product costs and squeeze profit margins, putting pressure on Apple’s financial results over the next few quarters.
Investor Reactions
Current market behavior reflects investor caution: Apple's share price has already fallen nearly 17% since the start of the year, with technical indicators suggesting further declines. The formation of a "death cross" — where the 50-day moving average crosses below the 200-day moving average — heightens concerns about a prolonged downtrend.
Gravions IG stresses that until the Indian production lines are fully operational and stable, Apple's stock will likely remain under selling pressure.
Strategic Perspective: Opportunity or Risk?
In the long run, diversifying manufacturing could benefit Apple by reducing its dependence on China and insulating it from potential geopolitical or economic shocks. Additionally, the Indian government's efforts to bolster its manufacturing sector could provide Apple with a stronger foundation for future expansion.
Still, Gravions IG insists that until Indian facilities reach consistent quality and scale, Apple will be vulnerable to market sentiment swings and potential reputational risks.
Conclusion
Relocating production is a strategically sound but high-risk move for Apple in the short term. Gravions IG advises investors to closely monitor product quality and supply chain stability in India before making long-term investment decisions regarding Apple's stock.

Solvery IG Predicts Bitcoin to Reach $105,000 by May 10, 2025The cryptocurrency market continues to surprise even the most seasoned investors. Against this backdrop, the analytical firm Solvery IG has released an ambitious forecast: according to their calculations, Bitcoin's price could reach $105,000 by May 10, 2025.
Factors Supporting Bitcoin's Growth
In recent months, the market has shown strong positive momentum. Several key factors have contributed to this trend:
Institutional Investments: Major banks, funds, and corporations are increasingly incorporating Bitcoin into their portfolios as a hedge against risks.
Macroeconomic Instability: Inflationary pressures and weakening fiat currencies are driving investors to seek alternative assets.
According to Solvery IG experts, it is the combination of these factors that creates a "perfect storm" for the continued growth of the leading cryptocurrency.
Analysis and Potential Risks
Despite the optimistic forecast, potential threats should not be overlooked. The cryptocurrency market remains highly volatile. Possible tightening of regulations in the U.S. and Europe, as well as sudden shifts in Federal Reserve policies, could exert downward pressure on the market.
Nevertheless, Solvery IG highlights a crucial technical point: according to their data, Bitcoin has successfully held above key support levels between $60,000 and $65,000. This indicates strong buyer sentiment and supports expectations for a continued upward trend.
The impact of the halving event, which occurred in April 2024, should also be taken into account. Historically, Bitcoin has shown significant growth 12–18 months following a halving, and the current market behavior aligns closely with these cyclical patterns.
What This Means for Investors
If Solvery IG’s forecast comes true, Bitcoin would achieve more than a 50% increase compared to current levels. This presents significant opportunities for long-term investors. However, experts advise exercising caution, diversifying risks, and avoiding allocating all funds to a single asset.
Cryptocurrencies remain high-risk instruments, and successful investing requires a deep understanding of the market and a realistic assessment of all potential scenarios.
Conclusion
Solvery IG’s prediction of Bitcoin reaching $105,000 by May 10, 2025, sounds promising, especially given the positive momentum in recent months. However, investors should always remember: high returns come with high risks.

S&P 500 Daily Chart Analysis For Week of April 25, 2025Technical Analysis and Outlook:
In this week's trading session, the Index did steady to higher prices, distancing itself from the rendered obsolete Mean Resistance level of 5455 and targeting the next significant mark identified as Outer Index Rally 5550. This trend lays the groundwork for a continued upward movement; however, there is also a considerable risk of a sharp pullback to the Mean Support level of 5370 after reaching the Outer Index Rally at 5550.
Contrariwise, it is essential to acknowledge the possibility of upward momentum continuation resulting in meeting the primary target Outer Index Rally 5550 by challenging the Mean Resistance of 5672 and extending toward additional levels: Mean Resistance 5778 and Outer Index Rally 5945.

EUR/USD Daily Chart Analysis For Week of April 25, 2025Technical Analysis and Outlook:
In the most recent trading session, the Euro successfully retested the completed Outer Currency Rally level at 1.142 and completed the subsequent target identified within the Outer Currency Rally at 1.157. Consequently, the Euro experienced a firm decline to the Mean Support level of 1.131. However, it is essential to recognize that upward momentum may re-emerge, facilitating a retest of the Key Resistance level at 1.151 or potentially leading to a further decline toward the next support level designated as Mean Support at 1.119.

Bitcoin(BTC/USD) Daily Chart Analysis For Week of April 25, 2025Technical Analysis and Outlook:
Bitcoin experienced a significant rally in this week's trading session, breaking through all identified Mean Resistance levels: 86400, 90600, and 94500. This breakout led to the completion of the Interim Coin Rally at 88400. As a result, the newest identified Interim Coin Rally at 95000 has also been completed, indicating a possible pullback to the Mean Support at 92000 and a further decline potential toward an additional Mean Support target at 88500. However, it's important to recognize the chance of upward momentum emerging from a retest of the completed Interim Coin Rally at 95000, which could advance toward the next Interim Coin Rally at 100000.

$GOOGL primed for a BIG MOVE!NASDAQ:GOOGL primed for a BIG MOVE! 🚀
Heading into earnings, this stock’s valuation has been overlooked—but strong results could flip the narrative fast! 💨
✅ Bounced off 2021 highs
✅ RSI at its lowest since COVID
✅ Major indicators curling upward
✅ Volume shelf launch incoming
✅ Wr% pendulum swinging
Momentum is building—are you ready? 👀
Not financial advice

Bullish momentum in $NOW! 22% Upside🔥 Bullish momentum in $NOW!
🚀 $1,126 on the horizon! 🎯
✅ Indicators curling upward
✅ Volume shelf ready to launch
✅ Wr% swinging green to red
✅ Great earning/ guidance
Big move loading—are you in? 👀
Not financial advice

Recovery or Rejection for $LRCX?🚨 Recovery or Rejection for NASDAQ:LRCX ?
Lam Research is up 10%+ on strong earnings & guidance—but it’s testing a key S/R zone!
🔹 Bullish above $76.70—watch for momentum 🚀
🔹 Bearish if rejected—potential pullback 📉
Big move incoming—what’s your read? 👀

The Ruble's Unlikely Triumph: What's Driving It?The early months of 2025 have seen the Russian Ruble emerge as the world's top-performing currency, achieving a significant appreciation against the US dollar. This unexpected rally is largely attributed to robust domestic economic measures. Faced with persistent inflation exceeding 10%, the Central Bank of Russia implemented a stringent monetary policy, raising the key interest rate to a high of 21%. This aggressive stance not only aims to curb price growth but also makes the Ruble highly attractive to foreign investors seeking elevated yields through carry trade strategies, thereby increasing demand for the currency. Furthermore, a healthy trade surplus, marked by increased exporter conversion of foreign earnings, has bolstered the Ruble's supply-demand dynamics.
Beyond internal economics, shifting geopolitical perceptions have played a vital role. Growing market anticipation of a potential ceasefire in the Ukraine conflict has notably reduced the perceived political risk associated with Russian assets. This improved sentiment encourages some international investors to return cautiously to Russian markets. Concurrently, a weakening trend in the US dollar, influenced by evolving US trade policies, has amplified the Ruble's relative strength on the global stage.
Strategically, Russia's ongoing efforts to decrease its reliance on the US dollar are also providing underlying support for the Ruble. Initiatives promoting trade settlements in national currencies, such as recent agreements enabling Ruble payments with Cuba, reflect a long-term pivot towards establishing alternative financial channels. However, this Ruble strength presents challenges, particularly for the state budget heavily dependent on converting dollar-denominated oil revenues. A stronger Ruble yields fewer domestic funds, potentially straining finances, especially amidst volatile global oil prices. The balancing act between maintaining high rates to control inflation and mitigating their impact on domestic credit and investment remains a critical consideration for policymakers.
