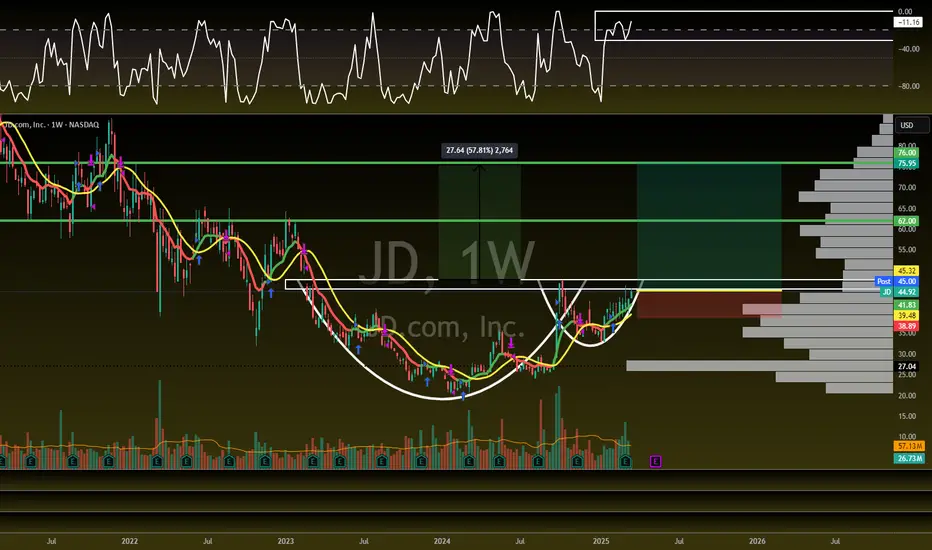
China Trade Setup with 67% Upside!NASDAQ:JD - H5_W Trade Setup: 🚨
CupnHandle Breakout =
🎯$62
📏MM: $76
- Multi Year CupnHandle
- Green H5_W
- Volume Shelf with GAP
- Thriving WCB
- China is HOT!
Not financial advice
Investing
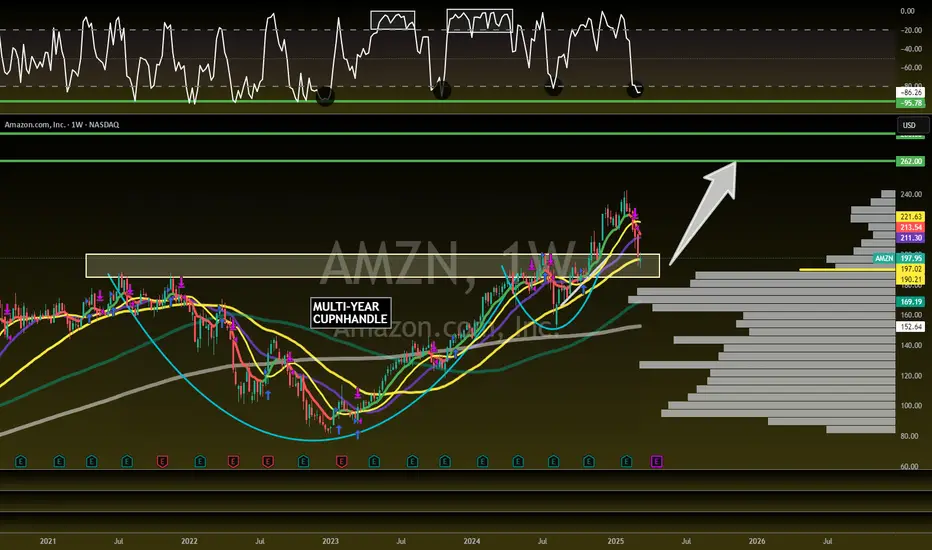
Amazon is the FULL PACKAGE! 62% UpsideNASDAQ:AMZN - H5_W Trade Setup: 🚨
Confirmed CupnHandle Retest =
🎯$262 🎯$280
📏MM: $310
- Multi-Year CupnHandle
- Massive weekly volume shelf
- Green Support Beam on Wr%
- Undervalued MOAT Company
Not financial advice

A NEW China Name just getting Started! 80% UpsideNASDAQ:BIDU - H5_W Trade Setup: 🚨
Breakout = 🎯$155 - 50% Higher 🚀
- Double Bottom
- WCB Forming
- H5_W is Green
- Volume Shelf
- China is Bullish
Not financial advice

EUROPE VS US Stock Dramatic Moves CAUTION!Zelenskyy Oval office ambush did much more than ambush and betray an ally in support of a dictator like Putin.
Betraying an ally destroyed the trust in the U.S. government. Without trust in the government, democracy cannot be, leaving only a dictatorship capable of surviving.
Markets have spoken very loudly with trillions of dollars, not words out of people's mouths.
Superpowers are only as strong as their allies. Isolationism doesn't work. Ask N. Korea, The Soviets etc.. why that is.
Trust can not be granted nor taken, it may only be lost.
CAUTION IS IN ORDER!

breakdown of the setup! Read CaptionThis is a 4-hour chart of Gold (XAU/USD) showing a bullish channel with price currently trading near its upper boundary. Here’s a breakdown of the setup:
Market Structure:
Trend: Gold is in a strong uptrend, moving within a well-defined ascending channel.
Current Price: Around $2,998, with a recent high of $3,000.55.
Key Target: A potential bullish breakout targeting $3,020+.
Support Zones: Highlighted between $2,930 - $2,860 as possible retracement levels.
Potential Scenarios:
Bullish Continuation: If price holds above the midline of the channel, a push toward $3,020 - $3,050 could be expected.
Pullback & Retest: A minor correction toward $2,970 - $2,960 before resuming its uptrend.
Deeper Retracement: A stronger pullback could lead to a test of $2,930 or even $2,860, aligning with the lower trendline.
Trading Plan:
Buy on dips if price retests lower support zones within the channel.
Breakout trade above $3,020 could indicate further upside potential.
Risk management: Watch for bearish rejection candles near resistance.
This setup favors bullish continuation, but a short-term pullback is possible before the next leg up. 📈🔥

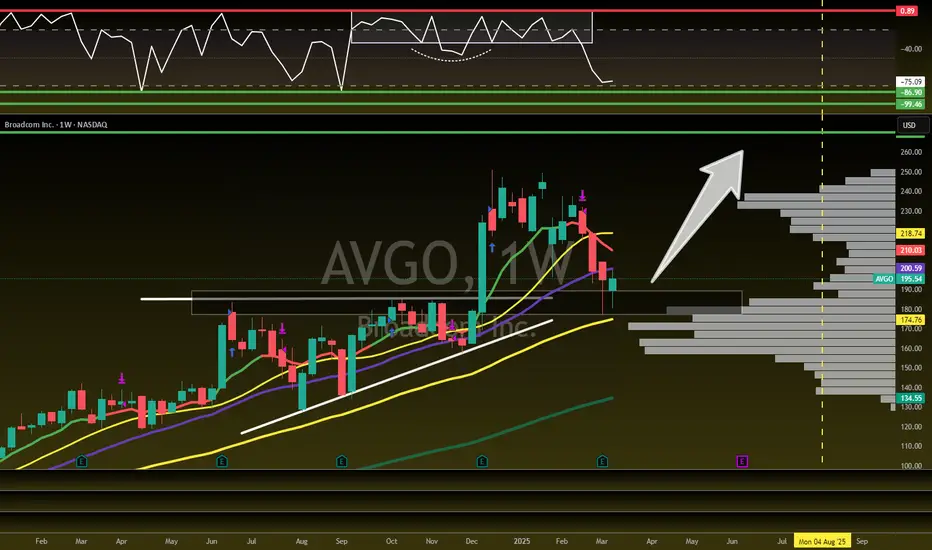
AVGO - It's time to Turnaround and GO!NASDAQ:AVGO
Monster Earnings and Move have been shrugged off...
- Ascending Triangle Successful Retest
- 50 WMA Successful Retest
- Volume Shelf
- Key S/R Zone
- Green Support Beam on Wr%
If market gets going then Broadcom is heading to $270 QUICK!
Not financial advice
AMD - Advanced Money Destroyer...Not For Long!NASDAQ:AMD
Has been decimated but the DIP BUY BOX holds strong! $85-$100 could lead to an easy 2x!
- Key S/R Zone
- Massive Volume Shelf
- Bearish WCB Breakout will give Bullish Cue
- Lowest RSI since 2022 BOTTOM
A turnaround here could lead to outsized performance in portfolios.
Not financial advice

Amazon is about to DELIVER! 32% UpsideNASDAQ:AMZN
Great Risk/Reward here!
Confirmation of Retest = 🎯$262
- Right at CupnHandle Retest area
- Volume Shelf Support
- 50WMA
- Wr% Green Support Beam
Not financial advice
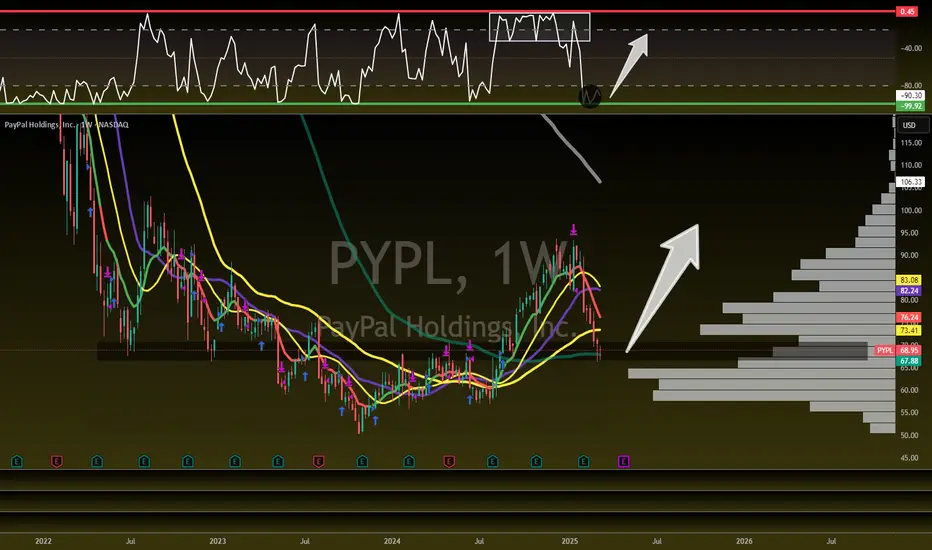
PayPal is too cheap to ignore here!NASDAQ:PYPL
Undervalued and looking for a turnaround spot!
I believe this is a good R/R area:
$66-$70 S/R Zone
Also, has 100D MA Support and wicking hard at this area showing buyers coming in to stop the bleeding.
Not Financial Advice
AmazonAmazon should definitely reach 151.37 (even if it moves up again, it will start to move down again)

Why DCA Does Not Work For Short-Term TradersIn this video I go through why DCA (Dollar Cost Averaging) does not work for short-term traders and is more suitable for investors. I go through the pitfalls than come through such techniques, as well as explain how trading should really be approached. Which at it's cost should be based on having a positive edge and using the power of compounding to grow your wealth.
I hope this video was insightful, and gives hope to those trying to make it as a trader. Believe me, it's possible.
- R2F Trading

S&P 500 Daily Chart Analysis For Week of March 14, 2025Technical Analysis and Outlook:
During the recent weekly trading session, the S&P 500 reached the designated target of the Outer Index Dip at 5576, showing considerable volatility. On the last day of the trading session, the index experienced a significant rebound, leading to an impressive upward trajectory from that position. As a result, it is now aiming for the Inner Index Rally target set at 5712, with a potential subsequent target identified at the Mean Resistance level of 5840. Therefore, upon reaching the Inner Index Rally target 5712, or if there is a decline from its current price level, the index is expected to retest the completed Outer Index Dip at 5521, potentially reinstating the upward rally.

EUR/USD Daily Chart Analysis For Week of March 14, 2025Technical Analysis and Outlook:
As indicated in the analysis from the previous week, the Euro has commenced an upward trend, successfully retesting the completed Inner Currency Rally at 1.086 and advancing toward the Mean Resistance level at 1.093. Consequently, the currency is currently experiencing a retreat and is directing its focus toward the Mean Support level at 1.078, possibly declining further to the Mean Support level at 1.061. Conversely, should the anticipated downward trend fail to materialize, it is plausible that the Eurodollar will retest the Mean Resistance level at 1.093 and subsequently aim for the completed Outer Currency Rally level of 1.124, traversing Key Resistance at 1.119 along the way.

Bitcoin(BTC/USD) Daily Chart Analysis For Week of March 14, 2025Technical Analysis and Outlook:
In the current week's trading session, Bitcoin has made multiple hits by retesting our completed Outer Coin Dip 78800 on Sunday and Monday. Consequently, the cryptocurrency has experienced a significant uptrend, reaching the inverse (Resistance) Mean Sup 84700 level. This upward oscillation indicates a potential for further price rally and suggests a likelihood of advancing toward the target designated as the Interim Coin Rally 88400. Such developments could facilitate an extension toward the supplementary target of Mean Res 94500 and beyond. If there is a decline from Interim Coin Rally 88400 or its current price level, the coin is expected to retest the completed Outer Coin Dip 78700, potentially reinstating the upward rally.

OKTA - CupnHandle Trade Setup! 61% Upside🚨 H5_L Trade Setup NASDAQ:OKTA 🚨
NOT EVERYTHING IS IN FREEFALL!
🍵BREAKOUT = 🎯$139 🎯$185
Entry: $117.29
5/1 RR - S/L: $103.55
Not in a straight line though friends!
NOT FINANCIAL ADVICE

XAU/USD: Gold – Glittering Gains or Gilded Trap?(1/9)
Good evening, everyone! 🌙 XAU/USD: Gold – Glittering Gains or Gilded Trap?
With gold at $2,984.40, is this safe-haven star shining bright or setting up for a fall? Let’s mine the truth! 🔍
(2/9) – PRICE PERFORMANCE 📊
• Current Price: $ 2,984.40 per ounce as of Mar 14, 2025 💰
• Recent Move: Near $3,000, up from recent trends, per data 📏
• Sector Trend: Precious metals hot with trade tensions, rate cut bets 🌟
It’s a shiny ride—let’s see what’s fueling it! ⚙️
(3/9) – MARKET POSITION 📈
• Global Role: Safe-haven asset, industrial use in electronics ⏰
• Supply Dynamics: Central bank buying, mining output steady 🎯
• Trend: Geopolitical risks pushing demand, per posts on X 🚀
Firm as a rock in uncertain times! 🏦
(4/9) – KEY DEVELOPMENTS 🔑
• Trade Tensions: U.S.-China tariff threats boosting safe-haven appeal 🌍
• Rate Cuts: Fed easing bets supporting prices, per data 📋
• Market Reaction: Near record highs, showing strength 💡
Riding waves of global chaos! 🌊
(5/9) – RISKS IN FOCUS ⚡
• Economic Recovery: Could dampen safe-haven demand 🔍
• Market Sentiment: Sudden risk-on shifts might trigger a sell-off 📉
• Supply Boost: Increased mining could cap gains ❄️
It’s a glittering gamble—watch out! 🛑
(6/9) – SWOT: STRENGTHS 💪
• Safe-Haven Demand: Gold thrives in uncertainty 🥇
• Central Bank Buying: Steady support from global reserves 📊
• Green Energy: Use in renewables adds industrial demand 🔧
Got a golden edge in tough times! 🌟
(7/9) – SWOT: WEAKNESSES & OPPORTUNITIES ⚖️
• Weaknesses: High prices risk a correction if tensions ease 📉
• Opportunities: Escalating trade wars, infrastructure spending 📈
Can it break $3,000 and hold? 🤔
(8/9) – POLL TIME! 📢
Gold at $2,984.40—your take? 🗳️
• Bullish: $3,100+ soon, safe-haven rally continues 🐂
• Neutral: Steady near $3,000, risks balance out ⚖️
• Bearish: $2,800 looms, correction ahead 🐻
Chime in below! 👇
(9/9) – FINAL TAKEAWAY 🎯
Gold’s $2,984.40 price reflects safe-haven strength 📈, but it’s not cheap—volatility’s our ally. DCA-on-dips could catch a dip below $3,000 for a long-term win. Gem or bust?

Learn To Invest: Global Liquidity Index & BitcoinGlobal Liquidity Index & BitCoin:
🚀 Positive Vibes for Your Financial Journey! 🚀
BITSTAMP:BTCUSD
Look at this chart! It's the Global Liquidity Index , a measure of how much extra money is flowing through the world's financial systems.
Why is this important? Because when this index is high, it often means good things for investments like #Bitcoin! 📈
Think of it like this: when there's more money flowing, people are often more willing to take risks and invest in things like Bitcoin.
See those "BullRun" boxes? That means things are looking bright! It's showing that money is flowing, and that's often a good sign for potential Bitcoin growth. 🌟
Even if you're not a pro, it's easy to see the good news here. Understanding these trends can help you make smarter decisions.
Let's all aim for growth and success! 💪

TRANSPORTATION! CRACK!!The transportation average breaking the first time warned us that things were not right back in July 2024. Today we are getting yet another CRACK WARNING!
The TRUMP economy will be a disaster area if he doesn't change his ways quickly. Even then it may be too late. Trust in the government has eroded.
Democracy and markets rely on TRUST! Trust can not be bought, or taken, it may only be lost!
DANGER for bulls!
last month I started to warn about Airlines (JETS) since then the results speak for themselves.
Click like, follow subscribe for more!

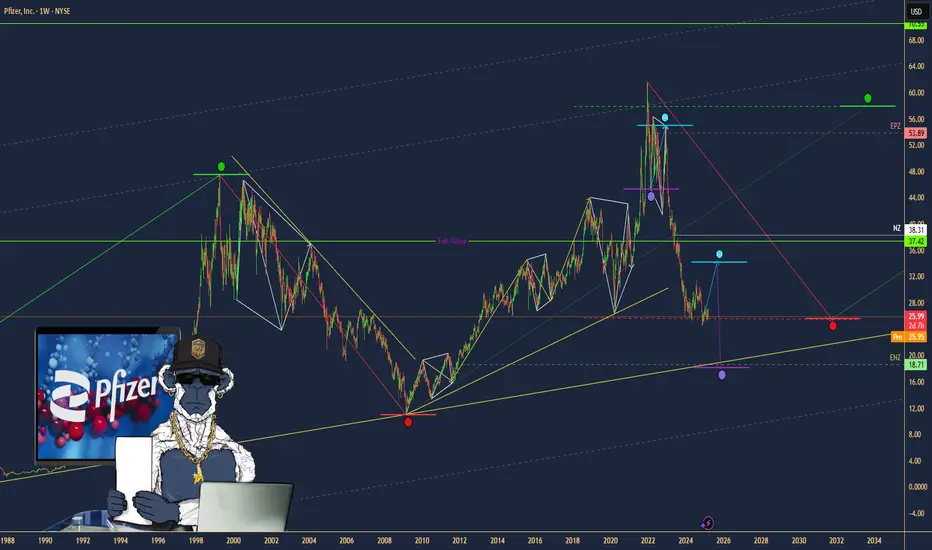
Pfizer ($PFE): Undervalued Pharma Giant with Growth Potential?(1/9)
Good afternoon, everyone! 😊
Pfizer ( NYSE:PFE ): Undervalued Pharma Giant with Growth Potential?
With PFE at $25.90, is this the time to buy into this pharmaceutical powerhouse? Let’s dive in! 😎
(2/9) – PRICE PERFORMANCE
• Current Price: $25.90 as of March 12, 2025 😏
• Recent Moves: Trading within a range of $24 to $28, currently near the middle 😬
• Sector Vibe: Pharma sector remains stable, with new drug approvals driving growth 📈
Short commentary: The stock seems to be consolidating. Is this a good entry point? 🤔
(3/9) – MARKET POSITION
• Market Cap: Approximately $147.2 billion (assuming 5.67 billion shares outstanding) 💰
• Operations: Global pharmaceutical company with a diverse product portfolio 🛡️
• Trend: Strong Q4 2024 earnings and reaffirmed 2025 guidance 🚀
Short commentary: Pfizer’s fundamentals are solid, with consistent revenue and earnings projections. 😉
(4/9) – KEY DEVELOPMENTS
• Reaffirmed 2025 revenue guidance of $61-64 billion and EPS of $2.80-3.00 📈
• Continued focus on new drug developments and expanding into emerging markets 🌐
• Achieved cost savings goals and ongoing optimization programs for improved margins 💡
Short commentary: The company is managing its costs effectively and looking to future growth. Let’s watch closely. 👀
(5/9) – RISKS IN FOCUS
• Legal challenges related to past products ⚙️
• Competition from generic manufacturers and patent expirations 📉
• Economic conditions affecting healthcare spending ⚠️
Short commentary: These risks are known, but Pfizer’s diverse portfolio should help mitigate them. Stay vigilant! 🕵️
(6/9) – SWOT: STRENGTHS
• Diverse product portfolio across multiple therapeutic areas 🏆
• Strong R&D capabilities and pipeline of new drugs 🌈
• Global presence and distribution network 🌟
Short commentary: Pfizer’s strengths position it well for long-term growth. Keep up the good work! 👍
(7/9) – SWOT: WEAKNESSES & OPPORTUNITIES
• Weaknesses: Dependence on key products, legal issues ⚠️
• Opportunities: New drug approvals, expanding into emerging markets 🌐
Short commentary: Opportunities abound, but weaknesses need to be monitored. Let’s hope they nail it! 📈
(8/9) – PFE at $25.90 – what’s your call? 🗳️
• Bullish: Price could rise to $30+ if it breaks above $28 🚀
• Neutral: Price remains between $24 and $28 😐
• Bearish: Price could drop to $22 if it breaks below $24 📉
Drop your pick below! 💬
(9/9) – FINAL TAKEAWAY
Pfizer’s $25.90 stance shows a company with solid fundamentals and a fair valuation at a P/E of approximately 8.93. With a strong pipeline and cost management, it’s an attractive option for value investors. Keep an eye on resistance at $28 for potential upside movement. Snag low, hold long!
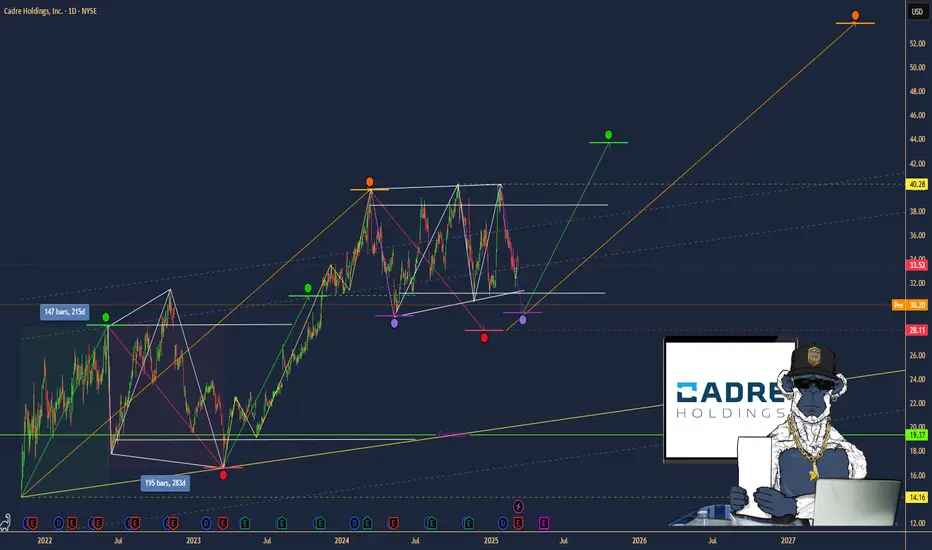
$CDRE: Cadre Holdings – Riding the Safety Wave?(1/9)
Good afternoon, everyone! 😊
NYSE:CDRE : Cadre Holdings – Riding the Safety Wave?
With CDRE at $30.20, is this stock a safe bet or a risky ride? Let's dive into the world of safety gear and see if Cadre's holdings hold up! 😎
(2/9) – PRICE PERFORMANCE
• Current Price: $30.20 as of March 12, 2025 😏
• Recent Moves: Down 11% from $34.02 a week ago 😬
• Sector Vibe: Safety equipment sector is growing, driven by stricter regulations and demand for safer workplaces. 📈
Short commentary: The stock's taken a hit, but the sector's looking good. Maybe it's just a temporary dip? 🤔
(3/9) – MARKET POSITION
• Market Cap: Approximately $1.23 billion 💰
• Operations: Manufacturing and distributing safety and survivability products for law enforcement, first responders, military, and now, the nuclear market. 🛡️
• Trend: Expanding into new markets with the acquisition of nuclear safety brands. 🚀
Short commentary: They're diversifying, which is usually a good sign. More markets mean more opportunities. 😉
(4/9) – KEY DEVELOPMENTS
• Acquisition of Carr's Engineering Limited's Engineering Division for nuclear safety solutions, announced on January 16, 2025. 📈
• Expected to close in the first half of 2025. ⌛
• Market Reaction: The stock has seen a recent dip, possibly reflecting integration concerns or broader market volatility. 😐
Short commentary: This should bring in new revenue streams and expand their international presence. Let's see how it plays out. 🌍
(5/9) – RISKS IN FOCUS
• Integration risks from the acquisition. ⚙️
• Supply chain disruptions. 🚚
• Regulatory changes in the nuclear sector. 📜
Short commentary: These are all things to keep an eye on, but every company has some risks. Stay vigilant! 🕵️
(6/9) – SWOT: STRENGTHS
• Strong reputation in safety equipment. 🏆
• Diverse product portfolio. 🌈
• Recent acquisition expanding into the nuclear market. 🌟
Short commentary: They're well-known and have a broad range of products, which is great. Keep up the good work! 👍
(7/9) – SWOT: WEAKNESSES & OPPORTUNITIES
• Weaknesses: Potential over-reliance on government contracts, integration challenges. ⚠️
• Opportunities: Growth in nuclear safety market, increasing global demand for safety products. 🌐
Short commentary: They need to manage their dependencies and make sure the acquisition goes smoothly, but there's a lot of potential for growth. Let's hope they nail it! 📈
(8/9) – CDRE at $30.20 – what's your call? 🗳️
• Bullish: Price could rise to $35+ soon, due to successful acquisition and sector growth. 🚀
• Neutral: Price remains steady, as the market digests the acquisition news. 😐
• Bearish: Price could drop to $25, due to integration risks and market volatility. 📉
Drop your pick below! 💬
(9/9) – FINAL TAKEAWAY
Cadre Holdings' $30.20 stance shows a robust portfolio and strategic expansion, but recent price dips and integration risks are concerns. Volatility’s our ally—dips are DCA treasure. Snag low, soar high!
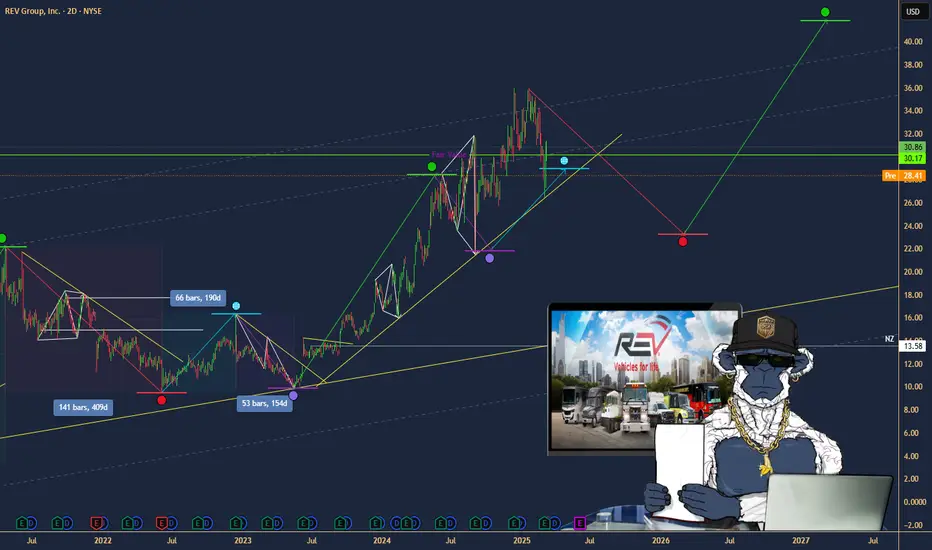
$REVG: REV Group – Riding the Specialty Vehicle Wave?(1/9)
Good morning, everyone! 😄
NYSE:REVG : REV Group – Riding the Specialty Vehicle Wave?
With NYSE:REVG at $31.00, is this stock revving up for growth or hitting a speed bump? Let’s dive into the details! 😎
(2/9) – PRICE PERFORMANCE 📊
• Current Price: $32.00 as of 12-03-2025 😊
• Recent Moves: Up from last month, showing steady growth. 📈
• Sector Vibe: Specialty vehicles sector is stable, with consistent demand from public services and commercial clients. 🚒🚜
Short commentary: REVG’s price is on an upward trajectory, reflecting positive market sentiment. Let’s see what’s driving this! 🚀
(3/9) – MARKET POSITION 📈
• Market Cap: Approximately $1.75B (based on 52.13M shares * $32.00) 💰
• Operations: Designs, manufactures, and distributes specialty vehicles like fire trucks, ambulances, and recreational vehicles. 🚓🏎️
• Trend: Increasing focus on customization and technology integration in vehicles. ⚙️
Short commentary: REVG is a key player in the niche market of specialty vehicles, with a diverse portfolio that caters to various sectors. Their market position seems solid. 🌟
(4/9) – KEY DEVELOPMENTS 🔑
• Exited bus manufacturing business by selling ElDorado National, focusing on core segments. 🚐
• Provided fiscal 2025 guidance, showing confidence in future performance. 📈
• Increased quarterly dividend by 20%, signaling strong cash flow and shareholder value focus. 💸
Market Reaction: Positive, with stock price reflecting these developments. Investors are optimistic about the company’s strategic moves. 😃
Short commentary: These developments suggest that REVG is streamlining its operations and focusing on more profitable areas, which should benefit shareholders. 👏
(5/9) – RISKS IN FOCUS ⚠️
• Economic slowdown could reduce demand for new vehicles, especially in the commercial sector. 🌦️
• Supply chain disruptions might affect production schedules and costs. 🚚
• Increased competition in the recreational vehicles segment. 🏕️
Short commentary: While there are risks, REVG’s diversified portfolio and focus on essential services might mitigate some of these challenges. It’s important to monitor these factors closely. 🕵️
(6/9) – SWOT: STRENGTHS 💪
• Strong brand portfolio with recognized names in the industry. 🏆
• Diverse customer base across public services and commercial clients. 🌐
• Recent strategic decisions to exit less profitable segments. 🚫
Short commentary: REVG’s strengths lie in its well-established brands and broad customer reach, which provide stability and growth opportunities. 💪
(7/9) – SWOT: WEAKNESSES & OPPORTUNITIES ⚖️
• Weaknesses: Dependence on economic conditions and potential regulatory changes. 📜
• Opportunities: Growth in the fire and emergency segment due to increased public safety spending. 🚒
Short commentary: While there are weaknesses tied to external factors, the opportunities in expanding sectors like fire and emergency services could drive future growth. It’s a balancing act! ⚖️
(8/9) – 📢REV Group at $32.00, with recent positive developments—your call?
• Bullish: $40+ soon, due to strategic focus and increased dividend. 🚀
• Neutral: Steady growth, maintaining current trends. 🛴
• Bearish: $25 drop, if economic conditions worsen. ⬇️
Drop your pick below! 😄
(9/9) – FINAL TAKEAWAY 🎯
REV Group’s $31.00 stance shows resilience and strategic planning, but economic risks linger. Volatility’s our ally—dips are DCA treasure. Snag low, soar high! Will it rev up or slow down?
$DG: Dollar General – Discount Dynamo or Bargain Bust?(1/9)
Good afternoon, folks! ☀️ NYSE:DG : Dollar General – Discount Dynamo or Bargain Bust?
NYSE:DG ’s at $82, riding a rocky retail road! Is this budget king stacking cash or just scraping by? Let’s rummage through the bins! 🔍
(2/9) – PRICE PERFORMANCE 📊
• Current Price: $ 82
• Recent Moves: Down 0.78% from Mar 7 close, per web data 📏
• Sector Vibe: Retail shaky, but discounts hold appeal 🌟
It’s a bumpy ride with a bargain twist! 🚛
(3/9) – MARKET POSITION 📈
• Market Cap: ~$18B (219.93M shares) 🏆
• Operations: 20,000+ stores, rural retail champ ⏰
• Trend: X posts hint at turnaround hopes 🎯
Tough, but planted firm in small towns! 🏡
(4/9) – KEY DEVELOPMENTS 🔑
• Analyst Takes: Bernstein’s $90 PT, per X 🔄
• Store Push: 575 new stores planned for 2025 🌍
• Market Mood: Mixed—soft sales vs. value focus 📋
Chugging along, eyes on the prize! 💪
(5/9) – RISKS IN FOCUS ⚠️
• Consumer Woes: Low-income pressure, per X 🔍
• Competition: Walmart, Dollar Tree crowding in 📉
• Margins: Profit dips spook, per web data ❄️
Risks stalk like aisle lurkers! 🕵️
(6/9) – SWOT: STRENGTHS 💪
• Scale: 20,000+ stores, rural reach 🥇
• Value Play: Budget shoppers’ haven 📊
• Growth: New store spree in 2025 🔧
A lean, mean discount machine! 🛒
(7/9) – SWOT: WEAKNESSES & OPPORTUNITIES ⚖️
• Weaknesses: Margin squeeze, soft sales 📉
• Opportunities: Reinvestment, consumer shift 📈
Can it turn pennies into profit? 🤔
(8/9) – 📢DG at $82, retail’s rough—your guess? 🗳️
• Bullish: $95+ soon, value shines 🐂
• Neutral: Flatline, risks weigh ⚖️
• Bearish: $70 crash, margins fade 🐻
Cast your lot below! 👇
(9/9) – FINAL TAKEAWAY 🎯
DG’s $82 stance shows grit 📈, but retail’s a grindstone 🌾. Volatility’s our sidekick—dips are DCA gems 💰. Snap ‘em up, rise steady! Paydirt or pyrite?

Unipro UPRO Stock Technical Analysis and Fundamental Analysis📊 Technical Analysis of Unipro ( RUS:UPRO ) Stock
Current Price: 2.043 RUB (+2.46%)
Trend: The stock is in a growth phase, but signs of overbought conditions are emerging.
RSI (14): 78.91 (overbought, possible correction ahead)
MACD (12,26,9): +0.13 (bullish signal, but a reversal is possible)
Support Levels: 1.95 RUB and 1.80 RUB
Resistance Levels: 2.10 RUB and 2.30 RUB
Entry Points:
A pullback to 1.95 RUB may be a good opportunity for long positions.
If the price consolidates above 2.10 RUB, further growth toward 2.30 RUB is likely.
Stop-Loss: 1.85 RUB (if breached, the trend could reverse downward)
📈 Fundamental Analysis
Financial Performance:
Revenue remains stable, but growth rates are slowing.
Net profit declined in 2024 due to rising operating expenses.
Debt burden is low, ensuring resilience to macroeconomic shocks.
Impact of the Russian Central Bank:
The high key interest rate is limiting market capitalization growth.
Investors are waiting for rate decisions—any cuts could accelerate stock growth.
Dividends:
Expected to remain at 6 RUB per share.
Dividend yield remains attractive for long-term investors.
Macroeconomic Factors:
External sanctions and political risks may influence business growth.
A potential IPO of RTK-DPC (a Unipro subsidiary) could strengthen the company’s financial position.
🔍 Conclusion
Short-term: The stock may experience a correction due to overbought conditions. The best entry point is around 1.95 RUB.
Mid-term: If the price consolidates above 2.10 RUB, growth toward 2.30 RUB is likely.
Long-term: Unipro remains attractive for investors focused on dividends and stability.
❗ Keep an eye on Russian Central Bank decisions and overall market sentiment.
