GOLD - The Time Has Come!Gold
XAU/USD
Hello All!
Over the last 10+ Years, Gold has formed a massive Cup & Handle Formation. If you do a quick Google search "Cup and Handle Trading" you will see this exact formation playing out currently. Gold is the world's largest asset class by market cap and traditionally it has been a hedge to inflation. As we know recently inflation rates have been much higher compared to the past.
A break above the downward dotted trend line resistance could send Gold to new all-time highs and beyond. Long-Term Investors and Traders keep this in mind during 2022 watch these key levels.
Also, check out my next post to see what will happen to Silver a possibly even better opportunity!
Investingopportunity

Will inflation peak this week? 14 Feb – 19 Feb, 2022*Please note; The author is working from UTC +13 when determining the timeline of data releases.
Will inflation peak this week?
14 Feb – 19 Feb, 2022
Six significant inflation rate figures will keep investors on their toes almost every day of this week, with the most important data concentrated on Wednesday trading.
Bear in mind the expectations for most of the inflation data figures are strongly suggesting that inflationary pressure has already peaked. So, watch out for deviations from these hopeful expectations.
Tuesday, February 15:
India Inflation Rate YoY JAN
The week opens with India's Inflation Rate YoY to January. The data is released on Tuesday morning, and the market is expecting India's Inflation Rate to rise to 6.0% from the current 5.59%.
The Indian Rupee is trading at a 7-week low against the US Dollar and a 3 ½- month low against the British Pound. The Rupee's weakness so far (and possibly to continue after Tuesday's data release) can be explained, in part, by the Reserve Bank of India less-hawkish stance than the US Federal Reserve and the Bank of England concerning raising interest rates. India's Inflation Rate hitting 6.0% isn't expected to radically alter the Reserve Bank of India's relatively less-hawkish stance.
Wednesday, February 16:
China Inflation Rate YoY JAN
UK Inflation Rate YoY JAN
South Africa Inflation Rate YoY JAN
Expect three inflation rate data releases across Wednesday afternoon that may have the most considerable impact on this week's trading.
In order of appearance:
China's Inflation Rate YoY to January is forecast to fall from 1.5% to 1.00%.
The UK's Inflation Rate YoY to January is forecast to remain flat at 5.4%.
The direction that South Africa's Inflation Rate YoY to January is expected to head is contentious. The majority of the market expects the South African Inflation Rate to subdue a fraction of a percentage point from 5.9% to 5.7% or 5.6%. However, TradingEconomics is forecasting a rise to 6.0%.
Thursday, February 17:
Canada Inflation Rate YoY JAN
Canada's Inflation Rate YoY to January, released very early Thursday morning, is forecast to remain flat at 4.8%.
Thursday’s result may force investors to reconsider their exodus from the Canadian Dollar last week, as US Inflation hit a 40-year high and expectations for an aggressive US Federal Reserve response heightened.
The same forces could be in play this week but in the opposite direction. The Bank of Canada is on the edge of a more aggressive stance and hotter than expected inflation could essentially guarantee that it enacts its first post-pandemic interest rate increase on March 2.
Friday, February 18:
Japan Inflation Rate YoY JAN
Closing out the week is Japan's Inflation Rate YoY to January, released mid-day Friday. The market consensus is a mild increase to 0.9% from the current Inflation Rate of 0.8%.
As Japanese companies are extremely slow to hike prices, Japan's peak inflation may lag other nations and continue to rise above 0.9% in the ensuing months. For one, the Bank of Japan is expecting inflation to hit 1.1% YoY to April, but still well under the Banks target annual inflation of 2.0%. Consequently, the Bank of Japan is expected to maintain its ultra-loose monetary policy and its -0.1% short term benchmark interest rate for the foreseeable future.
As such, it might be a shock for the Japanese Yen to improve its position from its 5-year low against the US Dollar.

Sudarshan Chemical Heading for 720-760+Sudarshan Chemical setting up nicely, keep on radar for short to med-term. Looks like It's Heading for 720-760+
Consult your financial advisor before investing...

NAS100: Another bearish wave to follow on the W1 timeframe.We have now successfully reached the resistance of our rising channel. We now anticipate 4 to 7 weeks of bearish candles to reach our support before going bullish again.
The US100 represents the US technology's performance. The world of technology is moving forward, being enhanced on a daily. I predict NAS100 going to $67000 in the next 10 years. I would recommend buying NAS100 and hold it once we meet our channel resistance.
This is by far the best investment any trader or investor can make. As for now, we're selling.

SIMRAN FARMS 192 Now, Huge upmove possibleSIMRAN FARMS 192 Now, Huge up-move possible in med-term (6-12 Months)
Needs patience to see this multiplying
Do your research before investing....

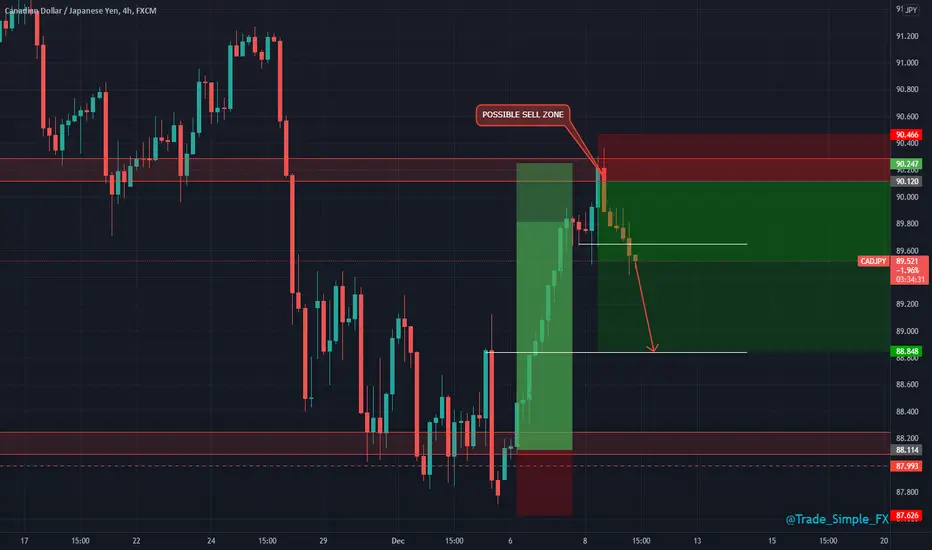
CADJPY H4 - Short SetupCADJPY H4
Snapshot of next anticipated move for this trading pair, seeing some really nice corrective selling pressure from our marked zone, hopefully we correct down to at least 800 price with the same momentum.
+5100 % return on MRIN stockFor risk-takers, this is for you, SAN FRANCISCO Marin Software, a leading provider of digital marketing software for performance-driven advertisers and agencies.
by studying the company file we noticed...
Volatility and Risk
Marin Software has a beta of -0.18, meaning that its share price is 118% less volatile than the S&P 500. Comparatively, Marin Software’s competitors have a beta of 1.37, meaning that their average share price is 37% more volatile than the S&P 500.
Data from Investing.com
Total Assets 37.01M (31/12/2020) 42.29M (31/12/2019) 46.79M (31/12/2018) 83.37M (31/12/2017)
Decreasing rate % from the year before :
-12.48 % 2020 -9.61 % 2019 - 43.87 % 2018
By looking on the cash situation
Cash From Operating Activities -5.67 M -1.24 M -12.98 M -4.87M
Cash From Investing Activities -1.88 M 1.61 M -2.71 M -2.52M
Cash From Financing Activities 10.23 M 0.26 M -1.29 M -1.45M
Net Change in Cash 2.71 M 0.60 M -17.33M -6.88 M
Total Long Term Debt 1.47 M 0.01 M - 1.69M
Dept ratio to assets 3.97 % 0.02 % - 2.02 %
=========================================
Net Profit margin 5YA -37.01% (for the company) 15.7%( for the industry)
Return on Assets 5YA -32.48% 9.13 %
Return on Investment 5YA -40.57% 12.97 %
=========================================
Price to Sales TTM 2.81 25.31
by looking to shareholders the top holders are
Stockholder Stake Shares owned (data from CNN business)
Susquehanna Financial Group LLLP 2.89% 447,414
Royce & Associates LP 2.80% 432,844
The Vanguard Group, Inc. 1.00% 154,543
Jane Street Capital LLC 0.81% 125,427
Schonfeld Strategic Advisors LLC 0.68% 105,600
Geode Capital Management LLC 0.63% 96,620
Nebula Research & Development LLC 0.41% 62,781
Bridgeway Capital Management LLC 0.39% 60,000
Cutler Group LP 0.35% 53,910
Dimensional Fund Advisors LP 0.34% 52,888
by reviewing the company file we express our opinion as MARIN is a high-risk good stock to buy even we can see the company file is not doing well, we can buy the dip of the company.
Position
------------------
Buy limit order at 1$ - 1.5$
-------------------------
Targeting:
-------------------------
22 $ - 23$ as first target
51 $ - 53.5 $ as second target
Investment period from 6 months to 18 months (estimated)
We expect +2200% to +5100% return for 18 months

ACN stock performance seems as a safe investmentAccenture plc is an Irish company that continues to be a grow-based multinational professional services company that specializes in IT services and consulting with 569,000 employees, 231.68 B market cap
After reviewing the company's financial reports from (yahoo finance)
we can take an overview about the company performance in the last 3 years is rising straight
THE NET INCOME
5,906 B in 30/8/2021 +799 M +15.64 %
5,107 B in 30/8/2020 + 328 M +6.86 %
4,779 B in 30/8/2019 + 720 M +17.73 %
4,059 B in 2018
------------------------------------------
TOTAL ASSETS
43,176 B in 30/8/2021 + 6,098 B +16.44 %
37,078 B in 30/8/2020 +7,288 B +24.46 %
29,790 B in 30/8/2019 +5,341 B +21.84 %
24,449 B in 2018
------------------------------------------
TOTAL DEBT
3,506 B in 30/8/2021 + 0.021 B + 0.60 % 8.12% comparison by assets
3,485 B in 30/8/2020 + 3,462 B +15738.18 % 9.40 % comparison by assets
22,66 M in 30/8/2019 - 2.35 M -9.39 % 0.073 % comparison by assets
25,01 M in 2018
==================
Final result <<<
we have seen the net income of the company is constantly increasing making a positive sign for the investors, The total assets constantly increasing which increases the company power, For the debt, we have seen a huge increase in the 2020 year compared to the 2019 year. but in the end, the company will pay its debt easily
Previous results do not give guarantees for future results, but we can see that the company has successful management and is in continuous development.
ACN stock is a good buy stock right now

CHR AnalysisI think we are heading up, this is proven through the daily pattern it is in and broken out of, in a few days we will get that huge pump up! Follow my Tiktok ZKInvesting for all the updates on crypto gems and bitcoin of course!

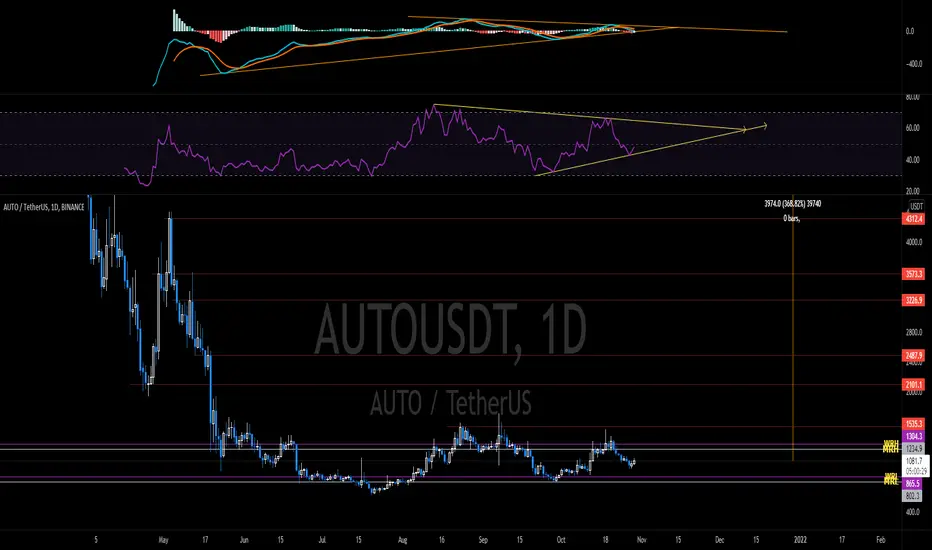
AUTO-USDT price prediction This is one of the projects which is highly valuable for long-term holding.
Short-term targets are also give us a great R:R trade.
I personally will stake it and hold it for long-term.
The max. supply is 80,000 and the circulating supply is almost 35k.
Another good point is the TVL is way more than its marketcap.
Share this idea with your friends and let them use it too.
Accumulation zone for Sona Comstar InvestorsNSE:SONACOMS
note: this is not an idea for short term trading, but for long term investors.
The scrip seems to respect the yellow trendline since its IPO.
so one can use the yellow line to accumulate the shares whenever the scrip takes support on the line for longterm.

WazirX(WRX) | Trading PlanHello, everyone!
OVERVIEW
Let's take a look at the largest Indian cryptocurrency exchange, which is integrated to
Binance ecosystem. Key features are:
1)Instant INR (fiat) deposit and withdrawal options
2)World’s first auto-matching P2P engine with high
liquidity
3)80+ tokens
4)Login via Binance option
FUNDAMENTAL ANALYSIS
Product 7/10
Such innovative cryptoexchange with the Binance support performs a really top product in the cryptoexchanges sphere.
Tokenomics 5/10
45% of the total supply is in circulation. Total supply is unlimited. Tokenomics could be better but not so critical.
Partnerships 6/10
The Binance supports WazirX. It means that Binance is interested in WazirX expansion.
Exchanges 8/10
Binance, Poloniex and Tokocrypto and a lot of small exchanges listed WRX token which is really good for exchange's token.
Market Information 6/10
26X profit made the early investors, but the ATH was at $5.88 and the correction started in April 2021. I suppose that the price drop was sufficient for the new accumulation phase. I think the price easily can make 3-4X from the current price.
DISCLAMER: Information is provided only for educational purposes. Do your own study before taking any actions or decisions at the real market.

CRWD ready to strike!Gap filled! Clearing the 50-day moving average, MACD and RSI looking to flip up. Can we get a bounce??!

ROKU for the hat trick!Remember this level?? Very nice hammer on the daily chart today. Had you bought at today's closing price you would have had 2x 50%+ gains this year. Hat trick incoming??

Emkay Global now at 118, 2x candidate - Consult your advisory 21st Sep 2021
Please consult with your financial advisor before making any investment...
This could turn DOUBLER from here on if HOLD patiently with proper risk management
equityforfuture

buy a three risk to reward ratio : 1:4currently on the 1hr timeframe there is a minor consolidation, when that consolidation range is broken, we expect price to sky rocket


Sundial Growers $SNDL - Long idea 💡 ⚠️ This idea is based on my technical analysis only. Do your research and trade on your own risk!

ADA Correction then To Higher Highs.I am not a financial advisor I try to keep my charts visual and explain what is going on. So Ada is going through a reversal to the 1 or both of the 2 green levels i have marked up. Trade on.

ETH quick look at chart, extreme impulse up. Can we hold the lvlIt's going to be interesting to see how this plays out as the day continues, 6:45PM here.

Spotify (SPOT) Stock. A Lot Of Buy Signals On D1.Spotify (SPOT),D1: Support level + Bollinger bands + Hammer + Volume + Oversold + Discout

USD/JPY 1D analysis 01/07/21Hello everyone , as we all know the market action discounts everything :) notice from all the data and the indicators that we saw on the chart the USD/JPY seems to be moving up with no signs of a reversal yet . we could be seeing the price reaching the are 112.30 in the next few days .
Fundamental analysis :
The Japanese yen turned out to be the worst-performing currency on Wednesday, allowing the USD/JPY pair to snap four consecutive days of the losing streak and climb back above the 111.00 mark. The underlying bullish sentiment in the financial markets – despite worries about the spread of the highly infectious Delta variant of the coronavirus – continued undermining the safe-haven JPY. This, along with a strong pickup in the US dollar demand further contributed to the pair's intraday rally of over 70 pips from levels just below mid-110.00s.
In fact, the key USD index posted its biggest monthly rise since November 2016 and remained well supported by the Fed's surprise hawkish shift. It is worth recalling that policymakers brought forward the timetable for the first post-pandemic interest rate hikes and signalled two rate hikes by the end of 2023 at the end of June policy meeting. The already stronger greenback got an additional boost following the release of a stronger ADP report, which, to a larger extent, helped offset a sharp decline in the US Treasury bond yields.
The monthly data published by the Automatic Data Processing (ADP) Research Institute on Wednesday revealed that the US private-sector employers added 692K jobs in June. This marked a notable deceleration from May's downwardly revised reading of 886K (978K reported previously) but was better than the market expectations for 600K. This, along with hawkish comments by Dallas Fed President Robert Kaplan, cemented market expectations over the potential for an early move by the US central bank to rein in its highly accommodative monetary policy.
In an interview with Bloomberg TV on Wednesday, Kaplan noted that they are seeing a broadening of price pressures and would prefer to taper sooner than the end of the year because of questions about efficacy, side effects. Apart from this, end-of-month/quarter flows acted as a tailwind for the USD and pushed the USD/JPY pair to 15-month tops. That said, upbeat Japanese manufacturing data kept a lid on any further gains for the major and led to consolidative price action, above the 111.00 mark, through the Asian session on Thursday.
Japan Tankan Manufacturing Index rose to 14 in Q2, marking the best level since 2018 and the fourth straight quarter of improvement. Adding to this, the Markit Japan PMI Manufacturing was revised higher to 52.4 in June from 51.5 flash reading. Moreover, confidence about the outlook reached the highest level since the series began in July 2012 amid hopes of an end to the pandemic. This, in turn, extended some support to the JPY and capped gains for the major.
Make sure to Follow and Like for more content
If you have any questions please ask
Thank you for reading.

TESLA: X AE A-XIIITS FOR LEARNING DIFFERENT KINDS OF PATTERNS AND THE PRICE ACTION INVOLVED.
PERFECT TRAINGLE pattern with strong base.
Closing above SMA 200 will be a good place to accumulate stock.
It will take some days to give breakout.
Queries in comment section.
