S&P500: Stocks and Tariff, what is next?US indices were bullish so far despite the NEW HUGE tariffs. As the tariffs become in play by Aug 1st, we shall see its effect in Q3 results, Q2 earnings beats, but will Q3 do ?
Disclaimer: This content is NOT a financial advise, it is for educational purpose only.
Investment

SHOP Bulls Are Back!
**SHOP Bulls Are Back! \$128 Calls Flash 80% Confidence Ahead of Earnings 🚀**
---
### 📋 **Post Body (TradingView Viral Format):**
**SHOP Weekly Options Alert — Aug 8 Expiry 💥**
📈 **Momentum Check:**
* RSI (Daily/Weekly): 🔼 Rising
* Call/Put Ratio: **1.35** (Bullish)
* Volume: Confirmed Institutional Support
* Confidence Level: **80%**
---
📊 **Recommended Trade:**
* **Type:** Buy Call
* **Strike:** \$128
* **Entry:** \$5.70
* **Stop Loss:** \$2.85
* **Targets:** 🎯 \$8.55 / 💰 \$11.40
* **Expiry:** Aug 8, 2025
* **Entry Timing:** Market Open
---
⚠️ **Key Risk:**
Major earnings event approaching — **exit before earnings** if holding through volatility isn’t part of your plan. Position sizing is **crucial**.
---
💡 **Strategy Insight:**
Strong consensus across models (Grok, Gemini, Claude, Llama, DeepSeek) aligns on bullish bias. This is a **premium setup** — watch for confirmation early in the week.
---
📦 **Trade JSON (for automation nerds):**
```json
{
"instrument": "SHOP",
"direction": "call",
"strike": 128.00,
"expiry": "2025-08-08",
"confidence": 0.80,
"profit_target": 8.55,
"stop_loss": 2.85,
"size": 1,
"entry_price": 5.70,
"entry_timing": "open",
"signal_publish_time": "2025-08-05 07:05:45 UTC-04:00"
}
```
---
### 🏷️ **Recommended Tags (TradingView Style):**
`#SHOP #OptionsTrading #WeeklyOptions #CallOptions #SHOPStock #BullishBreakout #TechnicalAnalysis #EarningsPlay #TradingStrategy #MomentumTrade #RSI #VolumeAnalysis #SmartMoney #TradingView`

IONQ: is it the time to secure IonQ position ?Next week we will have some quantum computing stocks that announce earnings results, so will see if it the time to secure this position. Noting that this is a very long-term position, the company still not profitable yet.
Disclaimer: This content is NOT a financial advise, it is for educational purpose only.

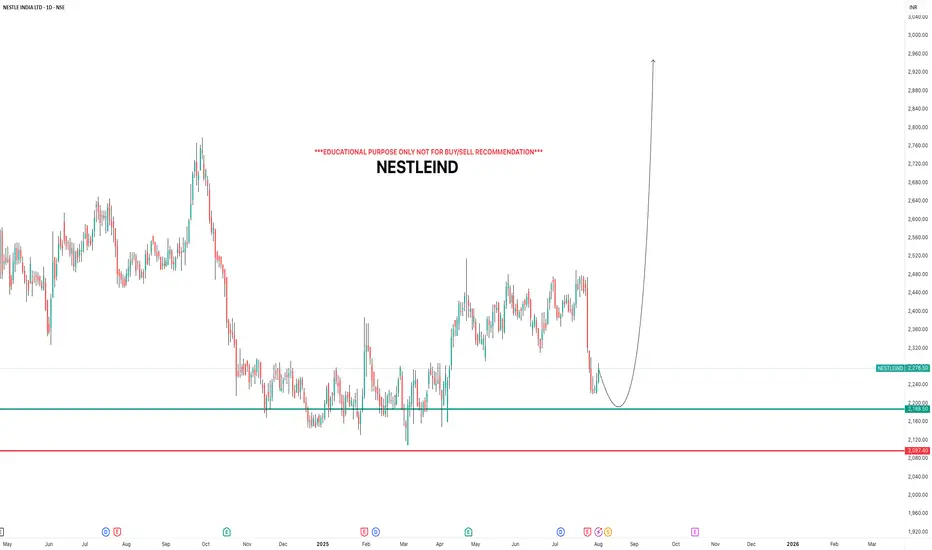
NESTLEINDIAi Observed these Levels based on Price Action and Demand & Supply which is my own Concept "PENDAM CONCEPTS"... Please don't take any trades based on this chart/post... Because this chart is for educational purpose only not for Buy or Sell Recommendation... Thank Q
BA: Boeing down on better than expected results! 30-07-2025Yesterday we get Boeing earnings report which came better than expected, but the stock down more than 4% as the company is not expected to make positive profit or free cashflow before 2026. No dividends currently paid, so there is nothing attractive to me now.
Disclaimer: This content is NOT a financial advise, it is for educational purpose only.

DOW: Dow Inc. cut its dividends in half !High dividends no longer !
I was waiting the stock to reach the support level to benefit from the 10% high dividends yield... but the company cuts its dividends yield from 10% to 5%, so it is no longer valid to me.
Disclaimer: This content is NOT a financial advise, it is for educational purpose only.

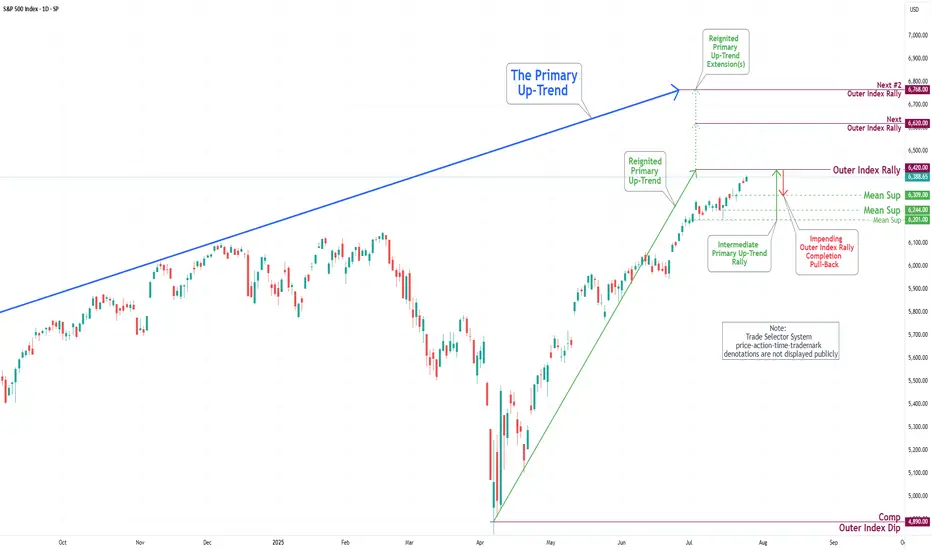
S&P 500 Daily Chart Analysis For Week of July 25, 2025Technical Analysis and Outlook:
In the trading activity observed last week, the S&P 500 Index exhibited a predominantly upward trajectory. It traded around the Key Resistance level of 6314. It successfully broke through this level, with the primary objective being to complete the Outer Index Rally at 6420, as outlined in the previous week's Daily Chart Analysis.
It is crucial to acknowledge that the current price movement may prompt a substantial pullback following the completion of the Outer Index Rally, with the main target identified as the Mean Support level of 6309. Following this potential downward adjustment, it is anticipated that the index will resume its upward trend, targeting a retest of the forthcoming completion of the Outer Index Rally at 6420.
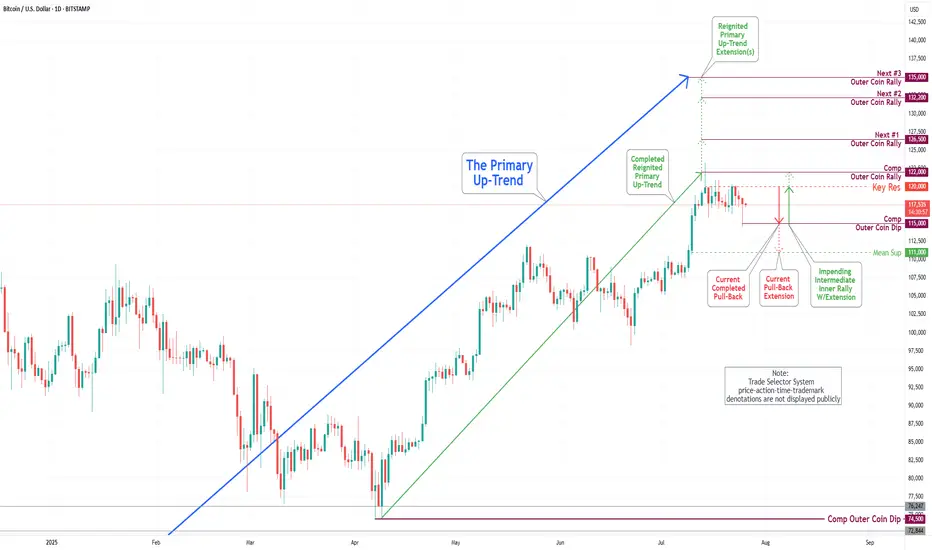
Bitcoin(BTC/USD) Daily Chart Analysis For Week of July 25, 2025Technical Analysis and Outlook:
In the trading session of the previous week, the Bitcoin market exhibited considerable volatility as it retested the Key Resistance level at 120000. On the lower end of the spectrum, the market engaged with the Mean Support levels at 117500 and 115900, culminating in the completion of the Outer Coin Dip at 115000. Currently, the coin is poised to retest the Key Resistance at 120000 once again. This anticipated rebound will necessitate a retest of the completed Outer Coin Rally at 122000. The additional target levels for the renewed Primary Up-Trend are 126500, 132200, and 135000.
PEP: PepsiCo Earnings resultsIts looks like PEP is a buy now. Just want to double check on future sales growth as it is stable for a while. Lower stock price made the dividend very attractive since PEP is a defensive stock.
Disclaimer: This content is NOT a financial advise, it is for educational purpose only.

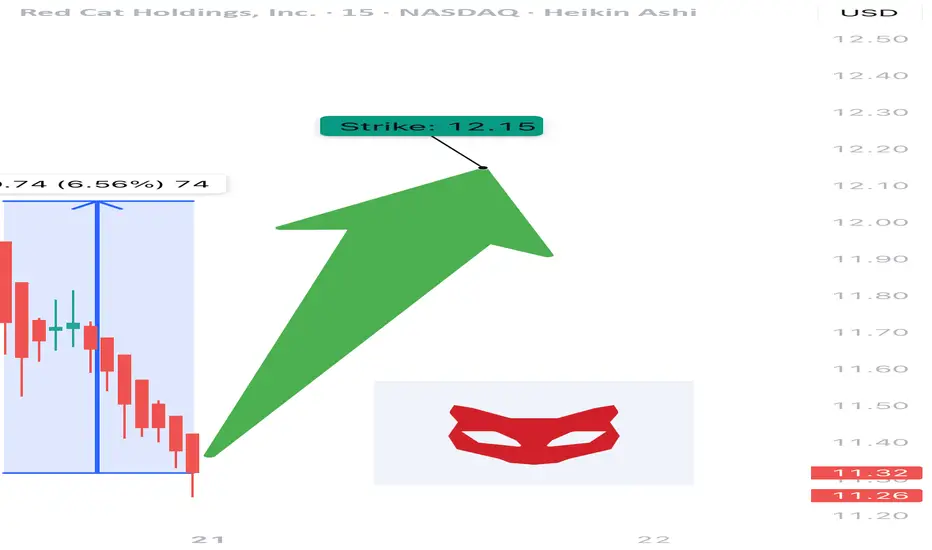
$RCAT Momentum Play – Institutional Money, Defense Narrative, an
🚀 NASDAQ:RCAT Momentum Play – Institutional Money, Defense Narrative, and a Chart Screaming Higher 📈
📅 Posted: July 18, 2025
💡 Five AI models, one trade idea: follow the smart money, manage the risk.
⸻
🧠 AI Consensus Summary (Multi-Model Breakdown)
Model Bias Highlights
DeepSeek (DS) ⚠️ Bullish, Cautious +78% over 5 days. RSI 83.39. Weak volume = risk of cool-down.
Llama (LM) ✅ Moderately Bullish Above all EMAs. MACD strong. Caution: near upper Bollinger Band.
Grok (GK) 🔥 Strong Bullish Pentagon catalyst. EMAs bullish. Ignore RSI — momentum matters.
Gemini (GM) 🔥 Strong Bullish Institutional buying. Clean breakout path to $15.00.
Claude (CD) ⚠️ Modestly Bullish Overbought but structurally sound. Supports small, well-managed long.
⸻
🔍 Trade Setup – RCAT LONG
🎯 Entry Price: $12.15 (Market open)
💰 Take Profit: $15.00
🛑 Stop Loss: $10.80
📊 Position Size: 166 shares
⚖️ Risk Amount: ~$200 on $10,000 account
📆 Max Hold Time: 3–4 weeks
📈 Confidence Level: 80%
📌 Entry Timing: Open (or first pullback toward 12.00 if gapping)
⸻
🧭 Why It Works
• ✅ Narrative Power: Pentagon spending = sector tailwind
• ✅ Institutional Flow: Smart money is already positioned
• ✅ EMA Alignment: Above 10/50/200 on most timeframes
• ⚠️ RSI Hot Zone: Manage risk — but this can stay hot longer than expected
⸻
📌 Levels to Watch
• 📉 Support: $11.50 short-term; $10.80 technical invalidation
• 📈 Resistance: $13.20 (minor) → $15.00 (major target)
⸻
⚠️ Risk Management Reminder
Don’t let green candles fool you. Overbought doesn’t mean reversal, but it does mean tighter stops and no oversizing.
Let the setup breathe — don’t chase.
⸻
📊 TRADE SNAPSHOT
{
"instrument": "RCAT",
"direction": "long",
"entry_price": 12.15,
"stop_loss": 10.80,
"take_profit": 15.00,
"size": 166,
"confidence": 0.80,
"entry_timing": "open"
}
⸻
💬 RCAT running hot — but too hot? Or just getting started?
🚀 Follow for more AI-powered trades.
🔁 Like • Share • Save for later
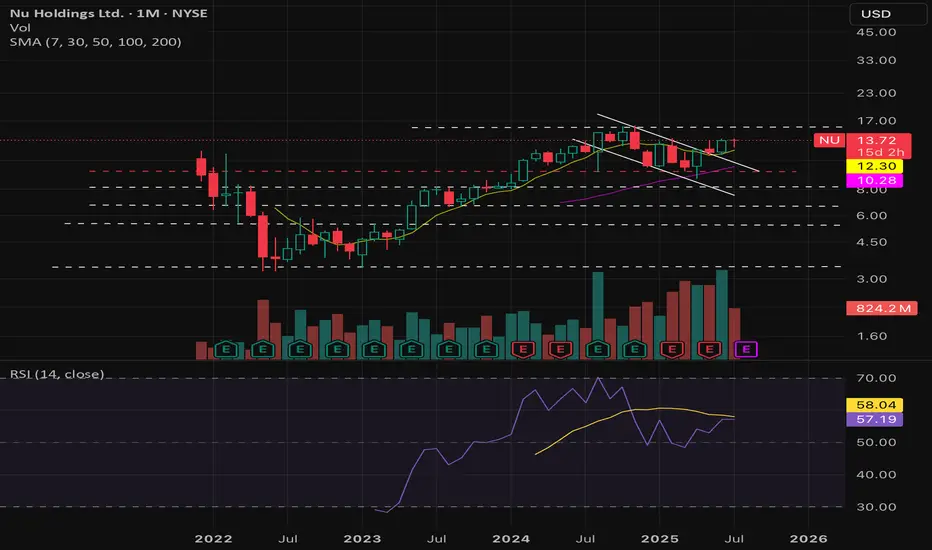
$NU : 30% CAGR for your portfolio for the next 3-5 years!- NYSE:NU is a big name in the LATAM.
- LATAM is expected to grow significantly in next decade with digitalization as the strongest theme.
- Let's talk about fundamentals:
Year | 2025| 2026| 2027 | 2028
EPS | 0.56 | 0.77 | 1.05 | 1.45
EPS growth% | 31.99% | 37.71% | 36.05% | 38.58%
For a company growing EPS at 30%+ deserves a forward p/e of 30
Base Case Stock Value ( Forward p/e = 30 ):
Year | 2025| 2026| 2027 | 2028
fair value | $16.8 | $23 | $31 | $43
Bear Case ( Forward p/e = 20 )
Year | 2025| 2026| 2027 | 2028
fair value | $11.2 | $15.4 | $21 | $29
Bull Case ( Forward p/e = 35 )
Year | 2025| 2026| 2027 | 2028
fair value | $19.6 | $26.95 | $36.75 | $50
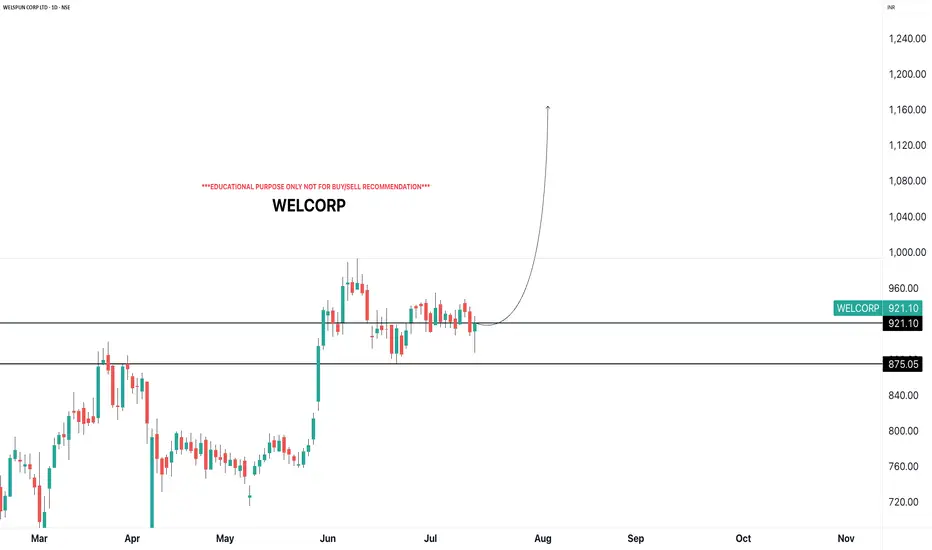
WELCORPi Observed these Levels based on Price Action and Demand & Supply which is my own Concept "PENDAM CONCEPTS"... Please don't take any trades based on this chart/post... Because this chart is for educational purpose only not for Buy or Sell Recommendation... Thank Q
AAPL Significant Event NASDAQ:AAPL
1. Bullish Breakout :
In the daily chart bullish breakout has been seen. If the bullish momentum is strong, the price may follow the upward.
2. Target Price : Potential target price 214
3. Risk Factors:
A. Failure to breakout the resistance 206
B. Sideways trend may be started.
C. Broader market weakness or correction
D. False Breakouts
---------------------
Note :
If you’re interested in receiving detailed technical analysis reports on your selected stocks, feel free to reach out to me. I can provide you with customized reports covering trends, key levels, momentum, patterns, and price projections to support your trading or investment decisions.

#FORTIS Today this stock brooked ATH level with strong volume. Through It can be predicted here that this will be a good investment option for the short term and long term.
CMP - 790
Key level:-
1) triangle pattern breakout
2) high volume
3) stock sustaining previous high
4) retest like formation

INDIANB - 640 ABOVEIndianb no have in very good levels, long consolidation breakout and sustaining near
ATH...
Above 640 possible good rally up side for short term gain

Airbnb: Proof that even stocks love to traveThe analysis of Airbnb (ABNB) stock reveals an intriguing setup following the breakout and retest of a key resistance level, which previously acted as a trendline on the daily chart. After successfully breaking above this line and confirming it with a retest, the price is now showing potential for further upside — aligning with a bullish scenario that targets the $164 area, which also coincides with the 1.0 Fibonacci level (164.12).
The current structure suggests the beginning of an upward movement after a period of consolidation, with both the 50-day and 200-day moving averages (MA50 and MA200) positioned to support further growth, reinforcing the overall bullish outlook.
Notably, trading volume has increased in line with the breakout and continued price movement, adding confidence to the scenario playing out toward the higher targets. Key Fibonacci resistance levels to watch next include 0.786 (150.37) and 1.272 (181.61), with a long-term extension target at 1.618 (203.85).

TATAMOTORSi Observed these Levels based on Price Action and Demand & Supply which is my own Concept "PENDAM CONCEPTS"... Please don't take any trades based on this chart/post... Because this chart is for educational purpose only not for Buy or Sell Recommendation... Thank Q

Luxury, War, and Clarity – This Is the Golden Reset.🟨 The Real Gold Era: Clarity While the World Burns 🟨
"While some bleed in the streets, others sip cocktails in the Bahamas. This is not a coincidence. This is the new world."
Right now, we live in a time like no other.
People are dying in wars they never chose.
Currencies collapse. Nations threaten each other.
And yet — capital flows, gold climbs, and the rich get richer.
🕰️ A war started long ago — and most never saw it:
2020–2022: They printed trillions. COVID shut down the world. Fiat was silently devalued.
2022–2023: Russia was cut off from SWIFT. BRICS started buying gold. The dollar was no longer untouchable.
2023–2024: Gold broke $2100… then $2400… now $3400+. Even high interest rates can't stop it.
2025: U.S. and Israel strike Iran. BRICS discuss a gold-backed currency. Trust in fiat? Gone.
The Gold Era is no longer just metaphor. It’s the new battlefield.
💣 "War is loud. Wealth is silent."
While bombs fall in the East,
✨ capital quietly moves to safe havens.
While families flee,
✨ smart money finds gold, data, and sovereign positioning.
While headlines scream chaos,
✨ traders make decisions in silence.
🌍 But here's the paradox:
We also live in a world of unmatched abundance:
You can build a brand from a phone.
You can trade gold from a beach.
You can learn SMC, AI, geopolitics — and use it to build freedom.
You can escape the system, if you understand the structure.
In this gold era, the true asset isn't just metal.
It's mental clarity. Information. Sovereignty.
The gold is you.
📉 This isn’t just about trading.
It’s about knowing where we are in the timeline of collapse and rebirth.
The markets don’t lie — they expose what’s really coming.
And those who read them… can rise while others fall.
🧠 Final note:
Not everyone survives a reset.
But those who think in structure, who lead with clarity — they don’t just survive.
They reposition.
They build.
They lead.
🟡 Welcome to the Real Gold Era.
Where charts speak louder than news.
Where truth is a position.
Where you don’t wait for safety — you create it.
—
✍️ GoldFxMinds – where structure meets truth.
📢 Disclosure: This analysis was created using TradingView charts through my Trade Nation broker integration. As part of Trade Nation’s partner program, I may receive compensation for educational content shared using their tools.

AAPL — Broadening Range and Accumulation Phase. Targeting $300Apple stock has been moving in a broadening pattern for an extended period, showing signs of accumulation. This price behavior suggests a potential bullish breakout. The upside target in the coming months is around $300, possibly by fall or winter. However, a corrective scenario remains on the table, with a potential pullback toward the $165–144 range, which could present a strong long entry opportunity. From a fundamental perspective, investor interest is likely to increase ahead of Apple’s expected product presentation in the fall, which historically supports bullish sentiment in the stock.

GT Protocol ($GTAI) | Breakout Loading? +500% Potential! (READ)By analyzing the #GTProtocol chart on the daily (logarithmic) timeframe, we can see that the price was forming a solid base between $0.12 and $0.15. Currently trading around $0.17, the chart structure remains bullish and primed for a potential breakout. Momentum is gradually building, and I expect the price to soon test the $0.185 level, followed by short-term targets at $0.20, $0.24, and $0.266.
In the long run, my bullish bias remains firm with targets at $0.37, $0.45, and a psychological milestone of $1.00, representing a potential upside of over 500% from current levels!
Fundamental Drivers Supporting the Move
• Tokenomics: Recent unlocks have distributed supply more evenly, easing early-seller pressure and improving liquidity dynamics.
• Utility & Adoption: As a Web3 AI-execution layer, GT Protocol is expanding its real-world use cases with new partnerships and integrations.
• Narrative Strength: Positioned as a leading AI narrative for 2024, $GTAI is gaining traction amid rising AI sector demand.
Sentiment & On-chain Signals
• Community Hype: Activity on X (Twitter) and Telegram is surging, with bullish sentiment dominating conversations since the recent breakout attempt.
• Social Volume: A spike in daily mentions suggests increasing retail attention—often a precursor to strong moves.
• Whale Accumulation: Smart money has been seen accumulating below current levels—an early sign of confidence in the next leg up.
With both the technical setup and fundamentals aligning, $GTAI looks ready for an explosive run. Keep it on your radar!
Please support me with your likes and comments to motivate me to share more analysis with you and share your opinion about the possible trend of this chart with me !
Best Regards , Arman Shaban

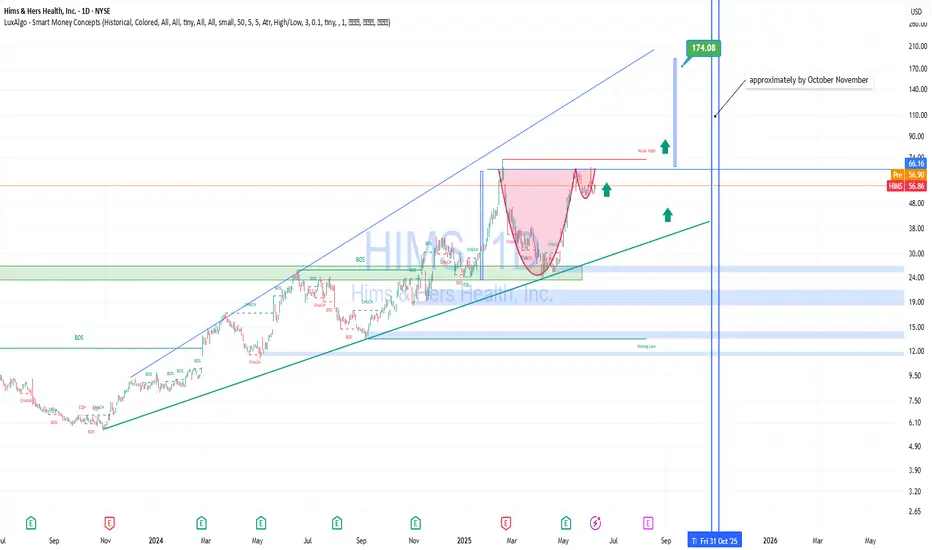
HIMS – Technically and Fundamentally Strong for Mid-to-Long TermTechnical Analysis
HIMS is trading in a clear ascending channel since 2023.
On the daily chart, a “cup and handle” formation has completed, with a confirmed breakout above the neckline ($55–$57 area).
The price is consolidating near the breakout point – classic behavior before a continuation move.
Target projection from the cup pattern is $170+, implying a 200%+ upside potential.
The stock also respects the upper trendline of the long-term channel, reinforcing bullish structure.
Fundamental Strength:
Telemedicine megatrend: Digital health is booming. HIMS is one of the few well-established D2C players in the U.S. market.
Revenue growth: Annual revenue growth exceeds 40% YoY, a sign of operational efficiency and demand.
Sticky subscription model: Over 1.5 million active subscribers — solid base for recurring revenue and LTV.
Valuation upside: Still undervalued relative to sector peers despite recent rally.
Scalable tech stack: Strong backend, customer acquisition systems, and vertically integrated infrastructure support further expansion.
Conclusion: HIMS offers an attractive risk–reward setup for swing traders and long-term investors alike
Digital Turbine, Inc. (APPS)As a Whole formation, it looks to me the nearest Scenario is we Completed Major 1st Wave at 102$ , In my opinion as a technical analyst in charts and technical formations, in addition to the corrective formations I have encountered many times before, we have completed the correction of a leg of a major correction for the second large wave at $1.18. We are entering the early stages of the second leg, which I expect 99% will go to its final target at $141 by 2027. However, the closest level in 2025 is $25, and perhaps with significant news like a partnership and investment with major companies, it might hit the target of $49 by early 2026. The correction as a whole is called the minor or accelerating correction A B C.
Target Prices and Expected Periods: -
1 Month = 25$
6 - 9 Months = 49$
12 - 15 Months = 141$
APPS has a High Technical Rating by Nasdaq Dorsey Wright.
Earnings announcement* for APPS - Jun 16, 2025

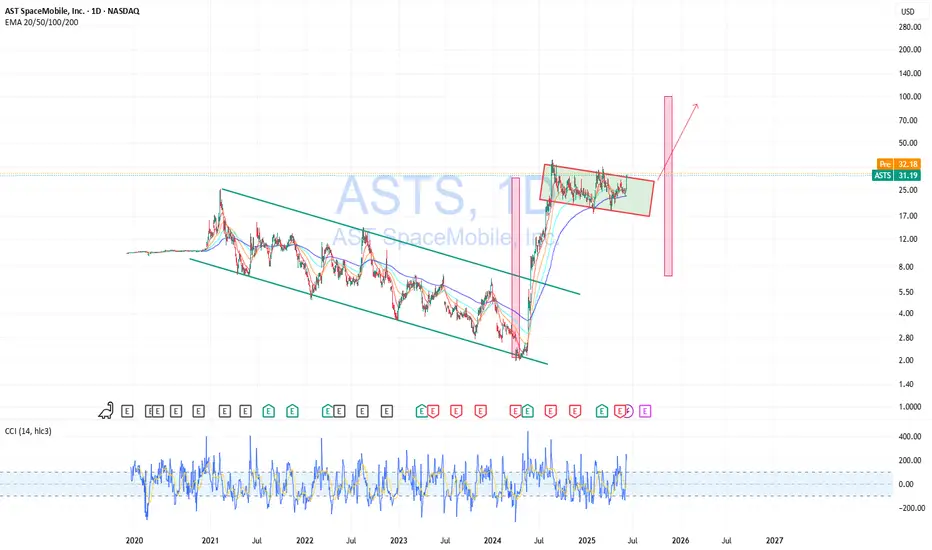
Buying ASTS — Waiting for BreakoutASTS has broken out of a long-term downtrend and is now consolidating in a tight range, forming a base after a strong impulse move. This kind of price action often leads to another breakout, especially when supported by rising volume and EMAs lining up underneath.
I’m buying in this current zone, expecting a breakout from the range and continuation to the upside. I’ll be watching for confirmation through volume spikes and a clean move above resistance. The chart structure looks strong, and the upside potential remains high.