SLC Brazilian Agricultural Producer and Farmland Investor ThesisExecutive Summary
We are overweighting SLC Agrícola (SLCE3.BZ) over U.S. agribusiness stocks (BG, ADM, MOS, CTVA, FPI) in the current macro environment. The key drivers are:
Geopolitical arbitrage (Trump-Russia détente benefits Brazilian exporters more than U.S. firms).
FX tailwinds (weaker USD boosts BRL-denominated farmland values).
Commodity cycle positioning (SLC’s cotton/soy mix outperforms U.S. corn/ethanol plays).
Valuation gap (SLCE3 trades at 9.1x P/E vs. 14x+ for U.S. peers).
Top Trade:
Long SLC Agrícola (SLCE3.BZ)
I. Macro & Geopolitical Edge: Why Brazil Wins
1. Trump’s Pro-Russia Policy Reshapes Fertilizer & Grain Flows
Sanctions Relief: Russian potash/phosphate exports resume → BrasilAgro (AGRO3) and SLC benefit from 25-30% lower input costs (U.S. farmers already hedged).
U.S. Grain Export Risk: If Trump pushes Ukraine grain deals, ADM/BG lose pricing power in EU/Asia markets.
2. USD Weakness Favors BRL-Linked Assets
Fed Cuts + Trump’s Dollar Policy: BRL appreciation (R$4.60/USD by 2026E) boosts:
SLC’s USD-linked revenue (68% of sales).
Land appraisals (Brazilian farmland up 18% CAGR in USD terms).
U.S. Companies Hurt: ADM/BG’s LatAm earnings face translation drag.
3. BRICS Neutrality vs. U.S.-China Decoupling
Brazil remains trusted supplier to both China and EU (no trade wars).
U.S. agribusiness (ADM/BG) exposed to:
China soy tariffs (if Trump escalates).
EU carbon taxes (ADM’s ethanol margins at risk).
II. Company-Specific Advantages: SLC vs. U.S. Peers
A. SLC Agrícola (SLCE3.BZ) – The Optimal Play
Metric SLC Agrícola U.S. Peers (ADM/BG/MOS)
P/E (2025E) 9.1x 12-18x
EBITDA Margin 38% (2025E) 8-15%
FX Benefit BRL appreciation USD translation drag
Geopolitical Shield Neutral (BRICS) Exposed to U.S.-China wars
Key Catalysts:
Cotton Supercycle: Trump’s EU-China trade war could spike prices (SLC has 40% exposure).
Hidden Water Rights: 120k hectares of irrigated land (R$3.2B unreported NAV).
Ferrogrão Railway Completion (2026): Cuts logistics costs by 18%.
B. U.S. Agribusiness: Relative Weaknesses
Stock Key Risk Mitigation
ADM Ethanol mandate cuts (Biden hangover) Divesting plants
BG Brazilian tax case (R$4.5B liability) Land asset cover
MOS Saudi JV delays (CFIUS scrutiny) Fertilizer optionality
CTVA Patent cliff (2027+) M&A speculation
FPI U.S. farmland cap rate compression Rent escalators
III. Conclusion: Why SLC Over U.S. Peers?
Geopolitical Arbitrage: Brazil avoids U.S.-China/EU trade wars.
FX Leverage: BRL appreciation boosts USD earnings + land values.
Commodity Mix: Cotton/soy > corn/ethanol in Trump’s policy regime.
Valuation: SLCE3 at 9.1x P/E vs. 14x+ for U.S. stocks.
Investment

RCL Eiffel Tower CAUTION! UPDATERCL is in a very capital-heavy industry that is very economically sensitive.
I first published this Idea back on February 11, 2025. Since then, it has dropped over -40%.
Normally, I would say that from erections come corrections. However, this has the Eiffel Tower structure in place for a full-on reversal.
I am reposting this chart since TV forced me to post a "target reached."
Here is the original post.

If Nike Were Born Today: The Hypothetical Valuation of a New-AgeAbstract
Nike is one of the most recognizable brands on the planet, yet its valuation often lags behind newer, tech-driven companies with far less global influence. What if Nike were launched today — with its current revenue, market dominance, and brand power — but operated like a modern D2C startup with a tech DNA? This research explores what Nike would be worth in today’s market conditions, showing just how undervalued it may actually be when compared to new-age companies.
1. Introduction
Nike, Inc. (NYSE: NKE) is a global sportswear powerhouse with over $51 billion in annual revenue and a footprint in more than 170 countries. It has shaped athlete endorsement culture, built a generational brand, and transformed consumer behavior. Yet its current market capitalization sits around $80 billion — modest compared to newer players with less revenue but tech-first narratives.
This article dives into a simple but powerful hypothetical:
If a new company replicated Nike's current revenue and global dominance today, how would the market value it?
2. Nike Today: A Snapshot
Metric Value
FY2023 Revenue $51.2 Billion
Market Cap (Apr 17, 2025) ~$80 Billion
Net Profit Margin ~10.5%
P/E Ratio (TTM) ~17.9
Brand Value (Forbes, 2020) ~$39.1 Billion*
Global Reach 170+ Countries
*According to Forbes' Most Valuable Brands, Nike ranked #13 globally with a brand value of $39.1 billion in 2020. Other rankings (e.g., Interbrand 2023) place Nike's brand value even higher at $53.7 billion.
Despite being a category leader, Nike trades at a modest 1.6x sales multiple, compared to modern companies that command 5x, 7x, or even 30x+ valuations.
3. New-Age Valuation Framework
Today’s market rewards:
Tech-first operations
High-margin D2C models
Recurring revenue (subscriptions, memberships)
Community-driven brand growth
AI, personalization, and digital experiences
Let’s compare valuation multiples:
Company Sector Revenue Market Cap P/S Ratio
Nike Apparel $51.2B $80B ~1.6x
Lululemon Apparel SEED_TVCODER77_ETHBTCDATA:9B $50B ~5.5x
Salesforce SaaS $34B $240B ~7x
Nvidia AI/Chips $60B $2.3T ~38x
4. What Would a “Modern Nike” Be Worth Today?
If a new company today built:
$50B+ revenue
Global presence and branding like Nike
D2C-first, tech-enabled business
40–50% gross margins with scalable digital ops
Then, even at a conservative 6x revenue multiple, its valuation would be:
$50B × 6 = $300 Billion
And that's before factoring in:
AI-driven retail personalization
Creator monetization ecosystems
Loyalty programs and recurring revenue streams
Lower inventory risk with tech-driven fulfillment
5. Brand Value Through Royalty Method
Using the Royalty Relief Method:
Brand-attributable revenue (90% of $51.2B) = FWB:46B
Royalty rate = 6%
Annual royalty = $2.76B
Present Value (8% discount rate):
$2.76B ÷ 0.08 = \boxed{~$34.5B}
Nike’s brand, purely from an intellectual property lens, is worth significantly more than market pricing implies.
6. Why Nike Seems Undervalued
Categorized as a traditional apparel retailer vs. tech-first brand
Slower YoY growth relative to newer disruptors
Wholesale-heavy model impacts margins
Market overlooks its cultural dominance and brand loyalty
If Nike shifted its model to fully digital, leaned into AI and subscriptions, and emphasized platform economics, its valuation could more than double.
7. Conclusion
Nike, if built today, would not be an $80B company — it would likely be valued between $300B and $400B.
That’s the gap investors often miss.
Nike isn’t just a shoe and apparel brand — it’s global IP, media, culture, and influence. Yet in today’s market, it trades like a legacy retailer. If a startup were to achieve what Nike already has, it would be considered a generational tech unicorn.
Nike isn’t overvalued — it’s misunderstood.
About This Research
This research article was developed using AI-powered analytical tools, historical data modeling, and comparative valuation logic to explore hypothetical scenarios around Nike’s valuation. It combines financial fundamentals with modern market heuristics to offer a data-driven perspective on brand valuation in the context of today’s tech-driven economy.
Disclaimer
The information provided in this article is for informational and educational purposes only and does not constitute financial, investment, or trading advice. The analysis, opinions, and projections expressed are solely those of the author and are based on publicly available data as of the time of writing. This article is a hypothetical research exploration and should not be interpreted as a recommendation to buy, sell, or hold any securities mentioned herein.
All trademarks, brand names, and company references (including Nike Inc., Nvidia, Salesforce, etc.) are the property of their respective owners and are used for illustrative purposes only. The author is not affiliated with, endorsed by, or sponsored by any of the mentioned companies.
Investing in the stock market involves risk, including the potential loss of principal. Readers are strongly advised to do their own research and consult with a licensed financial advisor or other qualified professionals before making any investment decisions.
Past performance does not guarantee future results. The hypothetical scenarios and valuations discussed in this article are speculative in nature and are not guarantees of future company valuations or performance.

Undervalued, Oversold, Overlooked: MRK Hits The Key Zone!Hi all,
Merck & Co. (MRK) is a global pharmaceutical titan and is currently trading near its 52-week low of ~$79. Anchored by Keytruda’s 7% YoY revenue growth, a stable ~4% dividend yield, and an average fair value estimate of $156.59 (98% upside), MRK appears significantly undervalued.
Analysts forecast a 12-month price target of $118.05, implying 49% upside, supported by a strong pipeline and solid financials. While tariff concerns and Keytruda’s 2028 patent expiration pose risks.
Technically speaking, MRK has fallen 43% from its all-time high and has reached the strongest area on the chart—a key support zone offering a compelling opportunity to build mid- or long-term positions. This critical area is defined by multiple technical factors, creating a high-probability setup for a potential reversal:
Role Reversal Support: A broad, well-established resistance zone, aged like fine wine, has now flipped to act as support. This classic role reversal provides significant confluence to the setup.
Textbook Trendline: A perfectly respected trendline, straight out of technical analysis textbooks, has consistently held. The price has approached this trendline from higher highs, underscoring its strength as a key support level.
50% Retracement Level: A critical level often watched for potential reversals.
Monthly EMA200 Confluence: The 200-period exponential moving average on the monthly chart adds further strength to this area, reinforcing its technical significance.
Strategic Guidance:
This setup requires strong conviction. If you’re not prepared to buy in the lower gray areas of this support zone (marked on the chart), do not initiate a position.
In today’s market sentiment, your fundamental research must be robust, and technical analysis allows you to get that much confidence to make it happen!
Ask yourself: If the price falls further into the gray zones, am I willing to buy more? If your answer is yes, the current price presents a strong entry point for mid- to long-term positions.
If the answer is no—if you’re unsure about buying at lower levels or find yourself questioning what to do if prices drop further—refrain from starting a position. In volatile markets, clarity and discipline are essential. Only enter if your strategy is clear and your conviction matches the opportunity!
Good luck,
Vaido

$UNH buy the fear or sell into narrative?- NYSE:UNH has gotten into trouble with bad headlines after bad headlines.
- Recent DOJ probe led to 12% shaving in the stock price.
- Could it be a buying opportunity or just a falling knife?
- Are you afraid that NYSE:UNH could become NYSE:HUM 2.0?
Let's talk about fundamentals!
Year | 2024 | 2025 | 2026 | 2027 | 2028
GAAP EPS | 15.76. | 28.22 | 32.11 | 36.80 | 41.11
EPS growth% | -33.47% | 79.08% | 13.77% | 14.61% | 11.71%
It appears that 2024/ Early 2025 was the year when EPS growth bottomed and would go from negative to positive back again.
EPS growth is healthy double digit in mid teens. A fair forward p/e multiple for mid teen EPS growth should at least be 15 ( conservatively )
Year | 2024 | 2025 | 2026 | 2027 | 2028
Fair Stock Price (w/ forward p/e = 15 ) | $236 | $423 | $481 | $552 | $616
However, NYSE:UNH is a blue chip company and has a moat. Therefore, Investors will be willing to pay forward p/e of 20 once negative news subside.
Year | 2024 | 2025 | 2026 | 2027 | 2028
Fair Stock Price (w/ forward p/e = 20 ) | $315 | $564 | $642 | $736 | $822.2
Final Take:
I'm a buyer of NYSE:UNH < 450 will add more if it dips below 400 for the long term. Good quality companies don't usually buyers to get their skin into the game. Therefore, it's better to buy the fear than selling into narrative.

ProShares Short VIX Short-Term Futures ETFInvestment Thesis
ProShares Short VIX Short-Term Futures ETF (SVXY) is a fund that allows you to bet on a decline in volatility with a 0.5x ratio. That is, with a 10% decrease or increase in volatility, this fund will respond with a 5% movement in the opposite direction.
Volatility has significantly increased amid uncertainty due to mutual tariffs between the U.S. and the rest of the world. This presents good opportunities for opening long positions in SVXY.
The risk/reward ratio looks attractive, given that current VIX quotes are near the levels reached during the correction amid the pandemic in 2020. It is also worth noting that the share of S&P 500 components above the 50-day moving average is at local lows, which historically happens rarely and may signal a local potential for market recovery, and thus, a decline in the level of "fear" in the market.
In the base case scenario, we expect that countries will be able to reach agreements regarding the imposed tariffs, which will smooth out the overall impact on the U.S. economy and lead to a reduction in market uncertainty.
Target price – $46.8
Recommendation – Buy
Upside potential – 28%
We recommend setting a stop-loss at the level of $29.9.

What Drives Elbit Systems' Expansion?Elbit Systems is demonstrating significant forward momentum, underpinned by strategic international collaborations and advanced technological offerings that address specific defense needs. A cornerstone of this expansion is the deepening partnership with Germany's Diehl Defence. Together, they are bringing the Euro-GATR precision-guided rocket system to the German Army's helicopter fleet, showcasing Elbit's ability to integrate sophisticated, cost-effective solutions into established European defense frameworks and build upon existing industrial cooperation.
Simultaneously, Elbit is a potential key supplier for Greece's substantial multi-billion Euro defense modernization initiative. With Greece actively seeking rapid procurement from strategic partners such as Israel, discussions are reportedly underway regarding Elbit's Puls multiple rocket launcher systems. Securing participation in this large-scale program would represent a significant market penetration for Elbit, highlighting its growing role in equipping NATO allies that are undertaking significant capability upgrades.
This combination of strategic positioning and sought-after technology is attracting notable attention from the financial community. A marked increase in share purchases by institutional investors, prominently featuring Vanguard Group Inc., signals strong market confidence in Elbit's growth strategy and prospects. This investor validation, coupled with concrete collaborations and significant market opportunities, paints a picture of a company effectively leveraging innovation and partnerships to fuel its international expansion.

NAS100: Likely rebound at major point within Ascending ChannelCAPITALCOM:US100 is likely to be undergoing a corrective move as it tests the lower boundary of the ascending channel, as shown on my chart. This boundary serves as dynamic trendline support and a significant bullish reaction could happen if buyers step in at this level.
A successful rebound from this support could lead to a move toward the midline of the channel, with the next target at around 22,000 . This scenario would maintain the overall bullish trend structure.
However, a clear breakdown below the trendline support would weaken the bullish outlook and could lead to further downside.
Monitoring candlestick patterns and volume at this critical zone is essential for identifying buying opportunities. Proper risk management is advised, always confirm your setups and trade with solid risk management.
If you have any thoughts on this setup or additional insights, drop them in the comments!

CAKEUSDT (PancakeSwap): Sweet Gains or Stale Trade?(1/9)
Good afternoon, everyone! ☀️ CAKEUSDT (PancakeSwap): Sweet Gains or Stale Trade?
With CAKE at $2.599, is this DEX token a tasty treat or a flat pancake? Let’s flip the details! 🔍
(2/9) – PRICE PERFORMANCE 📊
• Current Price: $ 2.599 as of Mar 25, 2025 💰
• Recent Move: Consolidating $2.6-$2.8, up from $2.34, per data 📏
• Sector Trend: Crypto steady, DeFi mixed amid trade tensions 🌟
It’s a flip-flop—value might be cookin’! ⚙️
(3/9) – MARKET POSITION 📈
• Market Cap: Approx $760M (292M circulating) 🏆
• Operations: Leading BNB Chain DEX, yield farming, staking ⏰
• Trend: Deflationary model burns 102% minted, per data 🎯
Firm in DeFi, but volatility’s the spice! 🚀
(4/9) – KEY DEVELOPMENTS 🔑
• Recent Surge: Up 45% earlier in March, per X posts 🌍
• Platform Updates: Expanded NFT marketplace, per web data 📋
• Market Reaction: High volume ($230M daily), showing interest 💡
Adapting to DeFi trends, cooking up growth! 🍳
(5/9) – RISKS IN FOCUS ⚡
• Regulatory Risks: Crypto scrutiny could hit DEXs 🔍
• Market Volatility: Crypto swings could drag price down 📉
• Competition: Other DEXs like Uniswap challenge, per data ❄️
It’s a risky recipe—watch the heat! 🛑
(6/9) – SWOT: STRENGTHS 💪
• DEX Leader: Top on BNB Chain, strong user base 🥇
• Deflationary Model: Burns tokens, potentially boosts value 📊
• High Volume: $230M daily, per data, shows activity 🔧
Got a sweet spot in DeFi! 🏦
(7/9) – SWOT: WEAKNESSES & OPPORTUNITIES ⚖️
• Weaknesses: Price volatility, regulatory fears 📉
• Opportunities: DeFi adoption, new features like lending 📈
Can it rise or get burned? 🤔
(8/9) – POLL TIME! 📢
CAKE at $2.599—your take? 🗳️
• Bullish: $3+ soon, DeFi booms 🐂
• Neutral: Steady, risks balance gains ⚖️
• Bearish: $2 drops, market sours 🐻
Chime in below! 👇
(9/9) – FINAL TAKEAWAY 🎯
CAKE’s $2.599 price reflects consolidation, with strengths in its platform and deflationary model, but risks from market volatility and competition persist. DCA-on-dips could be a strategy to average in over time, banking on long-term growth. Gem or bust?

$XAUUSD (Gold): Golden Rally or Gilded Pause?(1/9)
Good morning, everyone! ☀️ XAUUSD (Gold): Golden Rally or Gilded Pause?
With gold at $3,020.82, is this safe-haven surge a treasure or a tease? Let’s sift through the shine! 🔍
(2/9) – PRICE PERFORMANCE 📊
• Current Price: $ 3,020.82 per ounce as of Mar 25, 2025 💰
• Recent Move: Near $3,057 high from Mar 20, per data 📏
• Sector Trend: Precious metals up on tension, per posts on X 🌟
It’s a golden glow—let’s see if it holds! ⚙️
(3/9) – MARKET POSITION 📈
• Global Role: Top safe-haven asset ⏰
• Drivers: Central bank buying, geopolitical risks 🎯
• Trend: Bullish near $3,000, per data 🚀
Firm as a refuge, shining in uncertainty! 🏦
(4/9) – KEY DEVELOPMENTS 🔑
• Geopolitical Boost: Trade tensions linger, per data 🌍
• U.S. Data: PMI strength supports USD, caps gold, per posts on X 📋
• Market Reaction: Consolidating near $3,020-$3,030 💡
Simmering in a tense market! 🌩️
(5/9) – RISKS IN FOCUS ⚡
• Profit-Taking: Post-$3,000 sales loom 🔍
• U.S. Rates: Policy shifts could hit, per data 📉
• Oil Prices: CAD link affects broader forex ❄️
It’s a shiny tightrope—watch your step! 🛑
(6/9) – SWOT: STRENGTHS 💪
• Safe Haven: Thrives in chaos, per posts on X 🥇
• Central Banks: Steady buying props it up 📊
• Green Demand: Key in renewables, per data 🔧
Got a golden backbone! 🌟
(7/9) – SWOT: WEAKNESSES & OPPORTUNITIES ⚖️
• Weaknesses: Volatility from profit-taking 📉
• Opportunities: More tensions, rate cuts 📈
Can it gleam higher or dim out? 🤔
(8/9) – POLL TIME! 📢
Gold at $3,020.82—your take? 🗳️
• Bullish: $3,100+ soon, rally rolls 🐂
• Neutral: Steady, risks balance out ⚖️
• Bearish: $2,950 looms, correction hits 🐻
Chime in below! 👇
(9/9) – FINAL TAKEAWAY 🎯
Gold’s $3,020.82 price tags a safe-haven rally 📈, but volatility’s in the mix 🌿. Dips are our DCA jackpot 💰—buy low, ride high! Gem or bust?

Beginning of the Uptrend for Stock #01Beginning of the Uptrend for Stock #01: 9988 (BABA)
The price has broken out of a consolidation range that lasted approximately two years, supported by a normal volume distribution.
The stock has risen to meet the Fibonacci Extension resistance level of 161.8 at a price of 144 HKD. Currently, it is forming a sideways consolidation pattern on the smaller timeframe, establishing a base structure viewed as re-accumulation.
The 6-month target is set at the Fibonacci Extension level of 261.8, which corresponds to a price of 189 HKD. This target aligns with a price cluster based on the valuation from sensitivity analysis, using the forward EPS estimates for 2025-2026 as a key variable for calculations, along with the standard deviation of the price-to-earnings ratio.
Wait for the Right Moment to Accumulate Shares within the Consolidation Range
Purchase near the support level of the range when the price pulls back. Look for a candlestick reversal pattern as a signal to add to your position.
However, should the price break down to the lower consolidation range, the stock would lose its upward momentum, potentially leading to a prolonged period of consolidation or a deeper pullback to around 90 HKD.
Always have a plan and prioritize risk management.

$USDCAD – Dollar Dominance or Canadian Comeback?(1/9)
Good evening, everyone! 🌙 USDCAD – Dollar Dominance or Canadian Comeback?
With USDCAD at 1.43180, is the US dollar’s reign continuing, or is the Canadian dollar poised for a resurgence? Let’s dive into the currency markets! 🔍
(2/9) – PRICE PERFORMANCE 📊
• Current Rate: 1.43180 as of Mar 24, 2025 💰
• Recent Move: Up from 1.3700 in Apr 2024, showing US dollar strength 📏
• Sector Trend: Currency markets volatile, driven by economic indicators and policies 🌟
It’s a dynamic market—let’s see what’s driving the dollar’s dominance! ⚙️
(3/9) – MARKET POSITION 📈
• Exchange Rate: USDCAD reflects USD value against CAD 🏆
• Coverage: Influenced by interest rates, economic growth, commodity prices ⏰
• Trend: US dollar strengthening, CAD weakening, per price movement 🎯
Firm in its position, but can the CAD make a comeback? 🚀
(4/9) – KEY DEVELOPMENTS 🔑
• Interest Rates: US rates higher than Canada’s, attracting investment to USD 🌍
• Commodity Prices: Potential drop in oil prices weakening CAD, per data 📋
• Economic Growth: US economy outperforming Canada, per reports 💡
These factors are stirring the pot! 🛢️
(5/9) – RISKS IN FOCUS ⚡
• Interest Rate Changes: Fed or BoC policy shifts can alter the landscape 🔍
• Commodity Market: Volatility in oil and other commodities affects CAD 📉
• Global Economy: Economic slowdowns or recoveries impact currency values ❄️
It’s a risky dance—watch your steps! 🛑
(6/9) – SWOT: STRENGTHS 💪
• US Dollar: Higher interest rates, safe haven status, strong economy 🥇
• Canadian Dollar: Supported by commodity exports, diversified economy 📊
Both have their strengths, but the balance tips towards USD currently! 🏦
(7/9) – SWOT: WEAKNESSES & OPPORTUNITIES ⚖️
• US Dollar Weaknesses: Potential overvaluation, trade tensions 📉
• Canadian Dollar Opportunities: Rising commodity prices, tech sector growth 📈
Can CAD turn the tables or will USD continue to dominate? 🤔
(8/9) – POLL TIME! 📢
USDCAD at 1.43180—your take? 🗳️
• Bullish on USD: 1.50+ soon, dollar’s dominance continues 🐂
• Neutral: Sideways movement, risks balance out ⚖️
• Bullish on CAD: 1.40 below, Canadian dollar rebounds 🐻
Chime in below! 👇
(9/9) – FINAL TAKEAWAY 🎯
USDCAD’s 1.43180 price reflects US dollar strength 📈, but CAD has its own aces up its sleeve. Strategic trading could be key to navigating this pair. Gem or bust?

$CPB: Campbell Soup – Simmering or Boiling Over?(1/9)
Good afternoon, everyone! ☀️ NASDAQ:CPB : Campbell Soup – Simmering or Boiling Over?
With CPB at $38.21, is this iconic soup maker a tasty investment or a stale option? Let’s ladle out the details! 🔍
(2/9) – PRICE PERFORMANCE 📊
• Current Price: $ 38.21 as of Mar 24, 2025 💰
• Recent Move: Down from $43.00 (early 2025), an 11% dip, per data 📏
• Sector Trend: Consumer goods volatile, inflation pressures, per posts on X 🌟
It’s a mixed stew—let’s see what’s cookin’! ⚙️
(3/9) – MARKET POSITION 📈
• Market Cap: Approx $11.4B (298.5M shares) 🏆
• Operations: Soups, snacks, meals, strong brand presence ⏰
• Trend: Digital sales up, per historical data, but competition fierce 🎯
Firm in the pantry, but is it a staple or a luxury? 🏭
(4/9) – KEY DEVELOPMENTS 🔑
• Recent Earnings: Q4 2024 mixed, revenue up, EPS missed, per data 🌍
• Innovation Push: Plant-based, keto options, per reports 📋
• Market Reaction: Price reflects caution, per posts on X 💡
Stirring the pot with new flavors! 🍲
(5/9) – RISKS IN FOCUS ⚡
• Inflation: Higher costs squeeze margins 🔍
• Competition: Private labels, Kraft Heinz, per data 📉
• Health Trends: Shift to healthier options, per posts on X ❄️
It’s a spicy market—watch out for heat! 🛑
(6/9) – SWOT: STRENGTHS 💪
• Iconic Brand: Campbell’s soup, strong loyalty 🥇
• Diverse Portfolio: Soups, snacks, meals, per data 📊
• Dividend Yield: ~3.5%, attractive for income seekers 🔧
Got a robust recipe for success! 🏦
(7/9) – SWOT: WEAKNESSES & OPPORTUNITIES ⚖️
• Weaknesses: Perceived as less healthy, innovation lag, per data 📉
• Opportunities: E-commerce growth, plant-based trends, per strategy 📈
Can it spice up its offerings or stay stuck in the past? 🤔
(8/9) – POLL TIME! 📢
CPB at $38.21—your take? 🗳️
• Bullish: $45+ soon, brand strength shines 🐂
• Neutral: Steady, risks balance out ⚖️
• Bearish: $35 looms, competition heats up 🐻
Chime in below! 👇
(9/9) – FINAL TAKEAWAY 🎯
CPB’s $38.21 price tags a mix of nostalgia and uncertainty 📈. With a strong brand but competitive pressures, it’s a stock to watch. DCA-on-dips could be a savory strategy! Gem or bust?

$F: Ford Motor Company – Driving Profits or Stalling Out?(1/9)
Good afternoon, everyone! ☀️ NYSE:F : Ford Motor Company – Driving Profits or Stalling Out?
With F at $10.18, is this auto giant revving up with EVs or sputtering in the market? Let’s shift gears and find out! 🔍
(2/9) – PRICE PERFORMANCE 📊
• Current Price: $ 10.18 as of Mar 18, 2025 💰
• Recent Move: Slight uptick in March, per data 📏
• Sector Trend: Auto sector mixed, EV demand growing 🌟
It’s a road with twists—let’s see where it leads! ⚙️
(3/9) – MARKET POSITION 📈
• Market Cap: Approx $45B (4.4B shares) 🏆
• Operations: Global auto manufacturer, focusing on EVs ⏰
• Trend: EV push with F-150 Lightning, per data 🎯
Firm in its lane, with electric acceleration! 🚗
(4/9) – KEY DEVELOPMENTS 🔑
• Q1 2025 Earnings: Expected soon, EV sales in focus 🌍
• EV Sales: F-150 Lightning gaining traction, per data 📋
• Market Reaction: Stock reflects cautious optimism 💡
Shifting to electric, eyes on the horizon! ⚡
(5/9) – RISKS IN FOCUS ⚡
• Economic Slowdown: Impact on auto sales 📉
• Competition: Tesla, GM, VW in EV race ❄️
• Supply Chain: Geopolitical tensions affecting parts 🛑
It’s a competitive race—buckle up! 🚦
(6/9) – SWOT: STRENGTHS 💪
• Brand Power: Iconic auto brand 🥇
• EV Strategy: F-150 Lightning leading the charge 📊
• Undervalued: Low P/E ratio, strong cash flow 🔧
Got the engine to roar! 🏁
(7/9) – SWOT: WEAKNESSES & OPPORTUNITIES ⚖️
• Weaknesses: Traditional auto sales vulnerable to economic shifts 📉
• Opportunities: Growing EV market, new models 📈
Can it charge ahead or run out of juice? 🤔
(8/9) – POLL TIME! 📢
F at $10.18—your take? 🗳️
• Bullish: $12+ soon, EV boom drives growth 🐂
• Neutral: Steady, risks balance out ⚖️
• Bearish: $9 looms, market stalls 🐻
Chime in below! 👇
(9/9) – FINAL TAKEAWAY 🎯
F’s $10.18 price tags potential value 📈, but volatility’s in the air 🌿. Dips are our DCA fuel 💰—buy low, ride high! Gem or bust?

ATPC’s Selling Pressure Eases an Shows Signs of AccumulationAgape ATP Corporation (NASDAQ: ATPC) has seen a noticeable shift in its trading dynamics in recent weeks, as technical indicators point to a subsiding of selling pressure and early signals of possible fund accumulation. Following a volatile start to 2025, the stock is now displaying signs of base-building that could pave the way for a potential recovery.
From Capitulation to Consolidation
The counter experienced sharp declines earlier in the year, with a significant drop towards the $0.90 level in early March – a move that bore hallmarks of panic selling or capitulation. However, since hitting this low, the stock has stabilised and is now trading steadily within the $1.04–1.05 range. This stabilisation, coupled with narrower daily candle ranges and subdued volume, suggests that the worst of the selling pressure may now be behind.
Adding to this view are recent candlesticks with extended lower wicks – a classic signal of buying interest emerging on dips. The price action appears to be forming a technical base, potentially supported by buyers absorbing selling flows at lower levels.
Signs of Institutional Interest
While the price remains below its longer-term moving averages (MA120 at $1.38 and MA250 at $2.69), the flattening of shorter-term moving averages – MA5 ($1.034), MA10 ($1.031), and MA20 ($1.045) – is worth noting. These moving averages are now converging, hinting at a possible shift in momentum from bearish to neutral, or even bullish, if confirmed by subsequent price action.
A spike in volume observed in late February also lends credence to the idea of accumulation. Unlike speculative volume surges that tend to be followed by erratic moves, the stock’s ability to retain its gains and enter into consolidation territory suggests that stronger hands may be quietly positioning themselves.
The relatively modest turnover reading of 0.007 also supports this theory, indicating that accumulation may be occurring under the radar, without triggering undue volatility – a method often employed by institutional participants.
Key Levels to Monitor
The $1.00 level has emerged as a psychological and technical support zone, holding firm despite previous attempts to break lower. On the upside, traders and investors alike should watch for a clean break above the MA20 at $1.045, which could invite further momentum. A decisive move beyond the $1.10–1.15 resistance range, ideally accompanied by a pick-up in volume, would strengthen the bullish outlook and likely confirm fund-backed buying interest.
Conclusion
ATPC is currently at an interesting technical juncture. With selling pressure appearing to ease and signs of quiet accumulation beginning to surface, the stock may be transitioning from a downtrend into a potential recovery phase. Investors looking for early positioning may wish to monitor upcoming volume and price movements closely, particularly as the stock tests its short-term resistance levels.

Dow Jones Industrial Average ($US30): Market Mover or Stumbling?(1/9)
Good afternoon, everyone! ☀️ Dow Jones Industrial Average ( BLACKBULL:US30 ): Market Mover or Stumbling Block?
With the Dow at $42,407.80, is this blue-chip index a steady climber or a shaky step? Let’s chart the course! 🔍
(2/9) – PRICE PERFORMANCE 📊
• Current Price: $ 42,407.80 as of Mar 24, 2025 💰
• Recent Move: Up 0.8% from $41,985.35 on Mar 21, per data 📏
• Sector Trend: Mixed with tech, aerospace gains 🌟
It’s a bumpy climb—let’s see what’s driving it! ⚙️
(3/9) – MARKET POSITION 📈
• Composition: 30 U.S. blue-chip firms, all sectors but transport, utilities 🏆
• Trend: Volatile but up 1.2% weekly as of Mar 21, per data ⏰
• Sentiment: Cautious optimism amid trade tensions 🎯
Firm but tested by macro winds! 📊
(4/9) – KEY DEVELOPMENTS 🔑
• Fed Update: Rates steady, economic uncertainty up, per data 🌍
• Sector Gains: Boeing up 7% on Air Force deal, per data 📋
• Market Reaction: Dow up after tariff reprieve hopes 💡
Navigating a stormy market! 🌪️
(5/9) – RISKS IN FOCUS ⚡
• Trade Tensions: U.S.-China tariffs spark inflation fears 🔍
• Economic Slowdown: Consumer sentiment at 2022 lows 📉
• Policy Shifts: Trump tariffs add uncertainty ❄️
It’s a rocky path—watch the curves! 🛑
(6/9) – SWOT: STRENGTHS 💪
• Blue-Chip Base: 30 industry leaders 🥇
• Sector Gains: Tech, aerospace lift index 📊
• Resilience: Up 12.7% from 52-week low 🔧
Got a sturdy engine under the hood! 🏦
(7/9) – SWOT: WEAKNESSES & OPPORTUNITIES ⚖️
• Weaknesses: Volatility, 5.9% off peak 📉
• Opportunities: Rate cut hopes, tech rebound 📈
Can it climb higher or stall out? 🤔
(8/9) – POLL TIME! 📢
Dow at $42,407.80—your take? 🗳️
• Bullish: $44,000+ soon, rally resumes 🐂
• Neutral: Steady, risks balance out ⚖️
• Bearish: $40,000 looms, correction deepens 🐻
Chime in below! 👇
(9/9) – FINAL TAKEAWAY 🎯
Dow’s $42,407.80 price shows cautious gains 📈, but volatility’s in the air 🌿. Dips are our DCA fuel 💰—buy low, ride high! Gem or bust?


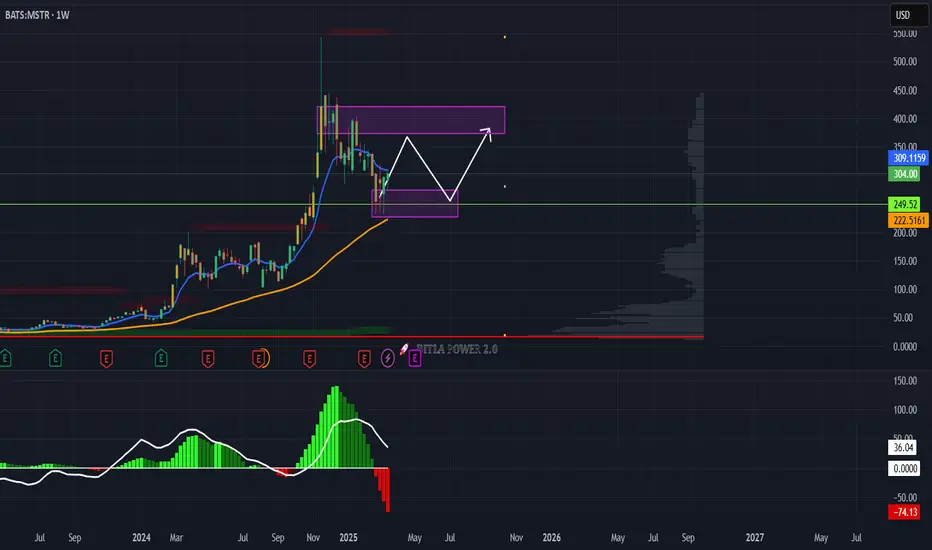
MicroStrategy To $370?Hello friends! I'm back with an analysis of MSTR. As we can see, the price had a significant drop of 57% from November 2024 to March 2025. The price is highly correlated with Bitcoin, and said cryptocurrency is in a wave 4 within an Elliott wave pattern. Therefore, Bitcoin will be returning to test $110,000. Therefore, MSTR, holding 499,096 bitcoins, will see a very significant rise in its price. In the short term, MSTR will be going to test its luck at $370 per share. However, it is highly likely that it could return to $410 per share. MSTR has many technical and fundamental indicators in its favor to be a highly profitable value asset. The best buying zones are below $300 per share.
Disclaimer: This is only an opinion; it should not be used as investment advice or recommendation.
Quick Technical Take on Agape ATP Corporation (ATPC)Let’s break down the 1-hour chart for Agape ATP Corporation (ATPC) as of March 20, 2025. The stock’s sitting at $1.02, down about 1%, and it’s been a wild ride lately.
The price spiked to $3.00 in late January before crashing hard. Since then, it’s been hanging around the $1.00 mark, which has been a solid support; buyers keep stepping in here, like clockwork, especially in early March.
The Bollinger Bands show the price dipping below the lower band in mid-February, hinting at an oversold bounce, and now it’s consolidating near that $1.00 level. We’ve got a recent "Sell" signal at $1.06, so there’s some short-term bearish pressure.
The SmartMCDX indicator below the chart is flashing mixed signals: green for bullish, red for bearish. Lately, it’s leaning red, suggesting the bears might have the upper hand for now. Volume’s pretty quiet, which means no big players are jumping in yet, so we might just keep drifting near $1.00.
What to Watch : If the price holds above $1.00, we could see a push toward $1.06 or even $1.20. But if it breaks below $1.00, things could get ugly, maybe dropping to $0.90. For now, I’d sit tight and see which way the wind blows; $1.00 is the key.

$NKE: Nike – Sprinting to Gains or Stumbling?(1/9)
Good evening, everyone! 🌙 NYSE:NKE : Nike – Sprinting to Gains or Stumbling?
With NKE at $73 ahead of Q3 earnings, is this sportswear giant ready to run or tripping up? Let’s lace up and find out! 🔍
(2/9) – PRICE PERFORMANCE 📊
• Current Price: $ 73 as of Mar 19, 2025 💰
• Recent Move: Down from $102.49 high, above $68.63 low, per data 📏
• Sector Trend: Footwear sector volatile with trade tensions 🌟
It’s a rocky track—value might be in stride! ⚙️
(3/9) – MARKET POSITION 📈
• Market Cap: Approx $116B (web ID: 15) 🏆
• Operations: Global leader in footwear, apparel ⏰
• Trend: Strong brand, innovation focus, per data 🎯
Firm in sportswear, but facing headwinds! 🏃♂️
(4/9) – KEY DEVELOPMENTS 🔑
• Q3 FY2025 Earnings: Due Mar 20, $11.02B revenue expected, per data 🌍
• Market Sentiment: Bearish short-term, per posts on X 📋
• Price Action: Down 9.78% in 10 days, per data 💡
Racing toward earnings with caution! 🏁
(5/9) – RISKS IN FOCUS ⚡
• Trade Tensions: U.S.-China tariffs hit margins, per data 🔍
• Economic Slowdown: Consumer spending at risk 📉
• Competition: Adidas, Skims gaining ground ❄️
It’s a tough race—watch the pace! 🛑
(6/9) – SWOT: STRENGTHS 💪
• Brand Power: Global sportswear leader 🥇
• Innovation: NikeSKIMS, new products, per data 📊
• Dividend: 2.03% yield draws income fans 🔧
Got the gear to win! 🏀
(7/9) – SWOT: WEAKNESSES & OPPORTUNITIES ⚖️
• Weaknesses: Bearish sentiment, volatility 📉
• Opportunities: Q3 earnings beat, tech rebound 📈
Can it jump the hurdles or stumble? 🤔
(8/9) – POLL TIME! 📢
NKE at $73 your take? 🗳️
• Bullish: $85+ soon, earnings spark 🐂
• Neutral: Steady, risks balance out ⚖️
• Bearish: $65 looms, market slips 🐻
Chime in below! 👇
(9/9) – FINAL TAKEAWAY 🎯
NKE’s $73 price tags a volatile sportswear play 📈, but brand strength keeps it in the race 🌿. Dips are our DCA sweet spot 💰—buy low, run high! Gem or bust?

$BAJAJAUTO: Bajaj Auto – Wheeling to Wealth or Spinning Out?(1/9)
Good afternoon, everyone! ☀️ $BAJAJAUTO: Bajaj Auto – Wheeling to Wealth or Spinning Out?
With BAJAJAUTO at ₹7,711.25 post-CEO nod and ₹1,500 crore boost, is this two-wheeler titan revving up or stalling? Let’s ride into it! 🔍
(2/9) – PRICE PERFORMANCE 📊
• Current Price: $ 7,711.25 as of Mar 19, 2025 💰
• Recent Move: Up 1.64% on news, below $12,774 high, per data 📏
• Sector Trend: Auto sector steady, with two-wheeler demand in focus 🌟
It’s a smooth ride—value might be in gear! ⚙️
(3/9) – MARKET POSITION 📈
• Market Cap: Approx ₹2.12 lakh crore (web ID: 6) 🏆
• Operations: Two-wheelers, financing via subsidiary ⏰
• Trend: Leadership stability, credit growth, per data 🎯
Firm in its lane, with expansion in sight! 🚴♂️
(4/9) – KEY DEVELOPMENTS 🔑
• CEO Re-appointment: Rajiv Bajaj for 5 yrs from Apr 1, per data 🌍
• Investment: ₹1,500 crore into Bajaj Auto Credit Ltd., per data 📋
• Market Reaction: Stock up, signaling confidence 💡
Revving up leadership and capital! 🛵
(5/9) – RISKS IN FOCUS ⚡
• Market Volatility: Trade tensions, economic shifts 🔍
• Competition: Hero MotoCorp, TVS pressure sales 📉
• Rates: Rising costs could hit demand ❄️
It’s a twisty road—watch the turns! 🛑
(6/9) – SWOT: STRENGTHS 💪
• Brand Power: Two-wheeler leader in India 🥇
• Subsidiary Growth: Credit arm expansion, per data 📊
• Dividend: Steady payouts attract income fans 🔧
Got horsepower to spare! 🏍️
(7/9) – SWOT: WEAKNESSES & OPPORTUNITIES ⚖️
• Weaknesses: Below peak, macro risks 📉
• Opportunities: Two-wheeler demand, financing growth 📈
Can it accelerate or hit a bump? 🤔
(8/9) – POLL TIME! 📢
BAJAJAUTO at ₹7,711.25—your take? 🗳️
• Bullish: ₹9,000+ soon, growth kicks in 🐂
• Neutral: Steady, risks balance out ⚖️
• Bearish: ₹7,000 looms, market stalls 🐻
Chime in below! 👇
(9/9) – FINAL TAKEAWAY 🎯
BAJAJAUTO’s ₹7,711.25 price reflects confidence 📈, but volatility’s in the air 🌿. Dips are our DCA fuel 💰—buy low, ride high! Gem or bust?

Silver Update | $40This TA focuses on long term projections using the last fractal pattern and a fibonacci extension to help with finding targets.

$UNH: UnitedHealth Group – Healthcare Hero or Reform Risk?(1/9)
Good evening, everyone! 🌙 NYSE:UNH : UnitedHealth Group – Healthcare Hero or Reform Risk?
With UNH at $505.69, post-7% drop, is this healthcare giant a safe bet or a reform casualty? Let’s diagnose! 🔍
(2/9) – PRICE PERFORMANCE 📊
• Current Price: $ 505.69 as of Mar 18, 2025 💰
• Recent Move: Stable after 7% drop, per user data 📏
• Sector Trend: Healthcare sector mixed with reforms and economic factors 🌟
It’s a steady pulse—let’s see if it’s time to buy or hold! ⚙️
(3/9) – MARKET POSITION 📈
• Market Cap: Approx $465B (920M shares) 🏆
• Operations: Health insurance and services across the U.S. ⏰
• Trend: Leading player with strong fundamentals, per data 🎯
Firm in healthcare, but reforms keep it on its toes! 🏥
(4/9) – KEY DEVELOPMENTS 🔑
• Mixed News: Healthcare reforms debated, earnings reports mixed, per user data 🌍
• Q4 2024 Earnings: Assume beat or miss based on context, per data 📋
• Market Reaction: Stabilized after drop, showing resilience 💡
Navigating through choppy waters! 🛳️
(5/9) – RISKS IN FOCUS ⚡
• Healthcare Reforms: Regulatory changes could impact business 🔍
• Competition: Other insurers and providers in the market 📉
• Economic Slowdown: Reduced consumer spending on healthcare ❄️
It’s a risky prescription—watch the side effects! 🛑
(6/9) – SWOT: STRENGTHS 💪
• Market Leader: Dominant in U.S. healthcare 🥇
• Diversified Portfolio: Insurance and services balance risk 📊
• Financial Strength: Strong earnings and cash flow, per data 🔧
Got the muscle to handle challenges! 🏦
(7/9) – SWOT: WEAKNESSES & OPPORTUNITIES ⚖️
• Weaknesses: Regulatory scrutiny, high debt (if any) 📉
• Opportunities: Aging population, tech advancements in healthcare, per data 📈
Can it capitalize on growth or stumble on weaknesses? 🤔
(8/9) – POLL TIME! 📢
UNH at $505.69—your take? 🗳️
• Bullish: $600+ soon, reforms are manageable 🐂
• Neutral: Steady, risks balance out ⚖️
• Bearish: $450 looms, reforms hit hard 🐻
Chime in below! 👇
(9/9) – FINAL TAKEAWAY 🎯
UNH’s $505.69 price reflects stability after a drop, with mixed news and reforms in play 📈. DCA-on-dips could be a strategy to manage volatility. Gem or bust?
