HOOD WEEKLY TRADE IDEA (07/27/2025)
**🚨 HOOD WEEKLY TRADE IDEA (07/27/2025) 🚨**
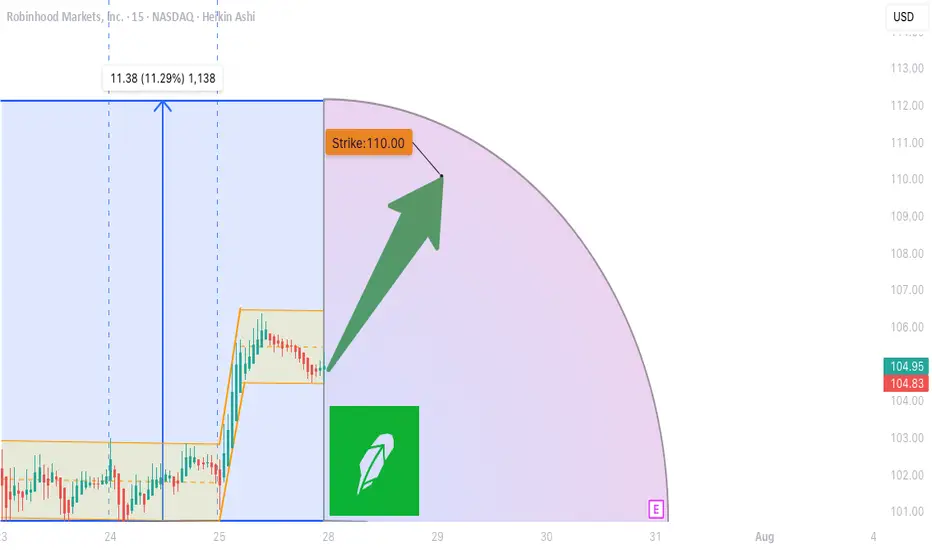
**BULLISH OPTIONS FLOW MEETS EVENT RISK CAUTION**
📊 **Options Flow Snapshot:**
📈 **Call Volume > Put Volume**
🧮 **Call/Put Ratio: 2.30** → **Institutional Bullish Flow**
📈 **Momentum Readings:**
* 🟢 **Daily RSI: Bullish**
* 🟡 **Weekly RSI: Mixed to Weak**
➡️ *Momentum is short-term positive, but not confirmed long-term*
📉 **Volume Insight:**
* **Only 0.7x** last week’s volume
➡️ *Lack of participation = ⚠️ caution*
🌪️ **Volatility Environment:**
* ✅ **Low VIX = Great Entry Timing**
* ❗ Fed Meeting ahead = Binary Event Risk
---
🔍 **Model Consensus:**
All 5 models (Grok, Claude, Gemini, Meta, DeepSeek) say:
🟢 **Moderately Bullish Bias**
✅ Bullish options flow
✅ Daily RSI uptrend
⚠️ Weak volume + Fed caution
---
💥 **TRADE SETUP (Confidence: 65%)**
🎯 **Play:** Long Call
* **Strike**: \$110
* **Expiry**: Aug 1, 2025
* **Entry**: ≤ \$2.90
* **Profit Target**: \$5.80 (🟢 100%)
* **Stop Loss**: \$1.47 (🔻50%)
📆 Entry: **Market Open Monday**
📦 Size: 1 Contract
📈 Risk-Reward Ratio: \~1:2
---
🧠 **Key Risks:**
* 📉 Volume Weakness = No confirmation
* ⚠️ **FED Event Risk** = Watch for Wednesday volatility
* ⏳ Theta decay as expiry nears
---
📌 **JSON TRADE DETAILS (for bots/scripts):**
```json
{
"instrument": "HOOD",
"direction": "call",
"strike": 110.0,
"expiry": "2025-08-01",
"confidence": 0.65,
"profit_target": 5.80,
"stop_loss": 1.47,
"size": 1,
"entry_price": 2.90,
"entry_timing": "open",
"signal_publish_time": "2025-07-27 15:09:35 EDT"
}
```
---
🔥 Stay sharp. Ride the flow, respect the risk.
👀 Watch volume + Fed headlines!
💬 Tag your team: \ NASDAQ:HOOD Bulls loading?
\#HOOD #OptionsTrading #UnusualOptions #FedWeek #WeeklyTradeSetup #TradingView #StockMarket
Investmentidea
$CPNG -> $30-35 range- NYSE:CPNG is south korean e-commerce giant similar to $AMZN.
- It is growing rapidly and has turned profitable
- EPS growth looks amazing for next 3 years.
- NYSE:CPNG is not volatile and has a smooth curve. Therefore, good for buy and hold investors who want their investment grow without worrying about wild draw downs.

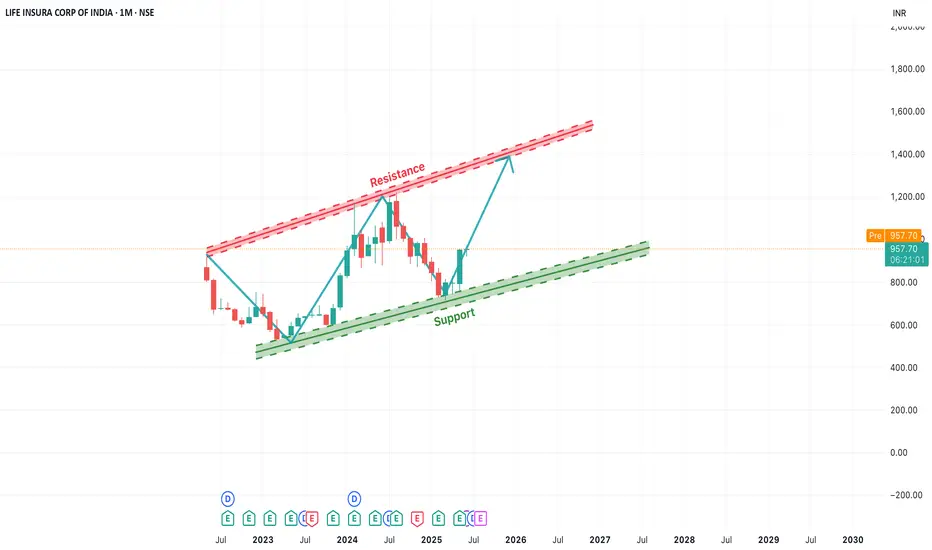
[Long-Term]LICI Rising Channel Pattern Indicates Bullish OutlookIn this monthly chart of LICI, we observe a clear ascending channel pattern forming over the past two years. The price has consistently respected both the support and resistance trendlines, creating a strong bullish structure.
Currently, the stock is bouncing off the lower support trendline, indicating a potential upward move towards the upper resistance zone. This offers a positive long-term outlook, especially if the momentum sustains. The key levels to watch are:
Support Zone: Around ₹850–₹900
Resistance Zone: ₹1250–₹1300
Traders and investors can monitor for a gradual rise toward the resistance level. A breakout beyond this channel may open up new highs, while a breakdown below the support trendline would invalidate the pattern.
Primoris Services: A Long-Term Pick in US Energy Infrastructure◉ Abstract
Our latest analysis focuses on the booming U.S. utility and energy sector, set to hit a massive $1.1 trillion! Learn about the key drivers fueling this growth, from our increasing electricity needs and the electric vehicle revolution to the exciting rise of clean energy.
We have also given a “Buy” rating on Primoris Services Corporation NYSE:PRIM , a major player in building this energy infrastructure. Our analysis reveals their strong financial performance, attractive valuation compared to its peers, and promising technical indicators. While acknowledging potential headwinds like regulatory shifts, we believe Primoris presents a compelling long-term investment opportunity with significant upside potential. Read detailed analysis here and invest smartly.
Read full analysis here...
◉ Introduction
Imagine the companies that bring electricity to your home, the gas for your stove, and are building the future of clean energy. That's the U.S. utility and energy sector! It's a massive part of the American economy, and it's getting even bigger. By 2025, experts predict it will be worth a whopping $1.1 trillion! This includes everything from generating electricity to delivering it through power lines and pipelines, as well as distributing natural gas across the country.
This sector has been steadily growing at about 2.7% each year between 2020 and 2025, and it looks like this growth is going to continue. This article will give you a snapshot of the major reasons behind this growth, top players in this sector, and investment opportunities.
◉ Major Factors Behind the Growth of US Energy Sector
1. Electricity Use is Climbing: Americans are using more power than ever. The EIA expects electricity consumption to hit 4,205 Billion kWh in 2025, up from 4,097 Billion kWh in 2024. This surge is fuelled by increased usage in residential, commercial, and industrial sectors.
2. Everything’s Going Electric: Think about electric cars, heat pumps that heat and cool homes, and even cleaner machines in factories. More and more things are switching to electricity, which means we need even more power! This big shift towards using electricity is called electrification, and it's a major driver for the energy sector.
3. Clean Energy on the Rise: Solar panels and wind turbines are becoming a bigger part of how we get our electricity. These renewable energy sources are growing fast. By 2026, it's expected that they will provide about 27% of all the electricity in the U.S., up from around 25% in 2024. This move towards cleaner energy is really important for the future.
4. Massive Investments Ahead: To keep up with this growing demand and the shift to new technologies, utility companies are investing a lot of money. They are upgrading power grids (the network of lines that deliver electricity), building charging stations for electric vehicles (EVs), and using smart technologies to manage energy better. Experts at S&P Global predict that total spending on these things could be over $790 Billion between 2025 and 2030!
◉ Big Players in Building the US Energy Infrastructure
1. Quanta Services, Inc. NYSE:PWR : A premier provider of specialized infrastructure solutions for the electric power and oil & gas sectors. They are also heavily involved in renewable energy projects like solar and wind farms. You can learn more about them on their official website .
2. Primoris Services Corporation NYSE:PRIM : They provide construction and engineering services for the energy, utility, and infrastructure markets. They are increasingly focusing on building projects related to renewable energy. You can explore their details on their official website .
3. MasTec, Inc. NYSE:MTZ : This is a top infrastructure company in North America, working on energy, utility, and communication projects. This includes building renewable energy facilities, telecom networks, and oil & gas pipelines. You can find more information on their official website .
This report offers an in-depth analysis of Primoris Services Corporation , a prominent player in the U.S. energy infrastructure space.
Our long term recommendation is backed by Primoris Services Corporation ’s technical analysis and fundamental performance.
◉ Investment Advice
💡 Buy Primoris Services Corporation NYSE:PRIM
● Buy Range - 67 - 68
● Sell Target - 88 - 90
● Potential Return - 30% - 45%
● Approx Holding Period - 12-14 months
◉ Revenue and Profit Analysis
● Year-on-Year
- In FY24, Primoris reported revenue of $6,367 Million, marking an 11% increase from $5,715 Million in FY23.
- EBITDA grew to $415 Million, up from $366 Million the previous year, with the EBITDA margin slightly improving to 6.5% from 6.4%.
● Quarter-on-Quarter
- Q4 FY24 revenue reached a record $1,741 Million, up from $1,649 Million in Q3 and 14.9% higher than $1,515 Million in Q4 FY23.
- Despite the revenue growth, Q4 EBITDA declined to $110.6 Million from $123 Million in Q3.
- Diluted EPS (LTM) rose to $3.30 in Q4, up from $3.00 in Q3 FY24, indicating solid earnings momentum.
◉ Valuation
1. P/E Ratio (Price-to-Earnings)
● Compared to Peers:
- PRIM’s P/E is 17.9x, much lower than the peer average of 32.7x. This means the stock is cheaper than most competitors based on earnings.
● Compared to Industry:
- With a P/E ratio of 17.9x, PRIM trades below the industry average of 26.4x, suggesting it offers strong value within the sector.
2. P/B Ratio (Price-to-Book)
● Compared to Peers:
- PRIM’s P/B is 2.6x, while peers average 4.5x—again showing the stock may be undervalued.
● Compared to Industry:
- Compared to the industry average of 4.4x, PRIM still appears to be a bargain.
3. PEG Ratio (Price/Earnings to Growth)
PRIM’s PEG ratio is 0.43, which suggests the stock is not only cheap but also expected to grow earnings strongly—an attractive combination for investors.
◉ Cash Flow Analysis
- Primoris saw a strong improvement in operating cash flow, which jumped to $508 Million in FY24 from $196.8 Million in FY23—a sign of better cash generation from its core business.
◉ Debt Analysis
- With a debt-to-equity ratio of 0.42, the company maintains a solid financial position, suggesting its debt levels are well under control and not overly risky.
◉ Top Shareholders
- The Vanguard Group holds a substantial 11.6% stake in Primoris, reflecting strong confidence in the company.
- BlackRock also increased its investment by 9.65% from Q3 FY24 and now owns approximately 11.3% of the company.
◉ Technical Aspects
- On the monthly chart, the price is in an overall uptrend and has bounced off the trendline support, indicating continued upward momentum.
- On the daily chart, the price has broken through a rounding bottom pattern and is holding above the breakout zone, suggesting a potential for further upside movement.
◉ Potential Risks & Challenges
1. Regulatory Uncertainty: Ongoing concerns about global trade policies, tariffs, and regulatory changes, especially in the solar and battery storage markets, could impact future project economics and timing.
2. SG&A Expenses: Increased by $10.9 Million year-over-year, driven by higher personnel costs and $3.2 Million in severance expenses.
3. Energy Segment Backlog: Experienced a decrease due to the timing of new solar awards, potentially affecting future revenue visibility.
◉ Conclusion
Primoris Services Corporation NYSE:PRIM stands out as a promising investment, backed by consistent growth, strong financials, and a strategic focus on renewable energy and infrastructure. Despite facing risks like regulatory changes and backlog fluctuations, its solid position in the U.S. energy sector—especially with increased demand for clean energy solutions—gives it a clear path forward. With a competitive valuation and support from major investors like Vanguard and BlackRock, Primoris is poised for sustainable growth, making it an attractive long-term opportunity for investors.

What Does Lump Sum Investing Mean for Investors and Traders?What Does Lump Sum Investing Mean for Investors and Traders?
Lump sum investing is when an investor or trader commits a significant amount of capital to the market in one go rather than spreading it over time. This approach is believed to provide strong long-term returns but also comes with risks, particularly in volatile markets. This article explores how lump sum investing works, why investors and traders use it, potential risks, and strategies to manage exposure in different market conditions.
What Is Lump Sum Investing?
Lump sum investing is when an investor puts a significant amount of capital into the market at once, rather than spreading it over time. This approach is common when someone receives a windfall—such as an inheritance, bonus, or proceeds from closing an effective position—and decides to invest the full amount immediately.
Unlike dollar-cost averaging (DCA), which involves dividing an investment into smaller, regular parts, lump sum investing seeks to maximise market exposure from day one. The key argument of investors is that markets tend to rise over time. By investing upfront, capital has more time to grow, rather than sitting on the sidelines waiting to be deployed.
Lump sum investing isn’t limited to equities. It applies across asset classes, including forex, commodities, and fixed income. A trader taking a large position in a currency pair based on a strong technical setup is, in effect, making a lump sum investment—allocating its capital at once rather than scaling in gradually.
Institutional investors also use lump sum strategies, particularly when allocating large amounts into funds or rebalancing portfolios. However, while this method is believed to have strong long-term potential, it exposes investors and traders to market volatility, making risk management a key consideration.
Why Some Investors and Traders Use Lump Sum Investing
Lump sum investing is often used because it puts capital to work immediately, giving it more time to grow. Historical market data supports this approach—studies, including research from Vanguard, have claimed that potential returns are higher in lump sum vs dollar-cost averaging in most market conditions. This is because markets tend to rise over the long term, and waiting to invest can mean missing out on early gains.
Long-term investors typically deploy lump sums when they have high conviction in an asset or when a large amount of capital becomes available. For example, a fund manager rebalancing a portfolio or an individual investing an inheritance may decide to allocate the full amount upfront rather than spreading it out.
In Trading
Traders use lump sum investing differently. While some may use an approach similar to dollar-cost averaging and scale into a position, most traders will deploy capital when they see a high-probability setup. For instance, instead of spreading 1% risk across several trades, they will typically open a position with the entire 1% all at once.
Institutional investors also use lump sum strategies when making block trades or adjusting asset allocations. For example, a pension fund investing in equities after a market downturn may deploy capital in one move to take advantage of lower prices.
However, investing a lump sum of money isn’t just about maximising potential returns—it also involves risk, particularly in volatile markets. The next section explores the potential downsides of this approach.
Potential Risks of Lump Sum Investing
Lump sum investing comes with risks—particularly in volatile markets. The decision to invest everything at once means full exposure from day one, which can work against investors if the market moves against them after deployment. Some key risks to consider include:
Market Timing Risk
Investing a lump sum relies on deploying capital at a single point in time, making it sensitive to short-term market fluctuations. If an investor enters at a peak—such as before the 2008 financial crisis or the early 2022 market downturn—they could face an immediate drawdown. While long-term investors may recover, traders working on shorter timeframes have less room to absorb losses.
Volatility and Psychological Impact
Markets rarely move in a straight line. Lump sum investments can see rapid swings in value, which can be difficult for some investors to handle. Seeing a portfolio drop sharply after investing can lead to emotional decisions, such as panic selling or deviating from an original strategy. Traders face a similar issue when entering a full position—sudden volatility can trigger stop losses or force them to exit prematurely.
Liquidity Risk
For traders, placing a large order in a low-liquidity market can result in slippage, where the trade executes at a worse price than expected. This is especially relevant in forex, small-cap stocks, and commodities with lower trading volume.
How Lump Sum Investing Performs in Different Market Conditions
Market conditions play a major role in how lump sum investing performs. While historical data suggests it often outperforms spreading investments over time, short-term results can vary significantly depending on the broader trend.
Bull Markets
Lump sum investing tends to perform well in sustained uptrends. Since markets generally rise over time, deploying capital early allows one to take advantage of long-term growth. Research from Vanguard found that in about 68% of historical periods, lump sum investing outperformed dollar-cost averaging because assets had more time in the market. A strong bull market—like the one from 2009 to 2021—allowed lump sum investors to see considerable gains over time.
Bear Markets
Investing a lump sum just before a downturn exposes capital to immediate losses. For instance, an investor who entered the market in late 2007 would have faced steep drawdowns during the 2008 crash. Recovery took years, depending on the assets involved.
Although CFD traders can trade in rising and falling markets, the main challenge is to determine a trend reversal and avoid taking a full position just before it happens.
Sideways Markets
When prices move within a range without a clear trend, lump sum investing can be less effective. Investors may see stagnant returns if an asset moves sideways for extended periods, such as during the early 2000s. Traders in choppy markets often break positions into multiple entries to manage risk, rather than committing full capital at once.
Strategies to Potentially Reduce Risk with Lump Sum Investing
Lump sum investing involves full market exposure from the start, which means risk management plays a key role in avoiding unnecessary drawdowns. Understanding how to invest a lump sum of money wisely can help investors and traders potentially manage downside risks.
Assess Market Conditions
Deploying capital blindly can lead to poor outcomes. Investors often analyse valuations, interest rate trends, and macroeconomic factors before making large allocations. For traders, technical indicators such as support and resistance levels, moving averages, and momentum indicators help assess whether market conditions favour a full-position entry.
Diversification Across Assets and Sectors
One key concept in understanding how to invest a lump sum is diversification. Since allocating a lump sum to a single asset increases exposure to its price movements, some investors spread capital across multiple stocks, asset classes, or geographies to reduce concentration risk. A lump sum investment split between equities, bonds, and commodities can smooth out volatility, particularly in uncertain markets.
Hedging Strategies
Once they’ve decided what to do with a lump sum of money, some investors and traders hedge their positions. Opening opposite positions in correlated assets, trading stock pairs, or diversifying exposure across sectors in index trading can act as protection against downside moves, particularly in uncertain or high-volatility environments.
Position Sizing Adjustments
Traders concerned about volatility sometimes split a lump sum trade into staggered entries, adjusting size based on price action. This approach provides flexibility if market conditions shift unexpectedly.
The Bottom Line
Lump sum investing is a popular strategy among investors and traders, offering full market exposure from the start. While it has its advantages, managing risk is crucial, especially in volatile conditions.
FAQ
What Is Lump Sum Investment?
Lump sum investment is when an investor places a large amount of capital into an asset or market all at once instead of spreading purchases over time. This approach is common after receiving an inheritance, bonus, or proceeds from an asset sale. It provides immediate market exposure, which can be advantageous in rising markets but also increases the risk of short-term volatility.
What Is a Lump Sum Trading Strategy?
A lump sum trading strategy entails entering a trade with the entire position size in a single transaction, rather than gradually scaling in. Traders often use this approach when they have strong convictions in a setup. While it maximises potential returns if the market moves favourably, it also increases exposure to short-term price swings.
Is It Better to Invest Lump Sum or DCA?
Lump sum investing has historically outperformed dollar-cost averaging (DCA) in most market conditions because capital is exposed to growth sooner. However, DCA helps manage timing risk by spreading capital over time, making it a common choice for investors concerned about short-term market fluctuations.
What Are the Disadvantages of Lump Sum Investing?
The main risk is market timing—investing at a peak can lead to immediate losses. Lump sum investors also face higher short-term volatility, which can be psychologically challenging. In low-liquidity markets, executing large trades at once may lead to slippage, affecting execution prices.
This article represents the opinion of the Companies operating under the FXOpen brand only. It is not to be construed as an offer, solicitation, or recommendation with respect to products and services provided by the Companies operating under the FXOpen brand, nor is it to be considered financial advice.

Stellantis N.V.Key arguments in support of the idea
The company's shipments are projected to recover in the latter half of the year.
STLA's valuation appears significantly lower compared to its industry peers
Investment Thesis
Stellantis N.V. Stellantis N.V. (STLA), a leading global automotive manufacturer, stands as a dominant force in both North American and European markets. The company boasts a diverse and comprehensive portfolio of automobile brands, encompassing renowned names such as Jeep, Fiat, Peugeot, Maserati, Dodge, Opel, and Chrysler. Ranking among the top five automakers worldwide in passenger car shipments, Stellantis derives approximately 45% of its total revenue from its sales in North America.
Last week, the White House signaled a policy shift by announcing the easing of tariffs for the automotive industry, providing a potentially positive catalyst for automaker stocks. On April 3, the U.S. imposed a 25% tariff on the importation of foreign-manufactured automobiles. This measure will be extended to include similar duties on imported auto parts beginning May 3. The Big Three, namely Ford, General Motors, and Stellantis, produces a portion of its vehicles and several auto parts for the U.S. market in Canada and Mexico. Consequently, these companies
have experienced significant stock declines since the beginning of the year, attributable to the new tariffs. Notably, while three out of every five cars sold by Stellantis in the U.S. are assembled domestically, approximately 20% of their components are imported and thus subject to the 25% tariff. Last Tuesday, President Donald Trump unveiled relaxed tariffs on auto parts, permitting U.S. automakers to reclaim up to 3.75% of the car’s total cost at retail for previously paid duties. This tariff relief could substantially aid Stellantis in recuperating most of its tariff expenses. If 20% of all components in automobiles produced in the region are subject to the 25% tariff, the effective tariff cost on the total vehicle will be 5%, of which 3.75% can be reimbursed. Thus, without any immediate alterations to their supply chains—which they currently have no plans to modify—the duty on a U.S.- manufactured vehicle effectively reduces to 1.25% of its final retail price. While closures and suspensions of certain production sites are inevitable, the overall impact of these duties is less severe than anticipated just weeks prior. It is our assessment that these Big Three automobile manufacturers possess the resilience and strategic capability to navigate and adapt to the newly imposed tariff environment.
Stellantis is strategically realigning its model portfolio, signaling a potential recovery in its market share. In the first quarter of 2025, the automaker unveiled three new models and is poised to introduce an additional ten models aimed at the U.S. and European markets by year's end. This comes despite a 9% y/y decline in shipments during the first quarter. However, the company has managed to bolster its market share in Europe, a trend attributed to the invigorated product lineup. We anticipate that this revitalization will enable Stellantis to achieve a 7.8% y/y increase in shipments during the second half of the year, reaching 2.8 million units. Nonetheless, first-half shipments are expected to remain subdued, a development largely anticipated by current consensus estimates.
STLA shares remain notably undervalued within the automotive sector, presenting a more economical option compared to its peers. Currently, Stellantis is trading at a 2024 EV/EBITDA multiple of 1.4x, significantly lower than the median figure of 3.8x for the six largest U.S. automakers by market share. This year, the company is confronting a "double whammy" of challenges. In addition to contending with the potential financial burden of tariffs, Stellantis has also been grappling with substantial inventory levels—a repercussion of its waning pricing competitiveness. Despite these hurdles, we view this as a strategic opportunity to initiate a long position. It is anticipated that the automotive giant will navigate the emerging challenges of 2025 effectively.
Our target price for the Company is set at $11.3, with a "Buy" recommendation. To mitigate any potential downside risks, we suggest setting a stop-loss at $8.7.

VEA - Hits Target with PrecisionToday, price tapped the target perfectly.
This setup played out exactly as forecasted — clean market structure, precise entry zone, and strong momentum

Invest in STRL: Ride the Coming US Digital Infrastructure Surge◉ Abstract
Sterling Infrastructure (NASDAQ: STRL) is a top pick to benefit from America's digital infrastructure boom, with the sector expected to grow 26% annually through 2034. The company specializes in data centers, 5G networks, and smart city projects, supported by a $1 billion backlog and improving profit margins. While risks like regional market shifts and housing demand exist, STRL's fundamentals are strong—revenue grew 7% in 2024, debt is manageable, and its P/E ratio (17.9x) looks cheap compared to peers (70.5x).
Technically, the stock shows bullish patterns after pulling back 35% from highs. With government infrastructure spending rising and strategic acquisitions likely, STRL could deliver 35-40% returns in the next 12-14 months. A good option for long term investing!
Read full analysis here...
◉ Introduction
The U.S. digital infrastructure market, valued at approximately USD 140 billion in 2024, is expanding rapidly, with a projected CAGR of 26.4% through 2034. This growth is driven by factors like the expansion of 5G networks, increased demand for data centers, rising cloud services adoption, AI automation, and investments in smart cities and edge computing. The 5G infrastructure segment alone is expected to grow at a CAGR of 20.2%, reaching USD 17.26 billion by 2030. North America holds a 42.8% share of the global market.
◉ Key Trends and Opportunities
1. Data Centers: Demand continues to rise, driven by cloud computing, AI, and data-intensive applications. Power availability and location are becoming critical, with providers moving to secondary markets to secure reliable energy sources.
2. Fiber Networks: Expansion is underway to support new data centers and remote connectivity needs. Middle-mile and long-haul fiber, as well as fiber-to-the-home (FTTH), are key areas of investment and consolidation.
3. 5G and Wireless: Ongoing rollout of 5G networks is fueling growth in hardware and network densification, with increased activity expected in wireless infrastructure and tower markets.
4. Edge Computing and Smart Cities: The proliferation of IoT devices and smart city initiatives is driving demand for edge data centers and low-latency networks.
5. Mergers and Acquisitions: The market is seeing consolidation, especially in fiber and data center segments, as major players acquire smaller firms to expand their footprint and capabilities.
Today, we’ll focus on Sterling Infrastructure (STRL), a key player navigating the U.S. infrastructure market.
This report provides a detailed look at STRL's technical and fundamental performance.
◉ Company Overview
Sterling Infrastructure Inc. NASDAQ:STRL is a U.S.-based company specializing in e-infrastructure, transportation, and building solutions. It operates through three key segments: E-Infrastructure Solutions, which focuses on site development for data centers, e-commerce warehouses, and industrial facilities; Transportation Solutions, handling infrastructure projects such as highways, bridges, airports, and rail systems for government agencies; and Building Solutions, providing concrete foundations and construction services for residential and commercial projects. Originally founded in 1955 as Sterling Construction Company, the firm rebranded to its current name in June 2022. Headquartered in The Woodlands, Texas, the company serves a wide range of sectors, including logistics, manufacturing, and public infrastructure.
◉ Investment Advice
💡 Buy Sterling Infrastructure NASDAQ:STRL
● Buy Range - 148 - 150
● Sell Target - 200 - 205
● Potential Return - 35% - 40%
● Approx Holding Period - 12-14 months
◉ SWOT Analysis
● Strengths
1. Strong E-Infrastructure Backlog – With over $1 billion in backlog, Sterling has a robust pipeline of future projects, ensuring sustained revenue growth.
2. Higher-Margin Services Shift – The company’s strategic focus on higher-margin work (21% gross profit margin in Q4) improves profitability without relying solely on volume.
3. E-Infrastructure Growth Potential – Expected 10%+ revenue growth and 25%+ operating profit growth in 2025 position Sterling for strong earnings expansion.
4. Strategic M&A Opportunities – Strong liquidity allows for accretive acquisitions, enhancing market share and service offerings.
5. Share Repurchase Program – Active buybacks reduce outstanding shares, potentially boosting EPS and shareholder value.
● Weaknesses
1. Texas Market Transition Risks – Moving away from low-bid work in Texas may slow revenue growth in the Transportation segment if not managed well.
2. Revenue Loss from RHB Deconsolidation – Excluding $236 million in RHB revenue could distort growth metrics and reduce reported earnings.
3. Residential Market Pressures – A 14% decline in residential slab revenue (due to DFW affordability issues) could persist if housing demand weakens further.
4. Geographic Expansion Challenges – High costs and logistical hurdles in expanding data center projects outside core regions may limit growth opportunities.
5. Competitive Bidding & Acquisition Risks – Difficulty in securing profitable acquisitions or winning competitive bids could hinder margin and revenue growth.
● Opportunities
1. Data Center & E-Commerce Boom – Rising demand for data centers and distribution facilities presents long-term growth potential for E-Infrastructure.
2. Government Infrastructure Spending – Federal and state investments in highways, bridges, and airports could boost Transportation Solutions revenue.
3. Strategic Acquisitions – Pursuing complementary M&A deals could expand capabilities and market reach.
4. Diversification into New Regions – Expanding into underserved markets could reduce dependency on Texas and mitigate regional risks.
5. Operational Efficiency Improvements – Further margin expansion through cost optimization and technology adoption.
● Threats
1. Economic Slowdown Impact – A recession could reduce demand for residential and commercial construction, affecting Building Solutions.
2. Rising Interest Rates – Higher borrowing costs may pressure profitability and delay large-scale projects.
3. Labor & Material Cost Inflation – Increasing wages and supply chain disruptions could squeeze margins.
4. Intense Competition – Rival firms competing for the same infrastructure projects may drive down pricing and profitability.
5. Regulatory & Permitting Delays – Government approvals and environmental regulations could slow project execution.
◉ Revenue & Profit Analysis
● Year-on-Year
➖ FY24 sales reached $2,116 million, reflecting a 7.28% increase compared to $1,972 million in FY23.
➖ EBITDA rose to $334 million, up from $264 million in FY23.
➖ EBITDA margin improved to 15.8%, up from 13.4% in the same period last year.
● Quarter-on-Quarter
➖ Q4 sales decreased to $499 million, down from $593 million in Q3, but showed a slight increase from $486 million in Q4 of the previous year.
➖ Q4 EBITDA was $80.3 million, down from $105 million in Q3.
➖ Q4 diluted EPS saw a notable rise, reaching $8.27 (LTM), up from $5.89 (LTM) in Q3 2024.
◉ Valuation
1. P/E Ratio (Price-to-Earnings)
● Current vs. Peer Average
➖ STRL’s P/E ratio is 17.9x, much lower than the peer average of 70.5x, suggesting the stock is undervalued compared to peers.
● Current vs. Industry Average
➖ Compared to the broader industry average of 22.9x, STRL again looks relatively inexpensive at 17.9x.
2. P/B Ratio (Price-to-Book)
● Current vs. Peer Average
➖ STRL’s P/B ratio stands at 5.7x, slightly higher than the peer average of 5x, indicating overvaluation.
● Current vs. Industry Average
➖ Against the industry average of 3.6x, STRL’s 5.7x P/B ratio suggests a noticeable overvaluation.
3. PEG Ratio (Price/Earnings to Growth)
➖ STRL’s PEG ratio is 0.21, which means the stock appears undervalued relative to its strong expected earnings growth.
◉ Cash Flow Analysis
➖ Sterling Infrastructure's operating cash flow grew to $497 million in FY24, up from $479 million in FY23, showing steady financial strength.
◉ Debt Analysis
➖ The company's debt-to-equity ratio is 0.38, indicating a healthy balance sheet with manageable debt levels.
◉ Top Shareholders
➖ The Vanguard Group has significantly increased its investment in this stock, now owning an impressive 8.3% stake, which marks a 30% rise since the end of the September quarter.
➖ Meanwhile, Blackrock holds a stake of around 8% in the company.
◉ Technical Aspects
➖ On the monthly chart, the stock remains in a strong uptrend.
➖ On the daily chart, an Inverted Head & Shoulders pattern has formed, signaling a potential breakout soon.
➖ The stock is currently trading at about 35% below its all-time high, making it an attractive investment opportunity.
◉ Conclusion
Sterling Infrastructure (STRL) stands out as a strong investment candidate, backed by solid financial performance, a growing E-Infrastructure backlog, and a strategic focus on higher-margin projects. Its attractive valuation, healthy cash flow, and low debt levels provide further confidence in its growth potential. While there are challenges—such as market competition, geographic expansion hurdles, and economic uncertainties—Sterling’s strengths, including a robust project pipeline, strategic acquisitions, and exposure to high-growth sectors like data centers and 5G infrastructure, offer a favorable risk-reward balance. Overall, Sterling is well-positioned to benefit from the ongoing U.S. e-infrastructure boom, making it an attractive long-term investment opportunity.

We're looking for the market to revisit the support zoneWeekly Gold Analysis: XAUUSD
Gold is currently trading at its highest high, showcasing a strong bullish trend. Recent price action has formed a bullish pinbar candlestick pattern, indicating potential buying interest.
Key Support Zone:
- Daily timeframe support zone: $3192.70 - $2168.70
- 50% Fibonacci retracement level, adding confluence to the support zone
Trading Strategy:
1. Buy Setup: We're looking for the market to revisit the support zone ($3192.70 - $2168.70) for a potential buying opportunity.
2. Alternative Scenario: If the market doesn't revisit the support zone, we'll wait for consolidation at current prices and look for bullish signs before entering a long position.
Weekly Outlook:
We'll monitor gold's price action closely and provide updates on any developments. Stay tuned for our analysis and guidance on potential trading opportunities.
Key Levels to Watch:
- Support zone: $3192.70 - $2168.70
- Current price:
- Fibonacci levels: 50% retracement level
Let's see how gold performs this week!

ProShares Short VIX Short-Term Futures ETFInvestment Thesis
ProShares Short VIX Short-Term Futures ETF (SVXY) is a fund that allows you to bet on a decline in volatility with a 0.5x ratio. That is, with a 10% decrease or increase in volatility, this fund will respond with a 5% movement in the opposite direction.
Volatility has significantly increased amid uncertainty due to mutual tariffs between the U.S. and the rest of the world. This presents good opportunities for opening long positions in SVXY.
The risk/reward ratio looks attractive, given that current VIX quotes are near the levels reached during the correction amid the pandemic in 2020. It is also worth noting that the share of S&P 500 components above the 50-day moving average is at local lows, which historically happens rarely and may signal a local potential for market recovery, and thus, a decline in the level of "fear" in the market.
In the base case scenario, we expect that countries will be able to reach agreements regarding the imposed tariffs, which will smooth out the overall impact on the U.S. economy and lead to a reduction in market uncertainty.
Target price – $46.8
Recommendation – Buy
Upside potential – 28%
We recommend setting a stop-loss at the level of $29.9.

BITCOIN ,BTCUSD Hello,Traders!
BITCOIN keeps falling down
In a strong correction move
But the coin will soon hit a
Massive key horizontal
Demand level of 72,500$
From where a bullish
Rebound and a move up
Is likely to happen
Buy!

ISSC: A Key Investment Opportunity in Aerospace and Defense◉ Investment Advice
💡 Buy Innovative Solutions and Support NASDAQ:ISSC
● Buy Range - 11.5 - 11.8
● Sell Target - 14.6 - 15
● Potential Return - 25% - 30%
● Approx Holding Period - 08-12 months
◉ Company Overview
Innovative Solutions and Support, Inc., founded in 1988 and based in Exton, Pennsylvania, is a systems integrator specializing in aviation technology. The company designs, manufactures, and services flight guidance systems, autothrottles, cockpit displays, and related products, including air data computing devices, flight management systems, GPS units, and inertial reference systems. It also provides magnetic variation software and operates manufacturer system software. Serving commercial airlines, corporate aviation, the U.S. Department of Defense, government agencies, foreign militaries, and OEMs, the company delivers advanced solutions for aviation and defense sectors globally.
◉ Market Capitalization - $207 M
◉ Other Key Players in the Same Industry
1. GE Aerospace NYSE:GE - $219.6 B
GE Aerospace is a leading global provider of commercial and military aircraft engines, systems, and services. The company is a subsidiary of General Electric (GE) and has a rich history dating back to 1917.
2. Honeywell International NASDAQ:HON - $144.8 B
Honeywell is a multinational conglomerate that produces a wide range of products, including aerospace systems, industrial control systems, and consumer products. The company's aerospace division is a leading provider of avionics, engines, and other aircraft systems.
◉ Key Drivers of Future Revenue and Profit Growth
1. Growth in Military Programs: New contracts, like the U.S. Army's adoption of the ThrustSense Autothrottle and multifunction displays for foreign military platforms, signal strong future revenue potential in defense markets.
2. ISSC Next Strategy: Focused on commercial growth, this strategy includes new OEM and retrofit programs, product acquisitions, and launches like UMS2, aiming to accelerate revenue growth and improve operating margins.
3. Manufacturing Expansion: Increased in-house production and capacity enhancements are expected to boost operating margins and EBITDA by reducing reliance on external suppliers and improving scale efficiencies.
4. Strategic Acquisitions: Acquisitions, particularly from Honeywell, provide revenue synergies and cross-selling opportunities, diversifying offerings and expanding customer bases to drive profitability.
5. Investment in Advanced Technologies: Innovations like AI-integrated cockpit automation position the company to meet future demand in both commercial and military sectors, supporting long-term earnings growth.
◉ Key Risks to Consider
1. Margin Pressure from Military Sales: The company's reliance on military contracts, which typically have lower gross margins than commercial contracts, may negatively impact overall profitability.
2. Integration Challenges from Acquisitions: The integration of recent acquisitions, such as those from Honeywell, is uncertain and may prove difficult, potentially affecting revenue growth and operating margins.
3. Debt-Related Financial Risks: The significant debt incurred from the Honeywell acquisitions poses a financial risk, which could lead to cash flow constraints or higher interest expenses, impacting net income.
4. Operating Expense Pressures: The planned increase in manufacturing capacity and R&D investment may add pressure on operating expenses. If not managed effectively, this may not translate to proportionate revenue growth, impacting net margins.
5. Revenue Realization Risks: The long sales cycle and complexities associated with military contracts may delay revenue realization. If anticipated backlogs do not convert as scheduled, this could affect short- to mid-term revenue expectations.
◉ Technical Analysis
➖ Following a record high of $14.6, the stock plummeted by nearly 90% and entered a prolonged period of consolidation.
➖ However, a bullish reversal pattern, known as an Inverted Head & Shoulder, has formed during this phase.
➖ With a decisive breakout, the stock has also cleared its long-term trendline resistance, indicating a potential trend reversal.
➖ We expect this upward momentum to persist, driving the stock price higher.
◉ Revenue and Profit Analysis
● Year-on-year
➖ FY24 sales soared 36% to $47.2 million, up from $27.7 million in FY23.
➖ EBITDA jumped to $12.6 million, a significant increase from $8.5 million in FY22.
➖ EBITDA margin expanded to 26.7%, up from 24.32% in the same period.
● Quarter-on-quarter
➖ Q4 sales reached a record high of $15.4 million, surging 30% from $11.8 million in Q3 and 18% from $13 million in Q4 2023.
➖ Q4 EBITDA climbed to $5.9 million, up from $2.6 million in Q3.
➖ Q4 diluted EPS rose to $0.40 (LTM) from $0.37 (LTM) in Q3 2024.
◉ Valuation
● P/E Ratio
➖ ISSC's P/E ratio stands at 29.8x, which is relatively in line with the industry average of 33.7x, indicating fair valuation.
● P/B Ratio
➖ With a P/B ratio of 3.3x, ISSC appears undervalued compared to the industry average of 4.5x.
● PEG Ratio
➖ ISSC's PEG ratio of 1.83 suggests the stock is fairly valued, considering its anticipated earnings growth.
◉ Cash Flow Analysis
➖ ISSC achieves remarkable growth in operational cash flow, rising 176% to $5.8 million in FY24 from $2.1 million in FY23.
◉ Debt Analysis
➖ ISSC's debt-to-equity ratio stands at 0.60, signalling that debt is not a significant concern for the company.
◉ Top Shareholders
➖ The Vanguard Group holds a significant 3% stake in the company, indicating institutional confidence in its growth prospects.
◉ Conclusion
The U.S. aerospace and defense market is projected to grow significantly, reaching an estimated $694.86 billion by 2030, with a compound annual growth rate (CAGR) of 5.76%. This growth is fueled by rapid technological advancements, including innovations in artificial intelligence (AI), advanced materials, 3D printing, and autonomous systems, which are reshaping the industry landscape.
Innovative Solutions and Support, Inc. (ISSC) is strategically positioned to capitalize on this expanding market, leveraging its expertise in advanced aviation systems, strong military and commercial contracts, and ongoing investments in cutting-edge technologies.
For investors seeking exposure to the aerospace and defense industry, ISSC represents a compelling opportunity, supported by its solid financial performance, favorable valuation metrics, and alignment with long-term market trends.

Investing in US Construction & Engineering: PWR vs FIX vs PRIM◉ Abstract
The U.S. construction and engineering sector is experiencing a significant boom, driven by infrastructure investments, rapid urbanization, and the rise of renewable energy projects. Leading companies such as Quanta Services NYSE:PWR , Comfort Systems USA NYSE:FIX , and Primoris Services Corporation NYSE:PRIM are capitalizing on these trends, each demonstrating strong performance. Among them, PRIM stands out with exceptional financial health and attractive valuation metrics, positioning it as a compelling choice for investors. PWR and FIX are also performing well, benefiting from the sector's growth momentum.
With substantial government spending and ongoing urbanization fueling demand, the sector presents promising opportunities for long-term investors. However, thorough research, clear investment goals, and effective risk management remain crucial to navigating this dynamic landscape successfully.
◉ Introduction
The U.S. construction and engineering sector is a vital component of the nation's economy, driving infrastructure development, urbanization, and economic growth. It encompasses various activities, including residential, commercial, industrial, and infrastructure construction, as well as engineering services for design, planning, and project management. Recent trends shaping the sector include urbanization, sustainability, technological advancements, and government investments in infrastructure.
◉ Key Drivers of Growth
1. Infrastructure Investments: $1.2 trillion allocated for roads, bridges, railways, and clean energy infrastructure.
2. Renewable Energy: Funding boost for solar and wind farms driving demand for construction services.
3. Urbanization: Rapid urbanization fueling demand for residential and commercial construction.
4. Sustainability: Emphasis on green building, energy efficiency, and renewable energy projects.
5. Technological Advancements: Adoption of BIM, drones, and automation improving efficiency and reducing costs.
6. Resilience and Disaster Recovery: Demand for resilient infrastructure and disaster recovery projects due to natural disasters.
◉ Key Players in the Sector
1. Fluor Corporation NYSE:FLR : A global leader in engineering and construction, focusing on energy, chemicals, and infrastructure projects.
2. AECOM NYSE:ACM : A multinational firm providing design, consulting, and construction services for infrastructure, transportation, and environmental projects.
3. Quanta Services NYSE:PWR : A leading provider of specialized infrastructure services for the electric power, oil, and gas industries, including renewable energy projects.
4. Comfort Systems USA NYSE:FIX : A major player in mechanical, electrical, and plumbing (MEP) services for commercial and industrial buildings.
5. Primoris Services Corporation NYSE:PRIM : Provides construction services for energy, utilities, and infrastructure projects, with a growing focus on renewable energy.
This report provides a comparative analysis of Quanta Services, Comfort Systems USA, and Primoris Services Corporation, examining their competitive dynamics in the U.S. construction and engineering sector.
◉ Technical Standings
➖ The charts for PWR, FIX, and PRIM exhibit similar trends, with stock prices currently experiencing a strong uptrend.
➖ Based on this momentum, it is expected that this trend will persist, driving prices even higher in the near future.
◉ Revenue & Profit Analysis
● PWR
➖ Q3 FY24 sales: $6.493 billion, up 16% sequentially and 15.5% YoY.
➖ Q3 EBITDA: $619 million, a significant increase from $463 million in Q2 and $542 million in Q3 FY23.
● FIX
➖ Q3 sales: $1.812 billion, flat sequentially but up 30% YoY.
➖ Q3 EBITDA: $238 million, up from $223 million in Q2 and $155 million in Q3 FY23.
● PRIM
➖ Q3 sales: $1.649 billion, an 8% YoY increase and the highest quaterly sales ever.
➖ Q3 EBITDA: $123 million, up from $112 million in Q2.
◉ Valuation
● P/E Ratio
➖ PWR stands at a P/E ratio of 54.2x.
➖ FIX is at a P/E ratio of 32.3x.
➖ PRIM shows a P/E ratio of 24.3x.
◾ These numbers indicate that PRIM is considerably undervalued when compared to its competitors.
● P/B Ratio
➖ PWR's P/B ratio stands at 6.2x.
➖ FIX's P/B ratio is 9.5x.
➖ On the other hand, PRIM's P/B ratio is significantly lower at 3x.
● PEG Ratio
➖ PWR boasts a PEG ratio of 3.54.
➖ FIX’S PEG ratio is recorded at 0.66.
➖ PRIM, meanwhile, has a PEG ratio of 0.90.
◾ Analyzing the PEG ratios reveals that FIX is currently undervalued relative to its peers.
◉ Cash Flow Analysis
All three companies have reported significant improvements in operating cash flow for Q3 FY24:
➖ PWR saw an 82% increase to $740 million (LTM), up from $391 million (LTM) in Q3 FY23.
➖ FIX reported a 41% rise to $302 million (LTM), compared to $214 million (LTM) in Q3 FY23.
➖ PRIM achieved a 133% increase to $416 million (LTM), up from $178 million (LTM) in Q3 FY23.
◉ Debt Analysis
➖ PWR has a Debt to Equity ratio of 0.6.
➖ FIX shows a Debt to Equity ratio of 0.19.
➖ In contrast, PRIM has a Debt to Equity ratio of 0.73.
◾ FIX boasts the lowest debt-to-equity ratio, indicating a stronger balance sheet and reduced reliance on debt financing compared to its peers.
◉ Top Shareholders
● PWR
➖ The Vanguard Group - 11.4%
➖ BlackRock - 7.62%
● FIX
➖ The Vanguard Group - 10.5%
➖ BlackRock - 14%
● PRIM
➖ The Vanguard Group - 11.5%
➖ BlackRock - 10.4%
◉ Conclusion
After a comprehensive analysis of the major players in the U.S. Construction & Engineering sector, including an in-depth review of technical capabilities and financial performance, Primoris Services Corporation NYSE:PRIM emerges as a standout candidate. The company’s robust financial health, supported by strong cash reserves, positions it well to navigate challenges such as debt concerns.
The sector as a whole is poised for significant growth, driven by massive government spending on infrastructure and the ongoing trend of rapid urbanization. For investors, this presents a compelling opportunity. However, it is essential to conduct thorough research, establish clear investment objectives, and maintain a long-term perspective to capitalize on this growth while effectively managing risks.

Ralph Lauren: Elevate Your Wealth with the Essence of Luxury◉ Abstract
Ralph Lauren is thriving in the booming luxury apparel market. The company, founded in 1967, has a market cap of $11.83 billion and generates nearly 44% of its revenue from North America, totaling $2.93 billion. The industry is valued at approximately $110.13 billion in 2024 and projected to reach $151.32 billion by 2029, growing at a CAGR of 6.56%.
Recent technical analysis shows Ralph Lauren's stock has outperformed the NYSE Composite index with a 66% annual return. Despite a slight revenue increase of 2.9% year-on-year, EBITDA soared to $1,024 million, reflecting strong financial health. With a current P/E ratio of 17.4x, Ralph Lauren presents an attractive investment opportunity amidst rising global wealth and consumer demand for luxury goods.
Read full analysis here . . .
◉ Introduction
The global luxury apparel market is currently experiencing significant growth, driven by various factors including increasing disposable incomes, brand loyalty, and the rising influence of social media on consumer behaviour.
Here’s a detailed overview of the market size and growth outlook:
◉ Current Market Size
According to Mordor Intelligence, the global luxury apparel market was valued at approximately USD 110.13 billion in 2024, with expectations to grow to USD 151.32 billion by 2029, reflecting a CAGR of 6.56%.
◉ Growth Drivers
● Increasing Wealth: The rising number of millionaires globally and growing middle-class affluence, particularly in regions like Asia-Pacific, are significant contributors to luxury apparel demand.
● Consumer Trends: There is a growing perception that luxury goods enhance social status, which fuels consumer interest in high-end fashion.
● Digital Influence: Enhanced online shopping experiences and the effective use of social media for marketing have opened new avenues for luxury brands to reach consumers.
◉ Regional Insights
● Europe
Dominant Market: Holds a market share of approximately 34% to 43%. The presence of numerous luxury brands and high purchasing power among consumers drive demand, supported by significant tourist spending on luxury goods.
● North America
Strong Demand: The U.S. is a key player, characterized by a wealthy consumer base and increasing brand loyalty, particularly among younger generations who view luxury items as status symbols.
● Asia-Pacific
Fastest Growing Market: Anticipated to grow rapidly due to rising disposable incomes and brand awareness, especially in countries like China and India.
● Latin America
Emerging Potential: Currently holds a smaller market share but shows promise for growth as consumer awareness and travel increase.
● Middle East & Africa
Limited Contribution: This region contributes the least to the luxury apparel market, although countries like the UAE are seeing growth due to tourism.
The overall outlook for the luxury apparel market remains optimistic, supported by evolving consumer preferences and increasing global wealth.
Amidst the global luxury apparel market's promising growth prospects, we have identified Ralph Lauren as a prime opportunity for investment. With its robust financial performance and impressive technical indicators, Ralph Lauren is well-positioned to propel success.
◉ Company Overview
Ralph Lauren Corporation NYSE:RL is a renowned American fashion company known for its high-quality, luxury lifestyle products. Founded in 1967 by the iconic designer Ralph Lauren, the company has become a global symbol of timeless style and sophistication. The company offers a wide range of products, including apparel, footwear, accessories, home goods, fragrances, and hospitality. Ralph Lauren's iconic polo shirt and strong brand identity have contributed to its success, making it a global leader in the luxury fashion industry.
◉ Investment Advice
💡 Buy Ralph Lauren Corporation NYSE:RL
● Buy Range - 190 - 193
● Sell Target - 245 - 250
● Potential Return - 27% - 30%
● Approx Holding Period - 8-10 months
◉ Market Capitalization - $11.83 B
◉ Peer Companies
● Tapestry NYSE:TPR - $10.59 B
● Levi Strauss NYSE:LEVI - $8.57 B
● PVH Corp. NYSE:PVH - $5.44 B
● Columbia Sportswear Company NASDAQ:COLM - $4.87 B
◉ Relative Strength
The chart clearly illustrates that Ralph Lauren has greatly outperformed the NYSE Composite index, achieving an impressive annual return of 66%.
◉ Technical Aspects
● Monthly Chart
➖ The monthly chart clearly shows that the stock price faced several rejections near the 190 level, which ultimately triggered a significant drop, brought the price down to the 66 level.
➖ Afterward, the price experienced various fluctuations and, after a prolonged consolidation phase, developed an Inverted Head & Shoulders pattern.
➖ Upon breaking out, the price surged upward but encountered resistance again at the previous resistance zone.
➖ However, after a pullback, the stock has successfully surpassed this resistance for the first time in almost 11 years.
● Daily Chart
➖ On the daily chart, the price has formed a Rectangle pattern following a brief consolidation phase and has recently made a breakout.
➖ If the price can hold above the 190 level, we can expect a bullish movement in the coming days.
◉ Revenue Breakdown - Location Wise
Ralph Lauren Corporation is a global luxury brand with a strong presence in various regions.
➖ North America remains Ralph Lauren's biggest market, contributing nearly 44% of its total revenue, which amounts to $2.93 billion.
➖ In Europe , the brand is seeing consistent growth, with revenue reaching around $2 billion, making up about 30% of total earnings.
➖ Asia , especially China, is becoming a key player for Ralph Lauren, generating approximately $1.58 billion, or 24% of total revenue.
◉ Revenue & Profit Analysis
● Year-on-year
➖ In the fiscal year 2024, the company achieved a modest revenue increase of 2.9%, totaling $6,631 million, compared to $6,443 million in the prior year.
➖ On the other hand, EBITDA growth has been remarkable, soaring to $1,024 million from $801 million in FY23. The current EBITDA margin stands at an impressive 15.5%.
➖ Additionally, diluted earnings per share (EPS) experienced a substantial year-over-year rise of 28%, reaching $9.71 in FY24, up from $7.58 in FY22.
● Quarter-on-quarter
➖ In terms of quarterly performance, the company reported a decline in sales over the last three quarters, with the most recent quarter showing sales of $1,512 million, down from $1,568 million in March 2024 and $1,934 million in December 2023.
➖ Nevertheless, EBITDA demonstrated significant growth in the June quarter, climbing to $265 million from $176 million in March 2023.
◉ Valuation
● P/E Ratio
➖ Current P/E Ratio vs. Median P/E Ratio
The current price-to-earnings ratio for this stock stands at 17.4x, which is notably elevated compared to its four-year median P/E ratio of 5.7x. This suggests that the stock is presently overvalued.
➖ Current P/E vs. Peer Average P/E
When evaluating the stock's Price-To-Earnings Ratio of 17.4x, it shows a more attractive valuation, as it is lower than the peer average of 25.5x.
➖ Current P/E vs. Industry Average P/E
RL is positioned at a more appealing price point, with a Price-To-Earnings Ratio of 17.4x, which is significantly less than the US Luxury industry's average of 19.x.
● P/B Ratio
➖ Current P/B vs. Peer Average P/B
The current P/B ratio reveals that the stock is considerably higher than its peers, with a ratio of 5x compared to the peer average of 3x.
➖ Current P/B vs. Industry Average P/B
In comparison to the industry average, RL's current P/B ratio of 5x indicates that it is substantially overvalued, as the industry average is only 2.2x.
● PEG Ratio
A PEG ratio of 0.54 suggests that the stock is undervalued relative to its expected earnings growth.
◉ Cash Flow Analysis
In fiscal year 2024, operational cash flow experienced remarkable growth, reaching $1,069 million, a substantial increase from $411 million in fiscal year 2023.
◉ Debt Analysis
The company currently holds a long term debt of $1,141 million with a total equity of $2,367 million, makes long-term debt to equity of 48%.
◉ Top Shareholders
➖ The Vanguard Group has significantly increased its investment in this stock, now owning an impressive 8.23% stake, which marks a 3.9% rise since the end of the March quarter.
➖ Meanwhile, Blackrock holds a stake of around 4.11% in the company.
◉ Conclusion
After a thorough evaluation, we find that Ralph Lauren Corporation is strategically poised to thrive in the expanding luxury apparel market, driven by increasing disposable incomes and a growing appetite for high-end products.

Kalyan Jewellers: Continuation H&SPrices have formed a continuation Head & Shoulders whose neckline is 775 zone. Prices have given a breakout of the neckline and likely to continue the uptrend. The measured target of the pattern is coming in the region of 950 zone. On the downside the key level is 712.

EdTech Unicorn Stride Surges: Strong Financials Fuel Rally!The EdTech revolution is progressing rapidly! As technology advances, internet access grows swiftly, and students seek innovative learning methods, the global EdTech market is flourishing.
North America currently holds a significant 37.3% share, but regions such as the Middle East and Africa, Europe, and Asia-Pacific are gaining ground, fueled by government support, digital literacy, and a burgeoning middle class. It's an exciting time for digital learning, and there's even more to look forward to!
◉ EdTech Market Growth Outlook
➖ Valuation projected to rise from $220.5 million in 2023 to $810.3 million by 2033.
➖ Compound Annual Growth Rate (CAGR) of 13.9%.
◉ Government Initiatives Supporting EdTech Sector
The US Department of Education has allocated $277 million in new grants through the Education Innovation and Research program to enhance educational equity and innovation, particularly in areas affected by the COVID-19 pandemic, specifically focusing on STEM education and rural regions.
Recognizing the enormous opportunity in EdTech, we're examining a stock that exhibits remarkable growth potential within the sector.
◉ Company Overview
Stride Inc. NYSE:LRN is a tech-driven education service provider offering proprietary and third-party online curricula, software, and services in the U.S. and globally. Their products support personalized learning for K-12 students through virtual and blended public schools, individual online courses, and supplemental materials in subjects like math, English, science, and history. Stride also emphasizes career learning in fields such as IT, healthcare, and business, and operates tuition-based private schools. Additionally, they provide post-secondary programs in software engineering and healthcare under brands like Galvanize and Tech Elevator, along with staffing services. Rebranded from K12 Inc. in December 2020, Stride has been incorporated since 1999 and is headquartered in Reston, Virginia.
Investent Advice by Naranj Capital
Buy Stride NYSE:LRN
● Buy Range- 77 - 80
● Target- 115 - 120
● Potential Return- 45% - 50%
● Invest Duration- 12-18 Months
◉ Market Capitalization - $3.31 B
◉ Peer Companies
➖ Graham Holdings NYSE:GHC - $3.23 B
➖ Adtalem Global Education NYSE:ATGE - $2.67 B
➖ Grand Canyon Education NASDAQ:LOPE - $4.04 B
➖ Laureate Education NASDAQ:LAUR - $2.25 B
◉ Technical Aspects
● Monthly
➖ The stock price initially faced resistance at $40 in 2011 but later found support at $17.
➖ Despite several attempts to break through resistance, the stock experienced significant declines.
➖ However, after a 12-year period, it finally broke out and rallied to a high of $84.
➖ Currently trading at $77.7, the stock is expected to continue rising in the near future
● Daily
➖ The daily chart indicates a clear uptrend in the price movement.
➖ An ascending triangle pattern has formed, and following the breakout, the price has retraced to the breakout level.
➖ At this moment, the price is attempting to find support at the 50 EMA.
➖ From a technical standpoint, the stock is resting at a support level, making it an attractive option for accumulation with a mid to long-term investment outlook.
◉ Relative Strength
➖ The chart clearly illustrates that Stride Inc. has greatly outperformed the US Smallcap 2000 index, achieving an impressive annual return of 82%, which is a notable achievement.
◉ Revenue & Profit Analysis
● Year-on-year
➖ In FY24, revenue surged by 11.3%, reaching $2,040 million, up from $1,837 million in FY23.
➖ EBITDA saw a substantial boost, climbing to $295.3 million in FY24 compared to $225.2 million the previous year.
➖ The EBITDA margin also experienced growth, rising to 14.47% from 12.26% in FY23.
➖ Additionally, diluted EPS witnessed an impressive increase of 57.91%, jumping to $4.69 in FY24 from $2.97 in FY23.
● Quarter-on-quarter
➖ In the latest June quarter, the company achieved a remarkable milestone with quarterly sales reaching an all-time high of $520.8 million. This marks a 3% increase from the $504.9 million recorded in the March quarter and a significant 10.75% rise compared to $470.3 million in the same quarter last year.
➖ EBITDA declined from $100.2 million to $82.3 million in the latest quarter, representing a 17.8% decrease.
◉ Valuation
◉ PE Ratio
● Current PE Ratio vs. Median PE Ratio
➖ The present price-to-earnings ratio for this stock is 16.2x, which is considerably below its four-year median price-to-earnings ratio of 18.9x times, indicating that the stock is currently undervalued.
● Current PE vs. Peer Average PE
➖ The stock presents a favorable valuation when considering its Price-To-Earnings Ratio of 16.2x, which is lower than the average of its peers at 18.3x.
● Current PE vs. Industry Average PE
➖ Stride appears to be offered at a more competitive price, featuring a Price-To-Earnings Ratio of 16.2x, which is significantly below the average of 19.2x for the US Consumer Services industry.
◉ PB Ratio
● Current PB vs. Peer Average PB
➖ The present PB ratio in relation to the average PB of peers indicates that the stock is somewhat higher, with a ratio of 2.8x in contrast to the peer average of 2.6x.
● Current PB vs. Industry Average PB
➖ When comparing the current PB ratio to the industry average, Stride appears to be considerably overvalued, exhibiting a PB ratio of 2.8x, while the industry average stands at 1.6x.
◉ Cash Flow Analysis
➖ The cash generated from operations has experienced substantial growth in fiscal year 2024, increasing to $278.8 million from $203.2 million in fiscal year 2023.
◉ Debt Analysis
➖ Stride has a total debt of $528.2 million, resulting in a debt-to-equity ratio of 0.44.
➖ The company generates sufficient interest income to exceed its interest expenses, indicating that interest payment coverage is not an issue.
◉ Top Shareholders
➖ BlackRock Inc. holds a significant ownership interest in this company, with a notable stake of 14.9%. This level of investment reflects BlackRock's confidence in the company's potential for growth and profitability.
➖ The Vanguard Group also maintains a considerable presence, owning 10.7% of the company's shares.
➖ Together, these two investment giants represent a substantial portion of the company's equity, indicating strong institutional support and interest in its future performance.
◉ Conclusion
Upon examining Stride Inc.'s financial performance, we focused on essential metrics such as revenue growth, profit margins, and the stability of cash flow. Additionally, we assessed the company's future growth potential by looking into industry trends and the competitive landscape.
As a result, we are confident that Stride Inc. is positioned to capitalize on new opportunities while effectively navigating challenges, making it an attractive option for both investors and stakeholders.

BULLISH REVERSAL SETUP SEEN IN HBL ENGINEERING LTD📊 StockTrade Setup Details
Name: NSE:HBLENGINE HBL Engineering Ltd.
Exchange: NSE (National Stock Exchange, India)
📈 Current Market Price (CMP): ₹527.85
💡 Key Levels:
🚀 Entry Point: ₹494.40
Buy when the price reaches this level (near support).
❌ Stop-Loss (SL): ₹472.25
Exit if the price drops below this level to minimize losses.
🏁 Take-Profit (TP) Levels:
TP1: ₹518.65 🏆 (First conservative target).
TP2: ₹594.40 🥈 (Moderate profit zone).
TP3: ₹702.50 🥇 (Aggressive target for maximum gain).
⚖️ Risk-to-Reward Ratio (RRR):
Risk:
Entry to SL: ₹494.40 - ₹472.25 = ₹22.15
Reward:
TP1: ₹24.25 ➡️ RRR ~ 1:1.1
TP2: ₹100.00 ➡️ RRR ~ 1:4.5
TP3: ₹208.10 ➡️ RRR ~ 1:9.4
📈 Technical Observations
📉 Trend Analysis:
A sharp bearish move recently (large red candle).
Anticipating a bullish reversal from the support zone.
🛠️ Support Levels:
Zone: ₹472 – ₹494
SL is placed slightly below this zone for risk management.
📏 Resistance Levels:
TP1: ₹518.65
TP2: ₹594.40
TP3: ₹702.50
Extended Target: ₹740.35
📊 Volume: Moderate to high volume shows active trading interest.
🔴Disclaimer:
I am not a SEBI-registered advisor. Investments and securities are subject to market risk. Please Read carefully this idea.This analysis and the suggested levels are for educational purposes only Trade responsibly and at your own risk.
If you find this analysis helpful, please like and share
@Alpha_strike_trader

Havells breaking out for 1500Havells is on the verge of breakout of Lower Low Lower High Trend as well as the Down trendline. CMP 1289 . in case price comes down then averaging can be done till 1190 which is strict stoploss as well with strict stoploss of 1500

A NEAR PSYCHOLOGICAL SUPPORT SEEN IN NSE: JBMA AUTO 🔸️A technical analysis of JBM Auto Ltd. (NSE: JBMA), outlining a long-term investment plan with an investment period of 3-5 months. Here's a breakdown of the levels and strategy:
✅️Entry Timing: Wait for the price to either approach ₹1,389 for an optimal entry or confirm an upward breakout.
☑️Entry: ₹1,389.10
🔴Stop Loss: ₹1,352.30
🔰Targets:
🟠TP1: ₹1,449.90
🟡TP2: ₹1,499.85
🔵TP3: ₹1,606.25
🟢TP4: ₹1,681.00
♻️Holding Period: 3-5 months.
🚰Strategy: Buy near ₹1,389, use stop loss, and book profits gradually at targets.
🔴Disclaimer:
I am not SEBI registered. This information is purely for educational purposes and not financial advice. The securities market is subject to market risks; please do your own research...
If you like this idea like share amd subscribe @Alpha_strike_reader

A BULLISH TRADE SETUP FOR TCS BASED ON RESULT IMPACT:A BULLISH TRADE SETUP FOR NSE:TCS BASED ON RESULT IMPACT:
If the price breaches the entry point (₹4,052.15): The trade becomes active, and the targets can be tracked.
If the price breaks below the stop loss (₹3,951.05): The trade should be exited to avoid further losses.
1. 🔵ENTRY: ₹4,052.15
2. 🔴STOP LOSS: ₹3,951.05 (PROTECTION AGAINST DOWNSIDE)
3. TARGETS:
🟢TP1: ₹4,171.95
🟢TP2: ₹4,248.20
🟢TP3: ₹4,429.95
ANTICIPATION OF POSITIVE EARNINGS IS DRIVING THE SETUP. THE RISK-REWARD RATIO IS FAVORABLE (~1:3.7). MONITOR PRICE ACTION AND VOLUME FOR CONFIRMATION BEFORE ENTERING.
Potential Actions:
🔴Disclaimer: I am not a SEBI-registered advisor. This analysis is for educational and informational purposes only and should not be considered as financial advice. Investments in the stock market are subject to market risks. Please do your own research or consult a SEBI-registered advisor before making any investment decisions.

#bullish zone ''zomato signaling uptrend...( near support zone)investing idea Observations and Analysis for NSE:ZOMATO
1.Price Correction:
Zomato has seen a 26% correction, primarily due to market volatility. The price is approaching a strong support zone between ₹240-₹244, which presents a potential buying opportunity for long-term investing.
2.Entry Strategy:
Entry Zone: Wait for confirmation of price stability within ₹240-₹244 before entering a position.
🔴Stop-Loss: Set a strict stop-loss at ₹233.74 to minimize potential losses.
3.Target Levels:
🟢TP1: ₹255.55
🟢TP2: ₹262.90
🟢TP3: ₹279.10
🟢TP4: ₹286.45
4.Risk Management:
Use proper position sizing and risk management as the market remains volatile. Ensure you do not risk more than you can afford to lose.
🟠Disclaimer:-
I am not a SEBI-registered advisor. This analysis and the suggested levels are for educational purposes only. Please consult a professional financial advisor for personalized investment advice. Trade responsibly and at your own risk.
If you find this analysis helpful, please like and share!

Suntek realtyFrom the Covid low of 145 zone prices have given a rally for two years and made a high of 590 in Jan'22. From there prices have retraced 50% and made a low of 272 and recovered back to hit new all time high.
Prices have made a continuation Head & shoulders pattern whose neckline is 500 zone. Prices have given the breakout the neckline and currently retesting the same. The measured target of the pattern is 950 zone.
Prices are likely to continue the uptrend towards 950-1000 zone in the coming months. The key level for the same is 380.

Atour: The Smart Way to Invest in China's Hospitality Market◉ Abstract
Atour Lifestyle Holdings Limited is taking advantage of China's fast-growing hotel industry. The hospitality sector of China is expected to reach $157.46 billion by 2032, growing at a rate of 8.23% each year. This growth comes from a strong economy, more people moving to cities, and an increase in travel. Atour uses a smart business model that allows for quick expansion while keeping costs low. They offer a variety of hotel brands and even sell sleep-related products.
In FY23, Atour's sales jumped to $657.4 million, a 106% increase from the previous year, along with strong earnings growth. With over 83 million members in its loyalty program and a focus on great customer experiences, Atour is set for continued success in China's hospitality market.
Overview of the Hotel Service Industry in China.
Continue reading full article here:
◉ Overview of the Hotel Service Industry in China
China's hotel service industry is on the cusp of a remarkable growth spurt, fueled by the country's soaring economy, rapid urbanization, and an unprecedented surge in domestic and foreign travel.
● Projected Market Value: $157.46 billion by 2032
● Growth Rate: 8.23% Compound Annual Growth Rate (CAGR) from 2024 to 2032
◉ What's Driving this Growth?
● Economic Growth: China's economy continues to expand, boosting disposable incomes and travel budgets.
● Urbanization: As more Chinese citizens move to cities, they're seeking better travel experiences and accommodations.
● Increased Travel: Both domestic and foreign travel are on the rise, driving demand for hotels and travel services.
As China's hotel service industry experiences rapid growth, Atour Lifestyle Holdings NASDAQ:ATAT Company has established itself as a prominent force in the market. By delivering a unique blend of comfort, style, and local charm, Atour is redefining the hospitality landscape in China.
Atour's strategic focus on mid-to-upscale hotels enables the company to provide immersive local experiences, innovative design, and exceptional service. This distinctive approach has fostered a loyal customer base and positioned Atour for continued success in China's burgeoning hotel market.
◉ Investment Advice
💡 Buy Atour Lifestyle Holdings NASDAQ:ATAT
● Buy Range - 27 - 27.5
● Sell Target - 36 - 37
● Potential Return - 30% - 35%
● Approx Holding Period - 12-14 months
◉ Business Model
Atour Lifestyle Holdings Limited utilizes an asset-light, franchise-oriented business model that enables rapid expansion and operational efficiency in China's hotel industry. Here are the key components:
● Manachised Model: Atour primarily operates through a "manachised" model, where franchisees handle capital expenditures and hotel leases while Atour provides management and training. This approach minimizes operational costs and maximizes revenue from franchise royalties.
● Diverse Brand Portfolio: The company offers various hotel brands, including Atour, Atour S, Atour X, and ZHOTEL, catering to different market segments and customer preferences.
● Retail Integration: Atour has expanded into retail by selling sleep-related products, generating significant revenue and enhancing the guest experience.
● Customer Loyalty Programs: The A-CARD loyalty program boasts over 63 million members, driving customer retention and engagement through various benefits.
● Digital Capabilities: Atour leverages technology for a seamless customer experience, allowing easy online bookings and efficient communication during stays.
● Focus on Experience: The company emphasizes delivering unique lifestyle experiences through thematic hotels and tailored offerings.
◉ Key Competitors
1. Huazhu Group (H World Group): A leading competitor with over 10,150 hotels, Huazhu operates a similar manachised model and has been expanding rapidly, making it one of the largest players in the market.
2. Jin Jiang International: With a vast portfolio exceeding 12,000 hotels, Jin Jiang is another major competitor that employs a mix of franchising and management strategies.
3. GreenTree Hospitality Group: Focused on midscale accommodations, GreenTree operates around 3,000 hotels and utilizes a franchise-based model with manachised elements.
4. BTG Homeinns Hotels: Known for its budget offerings, BTG Homeinns has a significant presence with thousands of hotels primarily targeting domestic travelers.
5. Plateno Group (7 Days Inn): Operating primarily in the budget segment, Plateno utilizes a manachised approach to grow its network of over 3,000 hotels.
These companies dominate the domestic market, while international brands like InterContinental Hotels Group (IHG) and Shangri-La Hotels & Resorts lead the high-end segment.
◉ Strategic Initiatives Powering Atour's Growth Trajectory
● Expanded Hotel Network: 140 new hotels added in Q3 and 732 under development, increasing capacity and driving revenue growth.
● Upscale Brand Introduction: SAVHE Hotel launch in core business districts, enhancing occupancy and average daily rate (ADR).
● Retail Segment Growth: 107.7% year-over-year GMV growth in 'deep sleep' products, boosting revenue and net margins.
● Membership Base Expansion: Over 83 million members, increasing revenue potential through customer loyalty and repeated business.
◉ Revenue & Profit Analysis
● Year-on-year
➖ FY23 sales reached $657.4 million, a remarkable 106% increase from $328 million in FY22.
➖ EBITDA surged to $142 million, up from $36 million in FY22.
➖ The EBITDA margin widened to 21.6% from 11.15% in the same period.
● Quarter-on-quarter
➖ Q3 sales reached $270 million, a 9% increase from $247 million in Q2 and a 52% jump from $177 million in Q3 2023.
➖ Q3 EBITDA climbed to $72.6 million, up from $56.2 million in Q2.
➖ Q3 diluted EPS rose to $0.39 (LTM) from $0.30 (LTM) in Q2 2024.
◉ Valuation
● P/E Ratio
ATAT has a P/E ratio of 24x, which is fairly valued when compared to the peer average of 23.7x.
● PEG Ratio
With a PEG ratio of just 0.15, ATAT appears to be undervalued based on its anticipated earnings growth.
◉ Profitability Analysis
With a 30.7% ROCE, ATAT demonstrates its expertise in generating substantial profits through efficient capital allocation.
◉ Cash Flow Analysis
ATAT achieves remarkable growth in operational cash flow, rising 582% to $280 million in FY23 from $41 million in FY22.
◉ Debt Analysis
ATAT's debt-to-equity ratio stands at 0.67, signaling that debt is not a significant concern for the company.
◉ Top Shareholders
➖ Mr. Haijun Wang, CEO of Atour Lifestyle Holdings, holds a significant 19.2% stake.
➖ Trip.com Group Limited holds approximately 13.6% stake.
◉ Technical Aspects
➖ The weekly chart indicates that after a long period of consolidation, the stock price has formed a Rounding Bottom Pattern and is likely to break through its strong resistance zone soon.
➖ A Pole & Flag pattern has formed on the daily chart, with the stock price targeting higher levels following a successful breakout.
◉ Conclusion
Following a thorough analysis, we believe Atour presents a lucrative investment opportunity. With its appealing valuation, impressive financial track record, and strategic growth initiatives, Atour is well-positioned to capitalize on the growing tourism sector. The company's commitment to delivering exceptional customer experiences further strengthens its potential for long-term growth and value creation for shareholders.
