Market breakdown: SPY & Current TradesIn today’s update, I go over the general outlook on the indexes, focusing on SPY, Nasdaq, and Dow Jones — all still moving in bullish confluence. Even after three distribution days, there’s been no major downside move, but we are seeing drying volume, so caution is key.
I also break down some of my current trades:
A few aren't performing as expected, and that’s part of trading. We won’t win every setup, and that’s okay.
Red-marked trades have been removed from the watchlist and will be monitored closely for irrational moves. I may cut losses if needed.
Green-marked trades are still active and aligned with my criteria, so I’ll likely continue to invest in them.
Lastly, I cover a trade that recently hit my take-profit (TP), specifically KEROS, which has now also been removed from the list. ✅
Thanks for watching another one of my videos, I hope you gained value from the breakdown!
Comment below if you have questions or your own thoughts on the market.
Let’s grow together.
Investsmart

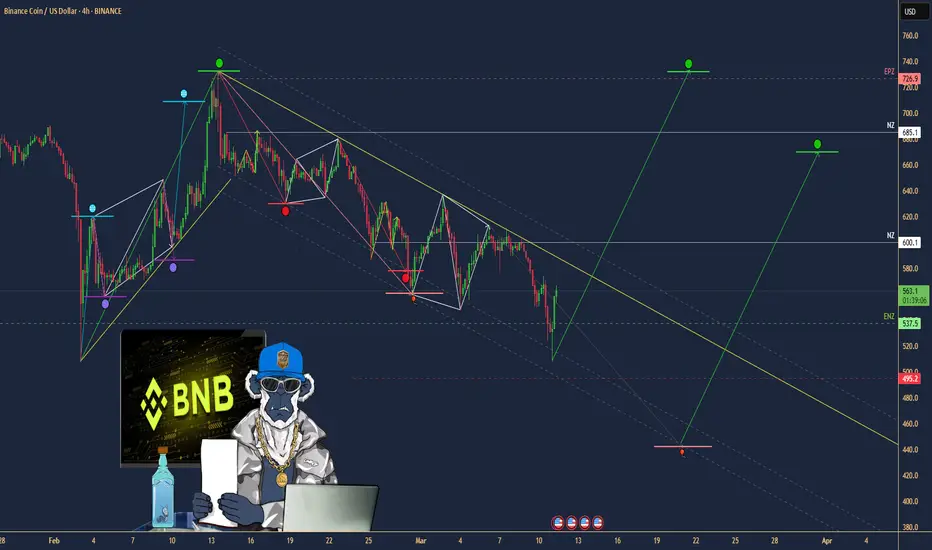
$BNB: Binance Coin – Crypto Rocket or Volatile Firecracker?(1/9)
Good Morning, TradingView! ☀️ CRYPTOCAP:BNB : Binance Coin – Crypto Rocket or Volatile Firecracker?
CRYPTOCAP:BNB ’s at $566—rocketing off recent highs or just fizzing out? With wild swings and big dreams, is it time to strap in or bail out? Let’s decode it! 🔍
(2/9) – PRICE PERFORMANCE 📊
• Current Price: $ 566 as of Mar 11, 2025 💰
• Recent Moves: Down 13.5% in an hour last night, per posts 📏
• Sector Vibe: Crypto volatility spiking, per market buzz 🌟
It’s a rollercoaster—hold tight! ⚡
(3/9) – MARKET POSITION 📈
• Market Cap: Around $82.5B (149.54M shares) 🏆
• Operations: Powers Binance ecosystem, top exchange ⏰
• Trend: Sentiment mixed, posts flag adoption 🎯
A heavyweight in crypto chaos! 🌍
(4/9) – KEY DEVELOPMENTS 🔑
• Earnings Echo: Q1 2025 beat estimates, per Mar 6 buzz 🔄
• Network Buzz: Record activity fuels optimism 🌐
• Market Reaction: Price yo-yoing, posts note caution 📋
Riding high, but bumpy! 💡
(5/9) – RISKS IN FOCUS ⚠️
• Volatility: 13.5% hourly drop spooks traders 🔍
• Competition: Rivals like Ethereum nip at heels 📉
• Macro Risks: Regulatory shadows loom ❄️
Tricky terrain ahead! 🕵️
(6/9) – SWOT: STRENGTHS 💪
• Ecosystem Might: Fuels Binance, top-tier exchange 🥇
• Adoption: Network humming, per chatter 📊
• Burns: Token scarcity drives value 🔧
A crypto beast with muscle! 🔒
(7/9) – SWOT: WEAKNESSES & OPPORTUNITIES ⚖️
• Weaknesses: Wild swings, regulatory heat 📉
• Opportunities: DeFi, GameFi growth beckon 📈
Can it blast off or stall out? 🤔
(8/9) –📢BNB at $566, wild ride—what’s your vibe? 🗳️
• Bullish: $650+ soon, adoption rules 🐂
• Neutral: Choppy but stable ⚖️
• Bearish: $500 crash, volatility bites 🐻
Holler below! 👇
(9/9) – FINAL TAKEAWAY 🎯
BNB’s $566 dance shows grit 📈, but volatility’s a wild card 🌫️. Dips? That’s our DCA sweet spot 💰. Snag low, aim high! Goldmine or gamble?
$BTC: Bitcoin – Digital Gold Rush or Crypto Rollercoaster?(1/9)
Good morning, folks! ☀️ CRYPTOCAP:BTC : Bitcoin – Digital Gold Rush or Crypto Rollercoaster?
With CRYPTOCAP:BTC at $82,352.34, is this the motherlode of digital wealth or a wild ride with no brakes? Let’s dig into the blockchain buzz! 🔍
(2/9) – PRICE PERFORMANCE 📊
• Current Price: $ 82,352.34 as of Mar 10, 2025 💰
• Recent Moves: Up 30%+ YTD, per web trends 📏
• Sector Trend: Crypto volatility reigns, X posts show mixed vibes 🌟
It’s a high-stakes game with big swings! ⚡
(3/9) – MARKET POSITION 📈
• Market Cap: $1.63T (based on 19.83M circulating supply) 🏆
• Status: King of crypto, 50%+ market dominance ⏰
• Trend: Whales scooping coins, per X chatter 🎯
Reigning supreme in the digital realm! 🌍
(4/9) – KEY DEVELOPMENTS 🔑
• Sentiment: X posts cheer GETTEX:82K support, ETF flows mixed 🔄
• Adoption: El Salvador adds BTC, strategic reserve talk grows 🌐
• Market Reaction: Price steady despite tariff fears 📋
Riding waves of hype and hope! 💡
(5/9) – RISKS IN FOCUS ⚠️
• Volatility: 5-10% daily swings not uncommon 🔍
• Regulation: Global crackdowns loom 📉
• Macro: Economic shifts could jolt crypto ❄️
High risk, high reward territory! 🕵️
(6/9) – SWOT: STRENGTHS 💪
• Dominance: 50%+ of crypto market 🥇
• Adoption: Nations, whales piling in 📊
• Scarcity: 19.83M of 21M coins mined 🔧
A heavyweight with staying power! 🔒
(7/9) – SWOT: WEAKNESSES & OPPORTUNITIES ⚖️
• Weaknesses: Wild price swings, regulatory haze 📉
• Opportunities: Institutional cash, global unrest boost 📈
Can it strike gold or stumble? 🤔
(8/9) – 📢 Bitcoin at $82,352.34—your bet? 🗳️
• Bullish: $100K+ by Q2, unstoppable 🐂
• Neutral: Sideways, risks weigh ⚖️
• Bearish: $70K crash, bubble bursts 🐻
Drop your vote below! 👇
(9/9) – FINAL TAKEAWAY 🎯
Bitcoin’s $82,352.34 marks a wild frontier 📈, with dominance shining through volatility 🌫️. Dips? That’s our DCA sweet spot 💰. Scoop low, ride high! Boom or bust?

$CY6U: CapitaLand India Trust – Bangalore Boom or Borrowing Bust(1/9)
Good afternoon, Tradingview! ☀️ SGX:CY6U : CapitaLand India Trust – Bangalore Boom or Borrowing Bust?
At 1.02 SGD, is this Indian office play a hidden gem or a debt-laden mirage? Revenue’s up, insiders are buying—let’s unpack the curry! 🔍
(2/9) – PRICE PERFORMANCE 📊
• Current Price: 1.02 SGD 💰
• Recent Moves: Modest gains in 2025, per trends 📏
• Sector Buzz: India’s office market heating up 🌟
It’s a slow simmer, but spice is brewing! 🔥
(3/9) – MARKET POSITION 📈
• Market Cap: Around 1.36B SGD (1,333.5M shares) 🏆
• Operations: Office projects, Bangalore expansion ⏰
• Trend: Revenue hit S$278M, up from S$234M 🎯
Rooted in India’s growth soil! 🌱
(4/9) – KEY DEVELOPMENTS 🔑
• Expansion: Bangalore office buy locked in 🔄
• Insider Buying: Confidence despite earnings dip ahead 🌏
• Sentiment: Cautious cheers, per market vibes 📋
Scaling up, but debt’s the side dish! 🍛
(5/9) – RISKS IN FOCUS ⚠️
• Earnings Drop: 39% decline forecast over 3 years 🔍
• Borrowing: Heavy reliance raises eyebrows 📉
• Global Noise: China stimulus, trade jitters ❄️
Spicy risks on the horizon! 🌩️
(6/9) – SWOT: STRENGTHS 💪
• Revenue Jump: S$278M from S$234M last year 🥇
• India Play: Bangalore’s office boom 📊
• Insider Faith: Buying signals grit 🔧
A curry with some kick! 🍲
(7/9) – SWOT: WEAKNESSES & OPPORTUNITIES ⚖️
• Weaknesses: Debt load, earnings slide ahead 📉
• Opportunities: India’s resilience, market gaps 📈
Can it spice up profits or just heat debt? 🤔
(8/9) – 📢At 1.02 SGD, revenue up, insiders in—your vibe? 🗳️
• Bullish: 1.20 SGD soon, India shines 🐂
• Neutral: Flat, risks weigh ⚖️
• Bearish: 0.90 SGD, debt bites 🐻
Drop your take below! 👇
(9/9) – FINAL TAKEAWAY 🎯
CapitaLand’s Bangalore bet and S$278M revenue pop tasty 📈, but debt and a 39% earnings dip loom 🌫️. Volatility’s our mate—dips are DCA spice 💰. Scoop low, rise steady! Gold or ghee?

$COFORGE: Coforge Ltd. – AI Travel Tech Titan or Overhyped?(1/9)
Good afternoon, everyone! 🌞 NSE:COFORGE : Coforge Ltd. – AI Travel Tech Titan or Overhyped Split?
Coforge snags a $1.56B Sabre deal and a 1:5 stock split—shares spike 10%! Is this IT gem ready to soar or just riding AI hype? Let’s unpack the buzz! 🔍
(2/9) – PRICE PERFORMANCE 📊
• Recent Surge: Shares up 10% post-Sabre deal news 💰
• Stock Split: 1:5 split announced, boosting accessibility 📏
• Sector Trend: IT outsourcing on fire, per X posts 🌟
It’s a hot streak, fueled by big moves! ⚡
(3/9) – MARKET POSITION 📈
• Market Cap: Not specified, but shares soaring 🏆
• Operations: Global IT player, travel tech focus ⏰
• Trend: $1.56B deal lifts travel sector outlook 🎯
Firm, staking its claim in AI-driven IT! 🌐
(4/9) – KEY DEVELOPMENTS 🔑
• Sabre Deal: $1.56B, 13-year AI partnership 🔄
• Revenue Boost: Travel sector growth projected, per analysts 🌍
• Market Reaction: 10% jump, analyst upgrades flying 📋
Scaling up, with AI as the jet fuel! 💡
(5/9) – RISKS IN FOCUS ⚡
• Execution Risk: Big deal, big delivery pressure 🔍
• Hype Factor: AI buzz could overinflate expectations 📉
• Competition: IT giants crowding the space ❄️
High stakes, but risks are real! ⚠️
(6/9) – SWOT: STRENGTHS 💪
• Mega Deal: $1.56B Sabre contract, 13 years locked 🥇
• Travel Tech: Niche expertise shining 📊
• Split Appeal: 1:5 makes it investor-friendly 🔧
Loaded with ammo for growth! 💼
(7/9) – SWOT: WEAKNESSES & OPPORTUNITIES ⚖️
• Weaknesses: Execution hiccups could trip it up 📉
• Opportunities: AI adoption, travel sector boom 📈
Can it deliver or just dazzle? 🤔
(8/9) – 📢Coforge shares up 10%, $1.56B deal in pocket—your take? 🗳️
• Bullish: Skyrocketing on AI wings 🐂
• Neutral: Solid, but watch execution ⚖️
• Bearish: Hype outpaces reality 🐻
Drop your vote below! 👇
(9/9) – FINAL TAKEAWAY 🎯
Coforge’s $1.56B Sabre deal sparks a 10% surge 📈, with a 1:5 split sweetening the pot 🌱. Volatility’s our playground—dips are DCA gems 💰. Snag ‘em cheap, ride the wave! Goldmine or glitter?

"Inflation: The Silent Wealth Eroder 🤐💸"
In the world of economics, there's a silent assassin at work, slowly but persistently eroding the value of your hard-earned money. Inflation, often overlooked but silently powerful, can be a wealth killer if left unattended. This in-depth exploration uncovers why inflation is a financial menace, examining its causes, consequences, and strategies to shield your wealth.
The Silent Thief
The Dollar Dilemma
Retirement Realities
Causes of Inflation
1. Demand-Pull Inflation 📈
When demand for goods and services surpasses their supply, prices go up. This can happen in booming economies when everyone wants a piece of the pie.
2. Cost-Push Inflation 📦🏭
Rising production costs, like increased wages or resource prices, can lead to higher prices for consumers. Businesses pass these costs on to buyers, contributing to inflation.
Consequences of Inaction
Stagnant Savings
Protecting Your Wealth
There are strategies to counter the silent thief:
1. Invest Wisely 📊💡
Consider investments that have the potential to outpace inflation, like stocks, real estate, or commodities.
2. Diversify Your Portfolio 🌐📈
Spreading your investments across various assets can reduce the impact of inflation on your overall portfolio.
Inflation may be silent, but its impact on your wealth is loud and clear. Understanding the causes, consequences, and protective measures can help you guard your financial future against this silent yet formidable adversary. Don't let your money silently slip away—act now to preserve your wealth. 💸🤐
Please, support my work with like and comment!
Love you, my dear followers!👩💻🌸

Bullish Potential on $PYPL: Falling Wedge Pattern Greetings, Traders! Today, I'm excited to share an intriguing technical analysis discovery on the stock of PayPal Holdings Inc. ( NASDAQ:PYPL ). A falling wedge pattern has been identified, indicating the potential for a bullish reversal in the near future. Let's dive into the details!
📈 Ticker: NASDAQ:PYPL
📅 Timeframe: Daily Chart
📊 Pattern: Falling Wedge
📉 Understanding the Falling Wedge Pattern:
A falling wedge is a bullish chart pattern characterized by converging trendlines that slope downward. Typically formed during a downtrend, it suggests diminishing selling pressure and the potential for a reversal. This pattern indicates the possibility of an upward price movement.
🔍 Identifying the Falling Wedge on NASDAQ:PYPL :
Upon analyzing the daily chart of NASDAQ:PYPL , the following observations come to light:
1️⃣ Recent downtrend: NASDAQ:PYPL has experienced a decline in price over the past weeks.
2️⃣ Converging trendlines: The upper trendline connects the lower highs, while the lower trendline connects the lower lows.
3️⃣ Decreasing trading volume: As the falling wedge pattern forms, the trading volume has been declining, indicating a potential reduction in selling pressure.
📈 Price Targets and Trading Strategy:
If the falling wedge pattern on NASDAQ:PYPL plays out as anticipated, a potential bullish breakout above the upper trendline may occur, signaling a reversal and potential price appreciation. Consider the following price targets:
1️⃣ Target 1: Resistance level near $320.00
2️⃣ Target 2: Psychological resistance near $340.00
🛡️ Risk Management:
Implement the following risk management techniques to protect your capital and manage risk effectively:
1️⃣ Set a stop-loss order below the lower trendline to safeguard against unexpected price reversals.
2️⃣ Adjust position size based on your risk tolerance and overall portfolio management strategy.
🔔 Conclusion:
PayPal Holdings Inc. ( NASDAQ:PYPL ) is exhibiting a falling wedge pattern, suggesting the potential for a bullish reversal in the near future. However, please remember that technical analysis has limitations, and market conditions can change. Incorporate additional analysis and fundamental factors before making any trading decisions.
Disclaimer: This post is for informational purposes only and should not be considered as financial advice. Always conduct your own research and consult with a qualified financial professional before making any investment decisions.
Happy Trading! 📈💰
#TradingViewAnalysis #TechnicalAnalysis #FallingWedgePattern #BullishReversal #PYPLStock #StockMarketAnalysis #ChartPatterns #TradingSignals #InvestSmart #FinancialMarkets #MarketAnalysis

Falling Wedge Pattern on $BLNK: Potential Bullish Reversal Greetings, Traders! Today, I'm thrilled to share an exciting technical analysis finding on the stock of Blink Charging Co. ( NASDAQ:BLNK ). A falling wedge pattern has been identified, suggesting the potential for a bullish reversal in the near future. Let's dive into the details!
📈 Ticker: NASDAQ:BLNK
📅 Timeframe: Daily Chart
📊 Pattern: Falling Wedge
📉 Understanding the Falling Wedge Pattern:
A falling wedge is a bullish chart pattern characterized by converging trendlines that slope downward. Typically formed during a downtrend, it indicates diminishing selling pressure and the potential for a reversal. This pattern suggests the possibility of an upward price movement.
🔍 Identifying the Falling Wedge on NASDAQ:BLNK :
Upon analyzing the daily chart of NASDAQ:BLNK , the following observations come to light:
1️⃣ Recent downtrend: NASDAQ:BLNK has experienced a decline in price over the past weeks.
2️⃣ Converging trendlines: The upper trendline connects the lower highs, while the lower trendline connects the lower lows.
3️⃣ Decreasing trading volume: As the falling wedge pattern forms, the trading volume has been declining, indicating a potential reduction in selling pressure.
📈 Price Targets and Trading Strategy:
If the falling wedge pattern on NASDAQ:BLNK plays out as anticipated, a potential bullish breakout above the upper trendline may occur, leading to a reversal and potential price appreciation. Consider the following price targets:
1️⃣ Target 1: Resistance level near $40.00
2️⃣ Target 2: Psychological resistance near $45.00
🛡️ Risk Management:
Effective risk management is crucial for successful trading. Implement the following risk management techniques:
1️⃣ Set a stop-loss order below the lower trendline to protect against unexpected price movements.
2️⃣ Adjust position size based on your risk tolerance and overall portfolio management strategy.
🔔 Conclusion:
Keep a close watch on Blink Charging Co. ( NASDAQ:BLNK ) as it develops this falling wedge pattern. The pattern suggests the potential for a bullish reversal in the near future. However, please note that technical analysis is not infallible, and market conditions can change rapidly. It's advisable to incorporate additional analysis and fundamental factors before making any trading decisions.
Disclaimer: This post is for informational purposes only and should not be considered as financial advice. Always conduct your own research and consult with a qualified financial professional before making any investment decisions.
Happy Trading! 📈💰
#tradingview #technicalanalysis #fallingwedge #bullishreversal #blnk #stockanalysis #chartpatterns #tradingstrategies #investing #finance #marketanalysis

VBI Vaccines Inc CDA (IDEA)Whats going on yall...
So, taken a look at VBIV, Im pretty sure you heard of Covid-19???
OK, well, here's 1 of the hypes that could kick in probably
#TradeSafe
#InvestSmart NASDAQ:VBIV

$NIO prt 2 or 3, idk???HOLY!!!!!
What a day. I bought mad early and I had to wait it out... See why!
