IOST/USDT 2HOUR UPDATEWelcome to this quick IOST/USDT analysis.
I have tried my best to bring the best possible outcome me in this chart.
Reason of trade :- IOST/USDT is triangle pattern create and BUY the green zone
Entry:- buy green zone
Traget:- 30% to 40%
Stop loss:- green box down side candle close
Remember:-This is not a piece of financial advice. All investment made by me is under my own risk and I am held responsible for my own profit and losses. So, do your own research before investing in this trade.
Happy trading.
Sorry for my English it is not my native languages.
Do hit the like button if you like it and share your charts in the comments section.
Thank you...
Iostethereum

IOST/USDT 4HOUR UPDATEWelcome to this quick
IOST/usdt analysis.
I have tried my best to bring the best possible outcome me in this chart.
Reason of trade :-iost/usdt is triangle pattern conform and triangle retest and buy the dip and long term hold
Entry:- cmp And buy the dip in green zone
Traget:- 150% to 200%
Stoploss:- $0.04448
Remember:-This is not a piece of financial advice. All investment made by me is under my own risk and I am held responsible for my own profit and losses. So, do your own research before investing in this trade.
Happy trading.
Sorry for my English it is not my native languages.
Do hit the like button if you like it and share your charts in the comments section.
Thank you...

IOST/USDT 4HOUR UPDATEWelcome to this quick
IOST/USDT analysis.
I have tried my best to bring the best possible outcome me in this chart.
Reason of trade :- IOST/USDT analysis is Ascending triangle ready and green zone fast by the dip.
And IOST/USDT is fundamentals is strong .
Entry:- cmp And green zone
Traget:- $0.051,
$0.055,
$0.059
$0.063
Stoploss:- $0.44
Remember:-This is not a piece of financial advice. All investment made by me is under my own risk and I am held responsible for my own profit and losses. So, do your own research before investing in this trade.
Happy trading.
Sorry for my English it is not my native languages.
Do hit the like button if you like it and share your charts in the comments section.
Thank you...

iostusdt sell sterategy Highest price 0.09171 and 0.09071
sterategy 1 :
Those who bought at the price of 0.01681 will save 50% of the capital In the price 0.09171
And in case of resistance failure and re-formation of the pullback
sterategy 2 :
Save the total capital in the price range 0.09171 and 0.09071 and wait for the resistance to fail
Take the sensitive points of resistance and support seriously


Wyckoff Distribution IOSTETHWyckoff Distribution for IOSTETH on the Daily Timeframe
Do you disagree? Feel free to share your opinion in the comments down below!
Let's profit from this Market together!
Mandan

IOST/USDT (Pullback Before Another Leg up?)IOST/USDT
-after the Cross Ultimate indicator flashes Long signal priority
-the price went up over 20% and manages to break local resistances
-currently, the IOST is testing previous resistance > new support?
-we have a new minor resistance at 5180
-if we can break/close above it
-that's a signal of Long entry
-next resistance above is at 5900-8400

IOST/ETH Buying Range Comes1D chart looks Good
Descending Chart Pattern
Buying range 0.00001600 to 0.00001900
Sell when you Satisfy
Good luck comment below what you think and share your ideas Thanks

There is a trading opportunity to buy in IOSTETHTechnical analysis:
. IOST/ETHEREUM is in a range bound and the beginning of uptrend is expected.
. The price is below the 21-Day WEMA which acts as a dynamic resistance.
. The RSI is at 41.
Trading suggestion:
. There is a possibility of temporary retracement to suggested support zone (0.00003175 to 0.0000238). if so, traders can set orders based on Price Action and expect to reach short-term targets.
Beginning of entry zone (0.00003175)
Ending of entry zone (0.0000238)
Entry signal:
Signal to enter the market occurs when the price comes to " Buy zone " then forms one of the reversal patterns, whether " Bullish Engulfing ", " Hammer " or " Valley " in other words, NO entry signal when the price comes to the zone BUT after any of reversal patterns is formed in the zone. To learn more about " Entry signal " and the special version of our " Price Action " strategy FOLLOW our lessons :
Take Profits:
TP1= @ 0.00004280
TP2= @ 0.00005450
TP3= @ 0.00006400
TP4= @ 0.00007350
TP5= @ 0.00008700
TP6= @ 0.00010420
TP7= Free

There is a trading opportunity to buy in IOSTETHTechnical analysis:
. IOST/ETHEREUM is in a range bound and the beginning of uptrend is expected.
.The price is above the 21-Day WEMA which acts as a dynamic support.
. The RSI is at 57.
Trading suggestion:
. There is a possibility of temporary retracement to suggested support zone (0.00003175 to 0.00002380). if so, traders can set orders based on Price Action and expect to reach short-term targets.
Beginning of entry zone (0.00003175)
Ending of entry zone (0.00002380)
Entry signal:
Signal to enter the market occurs when the price comes to " Buy zone " then forms one of the reversal patterns, whether " Bullish Engulfing ", " Hammer " or " Valley " in other words, NO entry signal when the price comes to the zone BUT after any of reversal patterns is formed in the zone. To learn more about " Entry signal " and the special version of our " Price Action " strategy FOLLOW our lessons :
Take Profits:
TP1= @ 0.00004280
TP2= @ 0.00005450
TP3= @ 0.00006400
TP4= @ 0.00007350
TP5= @ 0.00008700
TP6= @ 0.00010420
TP7= Free

There is a trading opportunity to buy in IOSTETHTechnical analysis:
. IOST/ETHEREUM is in a range bound and the beginning of uptrend is expected.
. The price is below the 21-Day WEMA which acts as a dynamic resistance.
. The RSI is at 44.
Trading suggestion:
. There is a possibility of temporary retracement to suggested support zone (0.00003800 to 0.00003200). if so, traders can set orders based on Price Action and expect to reach short-term targets.
Beginning of entry zone (0.00003800)
Ending of entry zone (0.00003200)
Entry signal:
Signal to enter the market occurs when the price comes to " Buy zone " then forms one of the reversal patterns, whether " Bullish Engulfing ", " Hammer " or " Valley " in other words, NO entry signal when the price comes to the zone BUT after any of reversal patterns is formed in the zone. To learn more about " Entry signal " and the special version of our " Price Action " strategy FOLLOW our lessons :
Take Profits:
TP1= @ 0.00004300
TP2= @ 0.00004900
TP3= @ 0.00005950
TP4= @ 0.00006800
TP5= @ 0.00007650
TP6= @ 0.00008870
TP7= @ 0.00010420
TP8= Free

There is a trading opportunity to buy in IOSTETHTechnical analysis:
. IOST/ETHEREUM is in a range bound and the beginning of uptrend is expected.
. The price is below the 21-Day WEMA which acts as a dynamic resistance.
. The RSI is at 38.
Trading suggestion:
. There is a possibility of temporary retracement to suggested support zone (0.00003930 to 0.00003600). if so, traders can set orders based on Price Action and expect to reach short-term targets.
Beginning of entry zone (0.00003930)
Ending of entry zone (0.00003600)
Entry signal:
Signal to enter the market occurs when the price comes to " Buy zone " then forms one of the reversal patterns, whether " Bullish Engulfing ", " Hammer " or " Valley " in other words,
NO entry signal when the price comes to the zone BUT after any of the reversal patterns is formed in the zone.
To learn more about " Entry signal " and the special version of our " Price Action " strategy FOLLOW our lessons:
Take Profits:
TP1= @ 0.00004660
TP2= @ 0.00005140
TP3= @ 0.00005360
TP4= @ 0.00006150
TP5= @ 0.00006970
TP6= @ 0.00007780
TP7= @ 0.00008940
TP8= @ 0.00010420
TP9= Free

A trading opportunity to buy in IOSTETHTechnical analysis:
. IOST/ETHEREUM is in a range bound and the beginning of uptrend is expected.
. The price is above the 21-Day WEMA which acts as a dynamic support.
. The RSI is at 54.
. While the price downtrend in the daily chart is not broken, bearish wave in price would continue.
Trading suggestion:
. There is a possibility of temporary retracement to suggested support zone (0.00003930 to 0.00003600). if so, traders can set orders based on Price Action and expect to reach short-term targets.
Beginning of entry zone (0.00003930)
Ending of entry zone (0.00003600)
Entry signal:
Signal to enter the market occurs when the price comes to " Buy zone " then forms one of the reversal patterns, whether " Bullish Engulfing ", " Hammer " or " Valley " in other words,
NO entry signal when the price comes to the zone BUT after any of the reversal patterns is formed in the zone.
To learn more about " Entry signal " and the special version of our " Price Action " strategy FOLLOW our lessons:
Take Profits:
TP1= @ 0.00004790
TP2= @ 0.00005140
TP3= @ 0.00005360
TP4= @ 0.00006150
TP5= @ 0.00006970
TP6= @ 0.00007780
TP7= @ 0.00008940
TP8= @ 0.00010420
TP9= Free

A trading opportunity to buy in IOSTETHTechnical analysis:
. IOSTOKEN/ETHEREUM is in a range bound and the beginning of uptrend is expected.
. The price is below the 21-Day WEMA which acts as a dynamic resistance.
. The RSI is at 44.
Trading suggestion:
. There is a possibility of temporary retracement to suggested support zone (0.00004200 to 0.00003800). if so, traders can set orders based on Price Action and expect to reach short-term targets.
Beginning of entry zone (0.00004200)
Ending of entry zone (0.00003800)
Entry signal:
Signal to enter the market occurs when the price comes to " Buy zone " then forms one of the reversal patterns, whether " Bullish Engulfing ", " Hammer " or " Valley " in other words,
NO entry signal when the price comes to the zone BUT after any of the reversal patterns is formed in the zone.
To learn more about " Entry signal " and the special version of our " Price Action " strategy FOLLOW our lessons:
Take Profits:
TP1= @ 0.00004790
TP2= @ 0.00005360
TP3= @ 0.00006000
TP4= @ 0.00006230
TP5= @ 0.00007110
TP6= @ 0.00007890
TP7= @ 0.00009000
TP8= @ 0.00010420
TP9= Free

There is a possibility of the beginning an uptrend in IOSTETHTechnical analysis:
. IOSTOKEN/ETHEREUM is in a range bound and the beginning of uptrend is expected.
. The price is above the 21-Day WEMA which acts as a dynamic above.
. The RSI is at 52.
. While the price downtrend in the Daily chart is not broken, bearish wave in price would continue .
Trading suggestion:
. There is a possibility of temporary retracement to suggested support zone (0.000047 to 0.000042). if so, traders can set orders based on Price Action and expect to reach short-term targets.
Beginning of entry zone (0.000047)
Ending of entry zone (0.000042)
Entry signal:
Signal to enter the market occurs when the price comes to "Buy zone" then forms one of the reversal patterns, whether "Bullish Engulfing" , "Hammer" or "Valley" in other words,
NO entry signal when the price comes to the zone BUT after any of the reversal patterns is formed in the zone.
To learn more about "Entry signal" and the special version of our "Price Action" strategy FOLLOW our lessons:
Take Profits:
TP1= @ 0.000054
TP2= @ 0.000060
TP3= @ 0.000066
TP4= @ 0.000071
TP5= @ 0.000079
TP6= @ 0.000096
TP7= Free

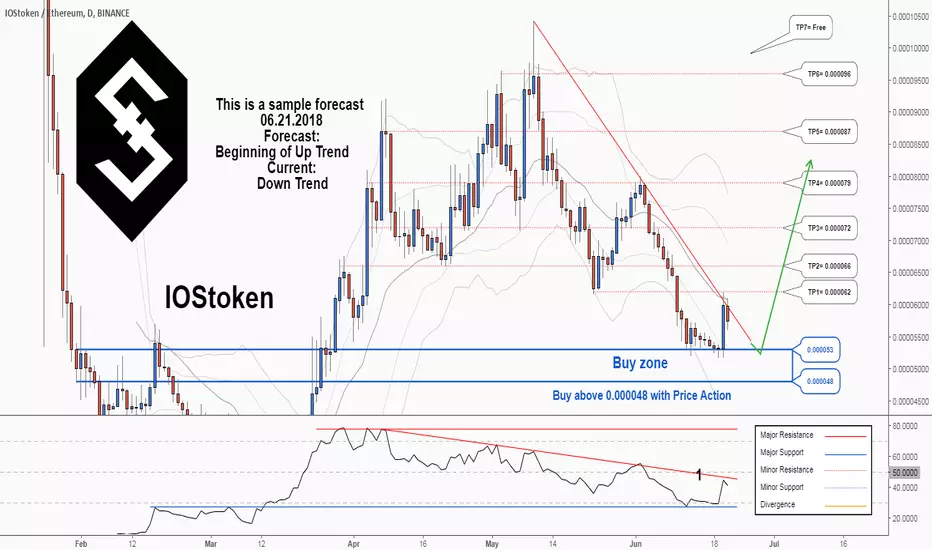
There is a trading opportunity to buy in IOSTETHTechnical analysis:
. IOSTOKEN/ETHEREUM is in a downtrend and beginning of uptrend is expected.
. The price is below the 21-Day WEMA which acts as a dynamic resistance.
. The RSI is at 40.
. While the RSI downtrend #1 and the price downtrend in daily chart is not broken, bearish wave in price would continue.
Trading suggestion:
. The price is in a downtrend and we forecast the uptrend would begin.
. There is a possibility of temporary retracement to suggested support zone (0.000053 to 0.000048). if so, traders can set orders based on Price Action and expect to reach short-term targets.
Beginning of entry zone (0.000053)
Ending of entry zone (0.000048)
Entry signal:
Signal to enter the market occurs when the price comes to "Buy zone" then forms one of the reversal patterns, whether "Bullish Engulfing" , "Hammer" or "Valley" in other words,
NO entry signal when the price comes to the zone BUT after any of reversal patterns is formed in the zone.
To learn more about "Entry signal" and the special version of our "Price Action" strategy FOLLOW our lessons:
Take Profits:
TP1= @ 0.000062
TP2= @ 0.000066
TP3= @ 0.000072
TP4= @ 0.000079
TP5= @ 0.000087
TP6= @ 0.000096
TP7= Free
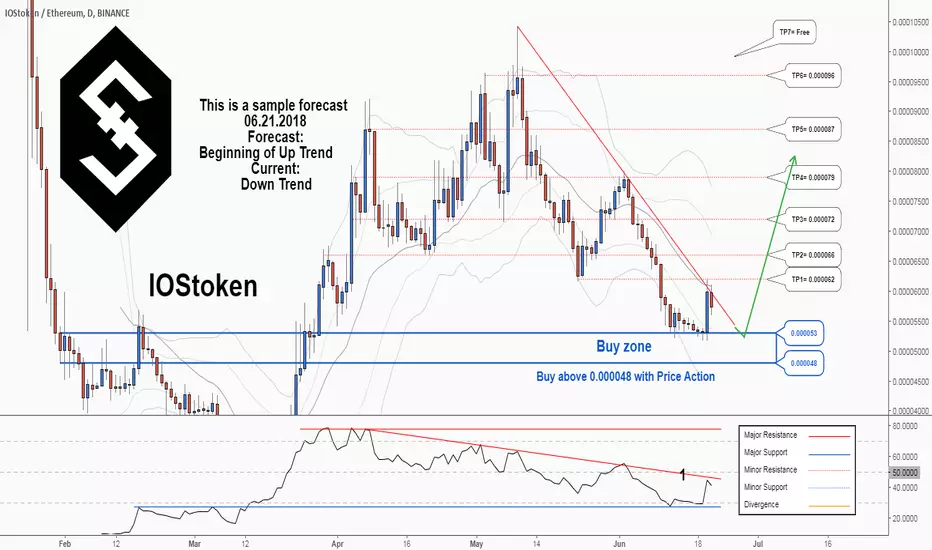