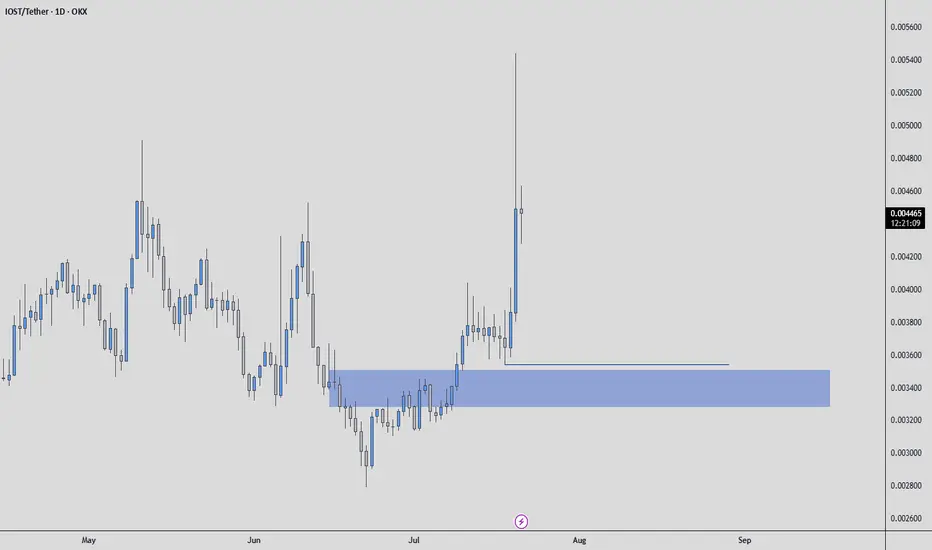
IOSTUSDT - Mid Term AnalysisThe coin is good, but everything is bad unless you buy it at the right price.
I like IOST, but I won’t touch it unless it comes to a price that makes sense for me. If it drops to my levels, I will look for:
✅ Footprint absorption
✅ CDV support
✅ Structure reclaim for confirmation
If these align, I will consider a long with clear risk management. If not, I will wait.
No rush, no fear of missing out. The right price or no trade.
📌I keep my charts clean and simple because I believe clarity leads to better decisions.
📌My approach is built on years of experience and a solid track record. I don’t claim to know it all but I’m confident in my ability to spot high-probability setups.
📌If you would like to learn how to use the heatmap, cumulative volume delta and volume footprint techniques that I use below to determine very accurate demand regions, you can send me a private message. I help anyone who wants it completely free of charge.
🔑I have a long list of my proven technique below:
🎯 ZENUSDT.P: Patience & Profitability | %230 Reaction from the Sniper Entry
🐶 DOGEUSDT.P: Next Move
🎨 RENDERUSDT.P: Opportunity of the Month
💎 ETHUSDT.P: Where to Retrace
🟢 BNBUSDT.P: Potential Surge
📊 BTC Dominance: Reaction Zone
🌊 WAVESUSDT.P: Demand Zone Potential
🟣 UNIUSDT.P: Long-Term Trade
🔵 XRPUSDT.P: Entry Zones
🔗 LINKUSDT.P: Follow The River
📈 BTCUSDT.P: Two Key Demand Zones
🟩 POLUSDT: Bullish Momentum
🌟 PENDLEUSDT.P: Where Opportunity Meets Precision
🔥 BTCUSDT.P: Liquidation of Highly Leveraged Longs
🌊 SOLUSDT.P: SOL's Dip - Your Opportunity
🐸 1000PEPEUSDT.P: Prime Bounce Zone Unlocked
🚀 ETHUSDT.P: Set to Explode - Don't Miss This Game Changer
🤖 IQUSDT: Smart Plan
⚡️ PONDUSDT: A Trade Not Taken Is Better Than a Losing One
💼 STMXUSDT: 2 Buying Areas
🐢 TURBOUSDT: Buy Zones and Buyer Presence
🌍 ICPUSDT.P: Massive Upside Potential | Check the Trade Update For Seeing Results
🟠 IDEXUSDT: Spot Buy Area | %26 Profit if You Trade with MSB
📌 USUALUSDT: Buyers Are Active + %70 Profit in Total
🌟 FORTHUSDT: Sniper Entry +%26 Reaction
🐳 QKCUSDT: Sniper Entry +%57 Reaction
📊 BTC.D: Retest of Key Area Highly Likely
📊 XNOUSDT %80 Reaction with a Simple Blue Box!
📊 BELUSDT Amazing %120 Reaction!
📊 Simple Red Box, Extraordinary Results
📊 TIAUSDT | Still No Buyers—Maintaining a Bearish Outlook
📊 OGNUSDT | One of Today’s Highest Volume Gainers – +32.44%
📊 TRXUSDT - I Do My Thing Again
📊 FLOKIUSDT - +%100 From Blue Box!
📊 SFP/USDT - Perfect Entry %80 Profit!
📊 AAVEUSDT - WE DID IT AGAIN!
I stopped adding to the list because it's kinda tiring to add 5-10 charts in every move but you can check my profile and see that it goes on..
IOSTUSDT
IOSTUSDT 1W AnalysisIOST ~ 1W Analysis
#IOST Buy back gradually from here with a short term target of at least 20%+ from this support.
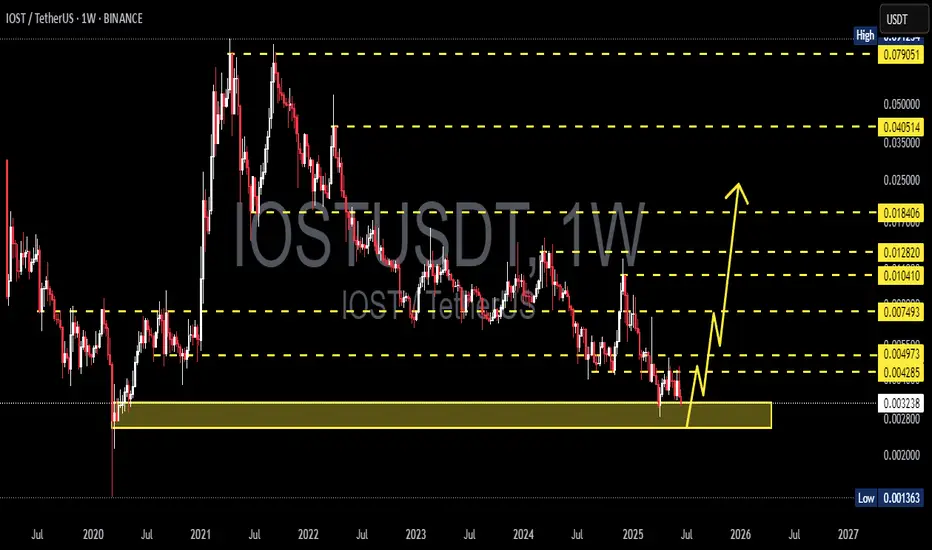
IOST: New All-Time High May 2026? Interesting... Must Read!The lowest price ever for IOST happened March 2020. The second lowest happened April 2025. We shouldn't expect for IOSTUSDT to go as low as March 2020, we can easily say/predict/assume that the bottom is already in.
Let me show you something really interesting.
IOST entered a bull market after the March 2020 bottom, supported by easy money. The bull market from bottom to top lasted 399 days.
If we do a time-fractal and project 399 days into the future counting from the April 2025 low, this would give us a date of May 2026. Interesting. We are set to have easy money this year as well, same conditions as in 2021.
I've been saying late 2025 or early 2026 for the full bull market to unravel, but this is an interesting date. I don't know how long the bull market will last, I don't know how far up prices will go. There is only one thing I know 1,000% certain, safe, Crypto is going up.
IOST already hit bottom and is printing a higher low. This higher low marks the start of the next leg-up, the continuation of the bullish impulse. This impulse should last a long time, long-term growth.
It would be awesome if we have a bull market until mid-2026, but be prepared for anything to happen. The most important action right now is to accumulate, buy while prices are low and hold. Hold strong. You will be happy with the results.
It will take a while but it is something certain. The bull market can end later this year or in 2026, that's ok. As long as everything grows, we can produce financial success. Financial freedom. Financial independence. Financial abundance. It is all yours to take.
Namaste.

IOSTUSDT 1WIOST ~ 1W Analysis
#IOST Buy gradually from here with a short -term target of at least 20%+. This is a very good support for now.

IOSTUSDT 1WIOST ~ 1W Analysis
#IOST Buy back from here with a short -term target of at least 20%+ from here.

IOST price analysis⁉️ Who knows why the price of $IOST shot up so much yesterday?
🟢 The project is old - from 2018.
🟡 Capitalization is only $100 million.
🔴 It has been in the downtrend for more than 3 years and the price of OKX:IOSTUSDT has not really grown.
What do you think, is it worth buying? 150-160% of the price movement is even within the down-trend.

IOST Breakout Coming? Avoid FOMO & Trade Smart!IOST/USDT 1W chart shows a strong bounce from the support zone, indicating potential bullish momentum. The price is currently approaching the falling resistance trendline, which has acted as a major barrier in previous attempts to rally. The Stoch RSI has formed a bullish crossover, signaling a possible trend reversal.
However, a breakout above the descending resistance trendline is required to confirm further upside. If you missed the entry at the bottom, avoid emotional FOMO—wait for a confirmed breakout to capture the next leg up.

IOSTUSDT 1WIOST ~ 1W Analysis
#IOST So far it still maintains this block of support. Buy from here with a minimum target of 20%++.

IOST - 4h - Accumulation RangeIOST - 4h - Accumulation Range
REMEMBER that a lot of investors sell stocks or crypto for fiscal conditions in 2024 to close the year.
For that, we have low buy liquidity , and even with that pressure on the price , IOST is trying to remaning in the same range as 1 week ago, so a breakout can restart a new HH , so patience.
Im bullish on it if the 0.0074usd resistance its broken and became a support.

iostusdtIf the price rises above the Kumo cloud, it has a very significant target up to the yellow zone, where the price is 0.008.

IOSTUSDT 1WIOST ~ 1W
#IOST If you still have Conviction on the coin,. Buy gradually within this support block,. with a short term target of at least 20%++

IOSTIOST describes itself as an “ultra-fast,” fully fledged and decentralized blockchain network and ecosystem with its own nodes, wallets and based on the “next-generation” consensus protocol dubbed “proof-of-believability.” Anyway, IOST were in a downtrend from the beginning, then IOST broke the downtrend line, made a pullback on it, and went up. It seems this behavioral pattern is about to repeat, and another upward wave might unfold. Let's see what happens.

Awaiting Confirmation for Next Move📊 Currently, IOST is testing a significant daily resistance level at $0.005915. This zone could play a crucial role in determining the next price direction.
Potential Scenarios:
🟢 Bullish Breakout: If IOST successfully breaks above the $0.005915 level with strong momentum, it could trigger a bullish continuation. In this case, the next potential targets would be around $0.006460, as indicated by the upper resistance level.
🔴 Bearish Rejection and Pullback: If the resistance at $0.005915 holds, we might see a price rejection, pushing IOST back towards the support area around $0.005114. This zone could act as a potential entry point for those looking to enter long positions on a pullback, especially if IOST shows signs of accumulation or support in this area.
Note: This analysis is for informational purposes only and should not be considered a buy or sell signal.

IOST ANALYSIS🔮 #IOST Analysis - Breakout 🚀🚀
💲💲 There is a breakout of Falling Wedge Pattern in #IOST. It's a daily time frame breakout and it's a retesting time. After the retest we would see a perfect bullish movement📈
💸Current Price -- $0.00545
📈Target Price -- $0.00965
⁉️ What to do?
- We have marked crucial levels in the chart . We can trade according to the chart and make some profits. 🚀💸
#IOST #Cryptocurrency #Breakout #DYOR

IOST RECLAIMS LEVEL#IOST has made a higher low off a very clear bottoming formation after breaking out of a Descending Channel(BullFlag)!
I expect to see IOST to make its way towards the Golden Pocket @ $0.035 and possibly much higher!

IOST Bottom Fractals IOST PA exhibiting an interesting pattern when bottom. Chart speaks and so we listen!
The bottom pattern is slightly smaller or less volatile than the last, which I believe is a sign of maturity (less manipulation).
It's true that 5 is slightly more pronounced in the previous bottom but again most likely due to manipulation. So we can disregard the long wicks. Other than that it's an exact replica of the PA.
Cheers

IOST/USDT Ready to Rally from a Perfect Position? IOST Analysis 💎Attention Paradisers! #IOSTUSDT is making significant strides, currently challenging a crucial resistance within an ascending channel. Maintaining this trajectory could propel a bullish breakout, aiming for an initial resistance at $0.1439, before setting sights on even loftier resistances.
💎If #IOST begins to lose steam at this resistance, anticipate a bullish recovery from substantial support at $0.0103—a zone celebrated for its liquidity, marked by previous intense upward movements and striking green candles for $IOST.
💎A breach below this critical support may indicate a pivot toward a bearish trend, characterized by a surge in selling activities. Staying vigilant and ready to adapt is crucial as we traverse the dynamic #IOST market landscape.

IOSTUSDT 5DIOST ~ 5D 📈
#IOST Make purchases gradually, After breaking through this resistance line, with a Target of at least 20%++ from here. 🔼

#IOST/USDT#IOST
We have a down channel that has just been broken very nicely
We have a strong rising trend on RSI as well
We have a higher stability than the Moving Average 100 and we have an upward discount
The pattern is canceled if the day is closed with a strong bearish candle below the green support area
Entry price is 0.00943
The first target is 0.00970
The second goal is 0.01015
The third goal is 0.01071


iost preparing for solid recovery seems like preparing for solid recovery in coming weeks
consolidating in multi year symmetrical triangle and approaching towards upper descending trend line expecting breakout soon and successful breakout can lead 2 3x bullish wave midterm keep eyes on iost for confirmed breakout

IOST on a clear path to the upsideIOST is gearing for a bull move next. MACD is turning green. RSI is turning bullish. The stars are lining up.
Will there be wick down the bottom of the wedge to shake things out? If so I'll be sure to buy more.
NFA

IOST is leaving its bear market behindIOST is about to pump. I think it will hit $0.50 next year. Cheers!
This is NOT financial advice.
