IOSTUSDT 1W AnalysisIOST ~ 1W Analysis
#IOST Buy back gradually from here with a short term target of at least 20%+ from this support.
Iostusdtidea
IOSTUSDT 1WIOST ~ 1W Analysis
#IOST Buy gradually from here with a short -term target of at least 20%+. This is a very good support for now.

IOSTUSDT 1WIOST ~ 1W Analysis
#IOST Buy back from here with a short -term target of at least 20%+ from here.

IOSTUSDT 1WIOST ~ 1W Analysis
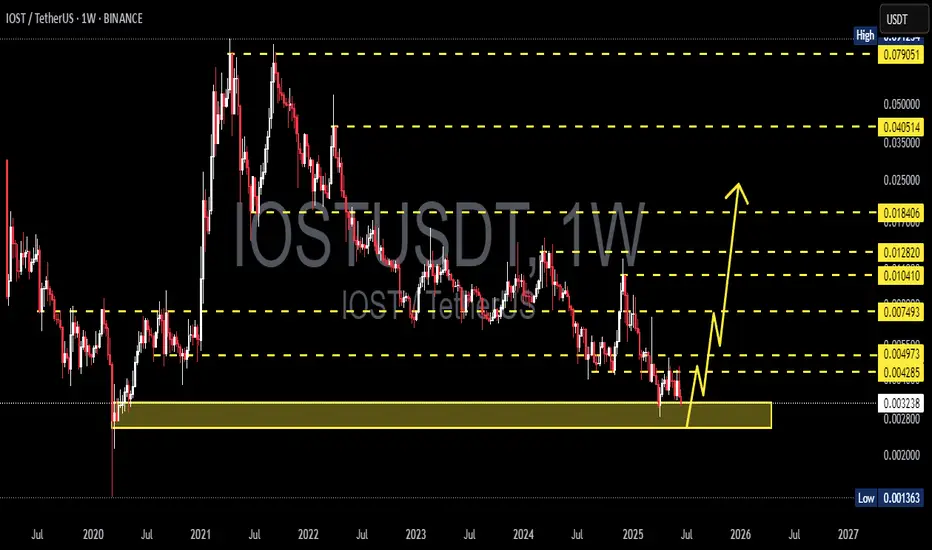
#IOST So far it still maintains this block of support. Buy from here with a minimum target of 20%++.

IOSTUSDT 1WIOST ~ 1W
#IOST If you still have Conviction on the coin,. Buy gradually within this support block,. with a short term target of at least 20%++

1INCH/USDT TRADE SETUP Hi guys, This is CryptoMojo, One of the most active trading view authors and fastest-growing communities.
Do consider following me for the latest updates and Long /Short calls on almost every exchange.
I post short mid and long-term trade setups too.
Let’s get to the chart!
I have tried my best to bring the best possible outcome in this chart, Do not consider it as financial advice.
Long 1inch/USDT
Accumulate in this range:- CMP and add more up to $0.706
Target:- 60%
SL-: $0.676
DYOR, Not Financial Advice
This chart is likely to help you in making better trade decisions if it did consider upvoting this chart.
Would also love to know your charts and views in the comment section.
Thank you

IOST/USDT BREAKOUT READY TO PUMP 100%!!Hi guys, This is CryptoMojo, One of the most active trading view authors and fastest-growing communities.
Do consider following me for the latest updates and Long /Short calls on almost every exchange.
I post short mid and long-term trade setups too.
Let’s get to the chart!
I have tried my best to bring the best possible outcome in this chart, Do not consider it as financial advice.
Get some IOST in
Likely to pump.
Buy on spot.
Accumulate in this range:- $0.013335 to $0.01405
Target:- 100%
SL-:$0.01197
DYOR, Not Financial Advice
This chart is likely to help you in making better trade decisions if it did consider upvoting this chart.
Would also love to know your charts and views in the comment section.
Thank you

IOST BRACKOUT! READY TO PUMP 50%!Hi guys, This is CryptoMojo, One of the most active trading view authors and fastest-growing communities.
Do consider following me for the latest updates and Long /Short calls on almost every exchange.
I post short mid and long-term trade setups too.
Let’s get to the chart!
I have tried my best to bring the best possible outcome in this chart, Do not consider it as financial advice.
IOST is breaking out from the falling wedge in a 4hr time frame and currently retesting it. Buy some and DCA later.
Entry range:- $0.328-$0.338
Target1:- $0.368
Target2:- $0.404
Target3:- $0.448
Target4:- $0.496
SL:- $0.31
Buy on spot or you can also use low leverage(2x-4x)
This chart is likely to help you in making better trade decisions, if it did do consider upvoting this chart.
Would also love to know your charts and views in the comment section.
Thank you

IOST/BTC TRADE SETUP! READY TO PUMP 200% LONGHi guys, This is CryptoMojo, One of the most active trading view authors and fastest-growing communities.
Do consider following me for the latest updates and Long /Short calls on almost every exchange.
I post short mid and long-term trade setups too.
Let’s get to the chart!
I have tried my best to bring the best possible outcome in this chart, Do not consider it as financial advice.
IOST is breaking out from a descending triangle in 2days time frame. It is holding very important support. Buying here will be very low risk and high reward.
Also according to Fib levels, there is an important support of 0.786 level. So it is worth buying here.
Buy some now and add more in dips.
Entry range:- 54-60 sats
Target1:- 82 sats
Target2:- 98 sats
Target3:- 116 sats
Target4- 130 sats
Target5:- 154 sats
Target6:- 178 sats
SL:- 50 sats
This chart is likely to help you in making better trade decisions, if it did do consider upvoting this chart.
Would also love to know your charts and views in the comment section.
Thank you

IOSTUSDT , This kind of movement can be happenHello everybody
According to the chart and the movement of price that we are in downward trend and we expect the price can drop and re-test again the support zone area.
If the price is not supporting and break the support zone of trend, the next important support zone for reduce average purchase and the zone for ending the correction shown on chart.
if you have any question send us messages in private
Good Luck
Abtin

IOSTUSDT - Trend Breakout!IOSTUSDT (4h Chart) Technical analysis
IOSTUSDT (4h Chart) Currently trading at $0.0596
Buy level :Above $0.0586
Stop loss: Below $0.0512
TP1: $0.0671
TP2: $0.0734
TP3: $0.0802
TP4: $0.0874
Max Leverage 3x
Always keep Stop loss
Follow Our Tradingview Account for More Technical Analysis Updates, | Like, Share and Comment Your thoughts.

IOSTUSDTIf it breaks the roof of the triangle in the form of wave 5 can grow up to the range of prz.

IOSTUSDT - accumulation in the trianglestop loss at the base of the figure.
entry now and you can add a position after the breakout. (If you are experienced).
The take profit was shown on the chart.
Preparing useful content for beginners
You will learn the best place where we can trade this instrument at low risk.
Write in the comments all your questions and instruments analysis of which you want to see.
Friends, push the like button, write a comment, and share with your mates - that would be the best THANK YOU.
P.S. I personally will open entry if the price will show it according to my strategy.
Always make your analysis before a trade


IOSTUSDT Buy the RetestIOSTUSDT Buy/Long
Waiting Restest for Entry
On smaller timeframe H1 IOSTUSDT brokeout a triangle pattern with less volume, it may indicate a fakeout.
Let the price make a retest to to breakout zone and a retest is must likely because the volume is not big enough and let the RSI come to a neutral zone then buy if it reverses from the breakout zone.
Entry Price : 0.003155 - 0.003180
Stop Loss : The previous low or 4%
Profit Target : T1 & T2 (15% < 25%)
Risk / Reward Ratio : 1:6
👍
