IOT

Consolidation is over. Short on a new Channel Down.IOTA broke the Rectangle pattern on a Bitcoin fueled rise on 1H but was still contained under 1.2582 of the previous High as seen on the 4H Arc shape. This neutrality (RSI = 50.167, CCI = -18.5085, Highs/Lows = 0.000) should break now as IOTUSD resumes the dominant 1D bearish trend (MACD = -0.076) on a new Channel Down. New shorts have been added with TP = 0.7947 as previously and the Nov 24, 2017 = 0.6704, Nov 02, 2017 = 0.3199, Jul 15, 2017 = 0.1459 the next supports/ target points.
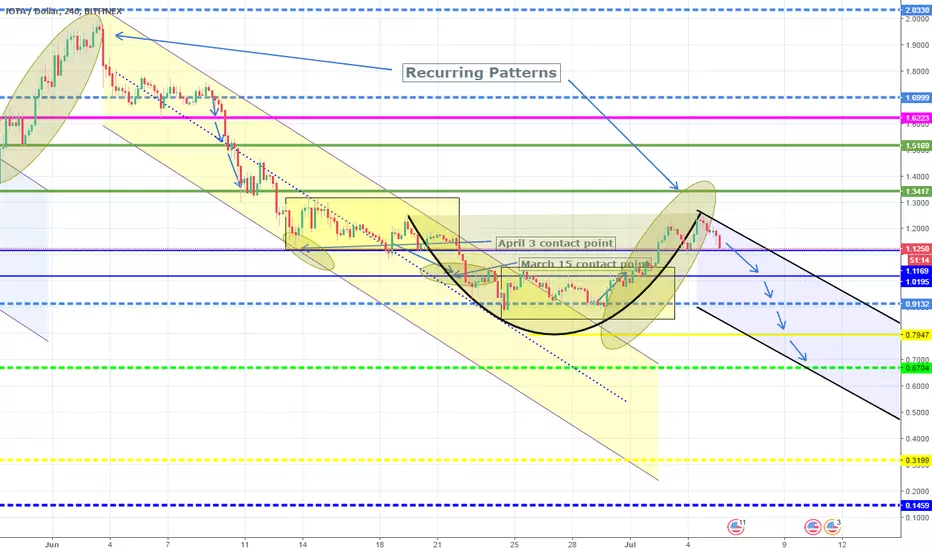
IOTUSD - Evaluating Bitcoin's move with altsAlthough BTC is what drives the market ultimately, the price action in alt coins can provide clues as to how the wave structures in bitcoin is unfolding.
Here in IOTA, we have a similar 3 wave up structure as to bitcoin during the bounce from June 24th.
Unlike BTC that started to form a wedge like structure, IOTA did not.
Instead, IOTA is printing a clear 3-3-5 corrective pattern.
The question now is whether wave C is completed or not.
My opinion is that we are still in wave 4 of C (which is an irregular flat) which should form a 5 wave structure to the downside terminating at around $1.07-$1.12.
It is also a possibility that the 5 wave structure in wave C has been completed. If this is the case, we can expect to test lows beyond that of June 24th.
All in all, IOTA is printing a corrective pattern to the upside, which means an impulse to the downside is imminent.
If IOT has to fall, bitcoin must lead the pack.
Although there are high uncertainties, if you are trading with a plan you will be fine.


Possible consolidation. Still short.IOTA has broken marginally then 1D Channel Down but still remains under heavy bearish mode (RSI = 31.878, Highs/Lows = -0.0959, MACD = -0.164). As you see on the chart there may be a possible recurrence of the previous 1H Rectangle pattern (with STOCHRSI = 47.986, Ultimate Oscillator = 49.518 already neutral) based on the High Volatility (ATR @ 0.0179). This doesn't change the plan for IOTUSD as 4H will either break now lower (B/BP = -0.0586) or in 2 - 3 sessions. TP is still 0.7947, with Nov 24, 2017 = 0.6704, Nov 02, 2017 = 0.3199, Jul 15, 2017 = 0.1459 the next supports/ target points.

TP hit again. 1D Channel Down continuation. Short.TP = 0.9132 (1W Support) hit, as the 1D Channel Down (RSI = 29.366) continues to decline after a new Lower High. However IOTUSD is still above the intermediate and according to the low MACD = -0.179, Highs/Lows = -0.1789, B/BP = -0.4081, the downside gap is significant. The next obvious downside targets are on the following contact points/ intervals: Nov 24, 2017 = 0.6704, Nov 02, 2017 = 0.3199, Jul 15, 2017 = 0.1459. Our TP = 0.7947.


IOTA/USD - DOUBLE BOTTOM - VOLKSWAGEN ***This information is not a recommendation to buy or sell. It is to be used for educational purposes only. it should not be considered financial advice***


All targets met. Slow decline continuation. Short.The price hit all downside targets (1.6223, 1.5169 & 1.3417) as it continues to trade within the very rigid bands of the 4H Channel Down (RSI = 36.191, Highs/Lows = -0.0144, BBP = -0.0610). The next obvious TP is the 0.9132 1W Support (MACD = 0). Since 1D however is oversold on STOCHRSI = 4.819, STOCH = 10.065 and Williams = -95.801, we expect a slow pace.

IOTAMoving in triangle. IOTABTC touch support line and dont break, now need go to the resistance line

What will happen next with BTC?Hello followers hope you are having a fantastic day so far.
We have prepared for you all market breakdown on what is about to happen next.
With BTC we could see a nice pull-down to my 6650 area where we stopped and started consolidating for past few days. So what is about to happen next?
BTC could possibly re-test the major trend-line which is shown on chart and then start melting back to around 6600 area. But if BTC close below 6600 area second scenario will be in-play. Because of late institutional manipulation that we could have seen BTC spiked from around 7700 to 6600 in one week so bearish momentum is in play more, and by that we are focused on these levels. We think that BTC could easily spike to around 5500$ in a 2 weeks, from where we could easily see 4500$ area and spike to around 3500$ area where also sits 200 EMA on weekly. Do not be afraid. We do not think that BTC is dead. Actually we think that spike to around 3500$ area is the best thing, that can happen to BTC, because the major bull-run will happen after that. If we do spike to that area(3500$) we will go straight to 12,000$ in a couple weeks. But if BTC doesnt close below 6600 area there could be possible move to that 12K area. But we think that bear market is not over, because we break that major trend-line which was respected for too many times and BTC used to reversed from there. But not this time.
Join my free group where i share my daily insights and my golden altcoin picks.
t.me


Lest be reali(OTA)stic here... simple long term investigationFirst of all : trend is not our friend now - it's a bad a$$ which makes it all awkward. Out of all of fantastic projects out there IOTA is more unique than any other. Not a blockchain but tangle, no mining, no fees, no Satoshi Nakamoto -but yet it resides in top 10 cryptocurrencies in marketcap for number of months now. Many will approach me here proposing ice bucket challenge - but let me tell you something - this project have HUGE potential... in long term.
Currently on 1hr we can see falling wedge as sign of possible bullish movement to the upside for shorts - I would be careful here however with statements that we're going up due to serious resistance and other indicators which states otherwise.
On 4h we finished last 5'th part of Eliot wave at 3'rd of June and now we can see that head and shoulders pattern is forming confirming movement to the down side... In my opinion if market will not go sideways by 11'th of june we will be back at 1.35$ levels.
1D presents ONE MASSIVE descending triangle with HUGE resistance at 1$ levels and that's nothing short of one enormous bear sign.
And than there's 1W ... with history of BTC skyrocketing until fuel was lost in December, since we're just gliding down on one massive parachute of adoption in areas of stratosphere... and in my opinion - there is land (and horizon) not waiting for us not that far.
I've read article today somewhere that until now Bitcoin was dying at least 300 times... 299 times it always went back to where it was before. Just on this simple rule we can assume we will see same levels we reached previously in future - not because of logic, science, and unbelievable properties and advantages of cryptocurrencies but by greed, newbie traders and hype related to market cycles. If you're patient enough to wait - wait and stay positive, remembering excitement from the past when everything was going so well, so easily that even chasing stop loss was nearly impossible :D
Since it's IOTA's investigation just imagine, that developers are working hard on block-chain in order to decrease payment fees and improve speed of transactions - with IOTA it was sorted before tangle was created ! it's fee free algorithm which speed depends on amount of users - the more adopted the technology, the faster it is (in order to create transaction from your own device this device must first confirm 2 other transactions !).
Now let it sink in ... since all cryptosphere is more-less based on assumption - is this a good concept ?
I think it's ok to accumulate...
If you're a trader don't ignore our rules, levels, theories - remember of capital management and strategies which works best for you - in the meantime...
Let's trade...

IOTA Short-Term Upside TargetIOTA formed the bullish divergence on the RSI oscillator after it found the low at $1.33. The following wave up resulted in a break above the 200 Moving Average and the downtrend trendline, suggesting the the price is likely to change the trend.
Fibonacci, applied to the corrective wave up after the trendline break, shows that currently 127.2% Fibs level, at $1.7, is being rejected. At the same time the 200 Moving Average also acting as the support, that is currently holding.
Such price activity suggest that IOTA should start to move higher, and could reach $3 resistance area, confirmed by 127.2% Fibs applied to the corrective wave down since 3rd of May.
If IOT/USD will break below current support at $1.7, confirmed by the daily close lower, the bullish outlook could be invalidated and IOTA could decline back to $1.33 support area. But considering the risk/reward ration, it seems that the buying opportunity is very reasonable at this time.

#IOTA is in the clouds, rejection around KS region#IOTA is in the clouds , rejection around KS region. Facing an important test in a few hours . The break above 50DMA (1.88) . If we get confirmation of the break then we can expect a bull run to 2.3 level from iota
50DMA break is important for $iota, currently at 1.88
Historical data whenever #iota has broken 50DMA level:
22 May: -23% drop in 8 days
14 April: +104% in 19days
16 Jan: -74% drop in 81days
9 Nov: +1024% in 27 days
8 Sept: -47% in 55days
4 Aug: +240% in 13 days
We need to be on the sidelines till we get a confirmation of the break, if entry is from 1.72 level then SL should be trailed appropriately.

IOTA ZIG ZAGWe can try to short IOTA till 1.64. 1. 64 is the 0.5 retracement of AB … 5-0 reversal pattern. This is more than an hypotesis.. there is a nice support there. I think that we could reach 2.20 after that.
Wait for confirmations and always a look at what bitcoin does..
You can see in an old idea that we are again at resistance against ETH and BTC.

Iota | Moving in XABCD Pattern Iota can go up with support XABCD Pattern and MACD
I think Iota can go down a little to zone buy 1 and zone buy 2
We can set a fews buy in this
Zone buy 1 : 21800 - 22100
Zone buy 2 : 20500 - 20800
If Iota countinue move in XABCD Pattern Iota can go higher 27000 in mid-term
Market can go up and down in this time
But in mid-term and long-term . I think it will go up

IOTA ready for a new bull run Trinitywallet has been released. The wallet looks good ...the chart even more.

IOTAFalling wedge -reversal pattern
Fundamental analysis
IOTA co-founder Dominik Schiener will be a speaker at TNW Conference in Amsterdam.
thenextweb.com
qubic.iota.org

Start of a bull run ?Rsi has bounced from our second support near the level of 40.
Can we touch the 80 mark on rsi again soon?
NOTE - 1.This is not an investment advice, its just for knowledge purpose.
2. Any suggestions or idea will be appreciated as I am learning TA.
