There is possibility for the beginning of uptrend in IOTETHTechnical analysis:
. IOTA/ETHEREUM is in range bound and beginning of uptrend is expected.
. The price is below the 21-Day WEMA which acts as a dynamic resistance.
. The RSI is at 38.
Trading suggestion:
There is a possibility of temporary retracement to suggested support zone (0.0018 to 0.0015). if so, traders can set orders based on Daily-Trading-Opportunities and expect to reach short-term targets.
. Beginning of entry zone (0.0018)
. Ending of entry zone (0.0015)
Entry signal:
Signal to enter the market occurs when the price comes to "Buy zone" then forms one of the reversal patterns, whether "Bullish Engulfing" , "Hammer" or "Valley" , in other words,
NO entry signal when the price comes to the zone BUT after any of reversal patterns is formed in the zone.
To learn more about "Entry signal" and the special version of our "Price Action" strategy FOLLOW our lessons:
Take Profits:
TP1= @ 0.0023
TP2= @ 0.0028
TP3= @ 0.0034
TP4= @ 0.0043
TP5= @ 0.0057
TP6= @ 0.0074
TP7= @ 0.0134
TP8= Free
IOT

There is possibility for the beginning of uptrend in IOTETHTechnical analysis:
. IOTA/ETHEREUM is in range bound and beginning of uptrend is expected.
. The price is below the 21-Day WEMA which acts as a dynamic resistance.
. The RSI is at 38.
Trading suggestion:
There is a possibility of temporary retracement to suggested support zone (0.0018 to 0.0015). if so, traders can set orders based on Daily-Trading-Opportunities and expect to reach short-term targets.
. Beginning of entry zone (0.0018)
. Ending of entry zone (0.0015)
Entry signal:
Signal to enter the market occurs when the price comes to "Buy zone" then forms one of the reversal patterns, whether "Bullish Engulfing" , "Hammer" or "Valley" , in other words,
NO entry signal when the price comes to the zone BUT after any of reversal patterns is formed in the zone.
To learn more about "Entry signal" and the special version of our "Price Action" strategy FOLLOW our lessons:
Take Profits:
TP1= @ 0.0023
TP2= @ 0.0028
TP3= @ 0.0034
TP4= @ 0.0043
TP5= @ 0.0057
TP6= @ 0.0074
TP7= @ 0.0134
TP8= Free

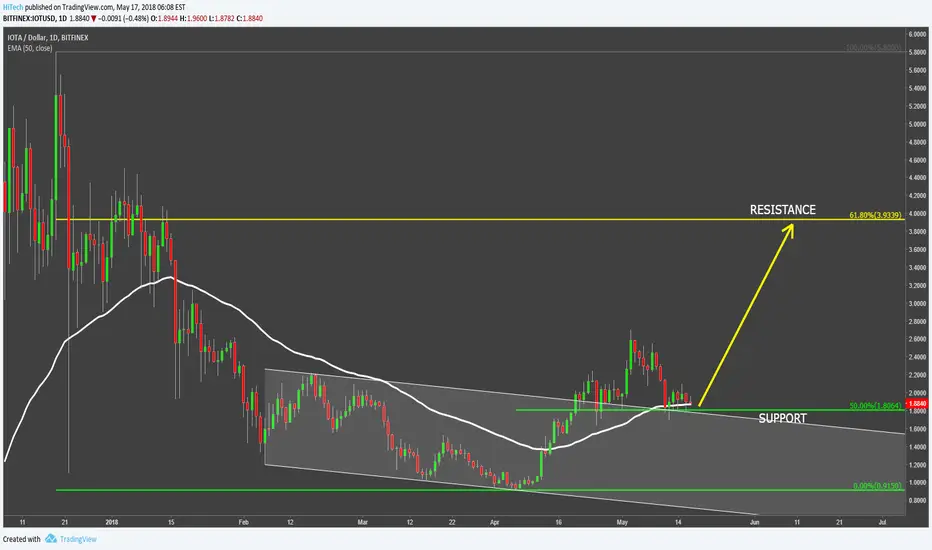
IOTA Has Over 100% Upside PotentialIOTA formed a bottom near $1 psychological support and price started to move up. IOT/USD broke above the 50 Moving Average followed by the breakout of the descending channel. Price has reached the high at $2.7 and corrected down.
The support has been found at 50% Fibonacci retracement level that is $1.8. At the same time IOTA is rejecting the 50 Moving Average and the upper trendline of the descending channel. If current support will continue to hold, price is likely to move higher, where the next resistance is seen at 61.8% Fibonacci retracement, that is $4 area.
On a downside, daily close below $1.7 is required in order to invalidate bullish outlook. In this case IOTA might go down, towards previous support area at $1
End of wave 2 ??Here RSI is at a critical level near 47-48 range. If it sustains we can see the starting of wave 3.
IF that level breaks and BTC remains unstable, level 40 on RSI could be seen as a support.
Hope that this level sustains and we can see a pullback.
NOTE - 1.This is not an investment advice, its just for knowledge purpose.
2. Any suggestions or idea will be appreciated as I am learning TA.

Fitbit: an AI and IoT Play - This is the Cheapest it's Gonna GetFitbit's value isn't just in its wearables.
It's in its data and cloud connectivity.
Fitbit's had a good run with its line of functional, stylish activity trackers and health monitors. Customers can choose between classic trackers, a few smart watches, and even smart headphones and weight scales - with a large selection of accessories to mix and match throughout the product line.
But that's only taken Fitbit so far - in the case of its stock price, down massively into the single digits since 2016.
Fitbit's stock has been adrift in the single-digit doldrums for a long time now. But believe it or not. . . This is the cheapest Fitbit is ever going to get.
Why? Because Fitbit is making its foray into its next big space, its next supreme endeavor - health monitoring, big data, electronic medical records, and cloud connectivity.
On 4/30/18 Fitbit announced it is partnering with Google's Cloud Platform to facilitate its entry into the data and I.o.T (Internet of Things) of healthcare. Real-time biometrics, new and innovative application use and creation, population health analysis, and more will form the meat-and-potatoes of Fitbit Health Solutions - Fitbit's initiative to use omnipresent real-time and stored data and analysis to achieve positive health outcomes with mass health monitoring.
Visionaries and forward-thinkers have been talking about the burgeoning field of biometric sensors and health monitoring for a few years now. Fitbit and Google look to be the mainstream facilitators and operators in this new space of healthcare. And we all know humanity's two concurrent life-changing revolutions - AI and blockchain - will be a big part of this.
The technicals are nicely supporting the story. The stock has been in the $5-$6 USD range throughout 2018, and a case could be made for an inverse head-and-shoulders bottom printing since February 2018 to today (though it might be just range noise); but with volume relatively low, we may only just now be at an inflection point - the big moves and big money are probably a little ways out as Fitbit's brand-new endeavors prove themselves throughout the rest of the year and into the next and beyond.
Fitbit could be at a massive discount with huge money to be made longer-term.
Please like, follow, and share, and maybe we can have fun and do great things together.
Thanks again!
See it on the site: holsturr.com/category/markets/charts/
** For speculative and research purposes only - good luck! **

Not a Top, AI Immergence, Microsoft Run to $121 this Summer. . .I wouldn't believe it myself if I wasn't writing about it, but MSFT still has some room to run.
Microsoft's story and technicals favor upward movement these next few months.
Thanks for lending your attention!
MSFT is printing an ascending triangle with previous highs in the upper USD $97's, but when price breaks up those levels won't provide much resistance - more on that later.
For now, let's talk about Microsoft's direction as a company. CEO Satya Nadella understands the importance of Web 3.0 and 4.0 and sees the immediate future of computing lies in cloud services, Infrastructure as a Service (I.a.a.S) systems, and Internet of Things (I.o.T) technology and connectivity.
In Q4 2017, Microsoft was already taking market share from the undisputed giant in the space - Amazon Web Services (A.W.S) - with their initiative to expand and improve their Azure cloud platform. Microsoft is pushing efforts to recruit development talent to Azure and onboard more users with improvements and expansions of the platform.
Nadella and Microsoft also understand the revolutionary implications of Web 4.0 and what role AI will play in a "smart Internet". Data and connectivity will be king as AI systems facilitate the wholesale immergence of automation into the human experience, and Microsoft's decision to steer initiative away from products like Windows and into projects like AI development will pay off as automation and I.o.T become a part of everyday life just as Microsoft's operating systems became a part of everyday life back in the 90's.
Shifting focus to the technicals, MSFT is tracing an ascending triangle that is approaching an apex. Price moves follow compressing ranges, and the direction is looking up. The chart shows high volume on the dips in the triangle, indicating buyers are scooping up what they perceive as cheap shares.
Looking way back on a monthly chart, we can see similar price action in 1999 to what we see so far in 2018 - and that means we may not be at a top just yet.
Mimicking 1999's chart would mean bad times long-term, but in the short-term would mean a run in price over the summer and possibly through the end of the year with prices putting in a top sometime in the next few months. I believe this price action meshes well with MSFT's endeavors - shifting focus away from Windows and into I.a.a.S and Azure as well as AI, automation, and I.o.T technology. This shift may put pressure on stock price in the next couple years, but in the short-term, Microsoft might have a relative top ultimately 25%-30% higher than today's prices.
Microsoft could be cheap right now given historical price action, current technicals, and the overall story of the company. I believe Microsoft hasn't put in its highs of the year just yet; the summer and fall could see MSFT in the USD $120's.
I'm still bullish on certain sectors and certain stocks, but in the world's precarious geopolitical and financial environment, I keep some puts on the market and recommend traders and investors alike be prepared for a transition into a bearish paradigm. Be ready for sudden drops in the market. Let profits run, look for good stories and charts, but don't be afraid to take some off the table if you've got good numbers on paper.
Please like, follow, and share, and maybe we can have fun and do great things together.
Thanks again!
See it on the site: holsturr.com/category/markets/charts/
** For speculative and research purposes only - good luck! **

IOTA BreakdownA little late on the IOTA train, but here are the support/resistance lines I drew out. In my opinion, a major breakout looks like it could be taking place, especially if you look at the 1-day chart. I would keep my eye on this one and expect a drop down to key support levels (grey rectangle) and then a spike up to $2.90.

Just cents from historic landmark 0.618This is just beginning, if you did not start to enter the previous calls (previous ideas) I think now the best opportunity to enter is to wait for the setback that you should have after getting the 0.618

Time to buy IOTAI think that IOTAETH found a good support at 50% Fibonacci level, also 50EMA is going to cross 200EMA, which is strong bullish signal. We can make some purchases at this levels (0.0028-0.0030). Profit targets can be placed at 0.005 (70% of position) and 0.0067 levels (20-30% of position).

possibly another pump inc
Given: Trinity wallet has to align with this. If they don't audit thoroughly again on the wallet.


IOT (IOTA) downtrend revealing a beauty of channelsAs noted in my previous IOTUSD analysis on the 4H IOT (IOTA) liberating from BTC , the downtrend resistance (further solid green bold) acted very strong in the latest price follow through. A boring side move-out of that resistance from Apr-02 to Apr-12, though luckily confirmed as support at Apr-04, while sametime stealth-like playing under the 100% retracement, is now opening us a new view of support/resistance channels (blue solid and dashed sub-channels).
Since begin of March the whole 200 EMA (purple curve) southside action can be viewed as a cup&handle formation (yellow arcs), which got tested exactly at the 200 EMA resistance (Apr-13), broken up with volume (Apr-14) and confirmed as new support (Apr-16). Nicely, we now also see a resistance/rejection at the sub-channel mirroring (dashed blue) as a perfect range reflection of the last 3 months price action to the upside.
Technical targets with nice confluences (green cross):
- Cup&Handle follow through: $2.10
- Fib 78% restracement: $2.10
- Same time with the new entered channel resistance blue at $2.10 (which would extendedly play out at Apr-26)
As I overall don't yet see any convincing sign of an "ALT season" start, uncoupling strongly from Bitcoin/BTC major market(& sentiment) leader, we need to consider also some potentials to the downside. Thus I added also a formation of a potential H&S playout in the next days (grey letters and grey triangles), which also has credence within the leading channels:
- a completion of that small inside pattern would lead us down to retest the edge of the the current upbroken macro channel (grey cross), which would also better confirm this as new support
- a then subsequent uptest of the support/resistance-confirmed sub-channel (dashed blue) and the 200 EMA could totally lead out and morph the cup&handle into a larger inverse H&S pattern ! (light added red arc)


IOT-USD 10-Day-Ahead Prediction - 04/10-04/19 PeriodArtificial Intelligence/Deep Learning Enabled 10 Day Ahead Predicted values for IOTA (IOT) have been plotted on the chart.
The method used in this prediction is Deep Learning based, and using complex mathematical models/methodologies to extract hidden time series features in vast amounts of IOT related data.
The expected 5 Day Change is 6.087 %
The expected 10 Day Change is 9.565 %
Predictability Indicator is calculated as : 0.880
Predicted 10-Day Ahead Prices are as follows:
Tue Apr 10 Wed Apr 11 Thu Apr 12 Fri Apr 13 Sat Apr 14
1.0854 1.0971 1.1064 1.1147 1.1245
Sun Apr 15 Mon Apr 16 Tue Apr 17 Wed Apr 18 Thu Apr 19
1.1330 1.1407 1.1478 1.1545 1.1613
You can see our previous predictions on the same chart highlighted green for IOT ;)
Please note that outliers/non-linearities might occur, however our Artificial Intelligence/Deep Learning Enabled predictions indicate the softened/smoothed moving direction of the stocks/commodities/World indices/ETFs/Foreign Currencies/Cryptocurrencies.
Feel free to contact us for your questions.


IOT (IOTA) additional LOG scale tunnelingAdditional to my related linear trend analysis (see ), we can see IOTA also acting strongly along macro logarithmic downtrend channels, where an upbreak into the next level seems due.

IOT (IOTA) liberating from BTC dominance?After retesting the fib 100% retracement IOTA cautiously seems to confirm a bottom at $1 .
Obervations adding credence are:
- volume picking up at the full retrace retest
- IOTA acting as the seemingly only exception in all over cryptos BTCUSD price correlation
> uncoupling contrariwise since several days / missing out the March 16-17 down extension of all other crypto
- stair stepping long term downtrend resistances (green dashed light, green solid light)
Key resistances to keep your eye out:
- uncorrected "bubble" macro downtrend resistance (green solid bold) right ahead at $1.50
- 200 EMA at $1.60 (dark rose) - provided weak support = weaker resistance now
- 78% fib retracement at $2.10
- macro LOGARITHMIC channel switch in my related IOTUSD idea, resisting also at $1.50 see:


Hope for IOTA?IOTA has disappointed investors waiting for some semblance of a recovery. It is currently solidly down trending, haven given up the $1.30 handle entirely. If we can manage to break $1.37, we’ll face resistance at $1.435 and $1.44, which seems light years away. At $1.20, we’ll find support, then there is a vacuum zone to $1.02, which seems to correspond with the $1 psychological mark. It is worth noting that we have broken the lower bound of the corrective phase of the previous Elliott Wave , which implies an extension of this phase. The Kovach Momentum Indicators are very bearish as one could expect. We have been pressing the lower bound of the KRI for some time now.
Interested in the Altcoin Index and the Crypto Spread Indicator? Check them out here !
For daily commentary on cryptocurrencies, subscribe to our newsletter !
IOTA RangingIOTA joins the rest of the cryptocurrencies who insist upon ranging. This is a frustration to investors waiting for some semblance of a recovery. IOTA currently seems to be facing resistance 1.37, and may be giving up the $1.30 handle entirely. It seems to be settling on the range between $1.20 and $1.37. If we break out to the upside, we must punch through $1.435 and $1.44. Then there is a relative vacuum zone to $1.53. If not, $1.37 will provide support, and then the lower $1.20's. It is worth noting that we have broken the lower bound of the corrective phase of the previous Elliott Wave, which implies an extension of this phase. The Kovach Momentum Indicators do not suggest that this is likely any time soon.
Interested in the Altcoin Index and the Crypto Spread Indicator? Check them out here !
For daily commentary on cryptocurrencies, subscribe to our newsletter !

IOTA Finds SupportIOTA too has remained range bound, currently testing the upper level of this range near $2. Like the other cryptos, IOTA could really use a burst of momentum to confirm entry into wave 3 of the impulse of the Elliott Wave. The central moving average of the KRI continues to provide support around $1.92. Other levels of support include $1.95, $1.78, then $1.60, and finally we have $1.45, a Fibonacci level. The psychological $2 level is the most important level to the upside. We must break it before we hit $2.20, after which, there is a relative vacuum zone until $2.25.
Interested in the Altcoin Index and the Crypto Spread Indicator? Check them out here !
For daily commentary on cryptocurrencies, subscribe to our newsletter !
