IOTA time to shortIOTA shows its weakness at IOTA/BTC chart.
We can see:
Bad cross of EMA indicator
Failed growth on 19th of May
Bear divergence at day RSI chart
ATH of LONGS at IOTBTCLONGS chart Bitfinex (!)
IOTA/BTC is going to at least double bottom, which means we will see 0.000040 soon or even lower!
Stop loss at 0.000039.
IOT

ITC BTC Still Bullish ContinuationITC vs BTC is very bullish still, the one month is a steady growth with some major surges.
Targets 4100 4300 5500

IOTA following the foot steps of EthereumIf the price can breakout of its overhead resistance, a measured move would target $0.65

IOTAIOTBTC start to growing
Break out resistance line of downtrend channel
After impulse forming bullish flag
RSI -ovesold - look bullish
Waiting for 61.8% level fibonacci
Target 0.00006000


IOTA dead or will the Jaguar (Land Rover) roar back to life?IOTA eyes 2x gains with potentially more to follow.
Technicals
IOTA down 90% + in brutal bear market.
USD chart looks to be in deep accumulation range $0.2 - $0.4.
BTC chart is super oversold on the weekly with bullish divergence on the daily RSI.
Fundamentals
Directed Acyclic Graph (DAG) technology is a big differentiator in a crowded space.
Internet of Things (IOT) space set for huge growth.
IOTA had a lot of hype 2 years ago and rose to great heights in flurry speculation.
Since falling it seems to have found a base vs USD and is ranging in a ranging zone.
Expecting a bounce, if IOTA is able to blast through all major daily moving averages it should reach around 8000 sats / 52.5 cents for up to 100% gains.
If the crypto market remains bullish continuation would target 13000 sats / $1.
Possible plays:
1. Buy in the accumulation zone (aggressive)
2. Buy a daily close above $0.325 (200d EMA) (moderate)
3. Buy a breakout on decent volume of the accumulation zone at $0.40 (conservative)

$IOTA Supports - Short ideaLooking from here, it seems that IOTA is losing the last important support for another big fall. Black horizontal lines indicate possible purchase points. Below one, the target will be as follows. I would not go into IOTA until a clear sign of reversal, this can last for months. I'm short

IOTA - Under The Empty VoidAfter the pump caused by the news of IOTA's partnership with Jaguar Land Rover, it had since then fully retraced and fallen back down. This is highly bearish as it shows a lack of follow through and continuation from the bulls. IOTA/BTC pairing is currently showing a very decent risk to reward for bears as a breach of the recent low, which is also the all time low, will cause intense fear and a bunch of stop-loss cascade. There is no support left for IOTA, it's just a matter of when the support breaks. I believe this is a great gamble given the high r/r ratio here for shorts.

A trading opportunity to buy in IOTAETHTechnical analysis:
. MIOTA/Ethereum is in a range bound and the beginning of uptrend is expected.
. The price is below the 21-Day WEMA which acts as a dynamic resistance.
. The RSI is at 19.
. While the RSI downtrend and the price downtrend in the daily chart are not broken, bearish wave in price would continue.
Trading suggestion:
. There is a possibility of temporary retracement to suggested support zone (0.00160 to 0.00150). if so, traders can set orders based on Price Action and expect to reach short-term targets.
Beginning of entry zone (0.00160)
Ending of entry zone (0.00150)
Entry signal:
Signal to enter the market occurs when the price comes to "Buy zone" then forms one of the reversal patterns, whether "Bullish Engulfing", "Hammer" or "Valley" in other words,
NO entry signal when the price comes to the zone BUT after any of the reversal patterns is formed in the zone.
To learn more about "Entry signal" and the special version of our "Price Action" strategy FOLLOW our lessons:
Take Profits:
TP1= @ 0.00176600
TP2= @ 0.00186000
TP3= @ 0.00200700
TP4= @ 0.00231500
TP5= @ 0.00245000
TP6= @ 0.00257000
TP7= @ 0.00282500
TP8= @ 0.00305800
TP9= @ 0.00335000
TP10= @ 0.00365000
TP11= Free

IOT/BTC - bearish pressurePattern is looking ugly with more pressure to get way cheaper. Too risky right now imo.


Reversal has started All over crypto now it’s IOTA’s turnBulls are in! Channel is going up everything indicates a big come back. Low risk high reward ratio set stoploss on orange/yellow line

IOTA - Hopium, Hopium, and Hopium...IOTA is looking slightly bullish on the daily timeframe as it is about to break out of the triangle. Not to mention, bulls did an amazing job defending the daily MACD cross right at the zero mark.
On the weekly timeframe, we can see the RSI making a potential inverse head and shoulders pattern. Similar to every inverse head and shoulders pattern, we must wait for the break of neckline resistance as confirmation.
Using a variety of synthetic currency pairs, we can compare the strength/weakness between IOTA and other cryptocurrencies. In this example, we will use synthetic pair IOTUSD/NEOUSD which simplifies into IOT/NEO.
There's a very visible bearish divergence in MACD, RSI, and Stochastic. There's a possibility that money from algo traders that are trading synthetic currency pairs may go into IOTA due to its temporary weakness against other cryptocurrencies. But keep in mind, this is simply a method to compare the strength/weakness between two highly correlated asset. USD value of IOTA does not necessarily have to go up in order for IOT/NEO to go down.
Using IOT/ETH pairing, we could see that we're approaching a long term support trendline with a double bottom starting to form. This further supports my point in IOT/NEO: IOTA should theoretically gain strength compared to other cryptocurrencies in the coming days or weeks.
Just like every single double bottom, a retest of the neckline is necessary. The neckline support must hold or else it would indicate that IOTA is still too weak.
Feel free to share your long-term bearish ideas, it's always good to know both sides.

There is a trading opportunity to buy in IOTAUSDMidterm forecast:
While the price is above the support 0.2045, beginning of uptrend is expected.
We make sure when the resistance at 0.4015 breaks.
If the support at 0.2045 is broken, the short-term forecast -beginning of uptrend- will be invalid.
Technical analysis:
The RSI bounced from the downtrend #1 and it prevented price from more gains.
A trough is formed in daily chart at 0.2667 on 03/09/2019, so more gains to resistance(s) 0.3340 and maximum to Major Resistance (0.4015) is expected.
Price is above WEMA21, if price drops more, this line can act as dynamic support against more losses.
Relative strength index (RSI) is 49.
Trading suggestion:
There is a possibility of temporary retracement to suggested support zone (0.2660 to 0.2045). if so, traders can set orders based on Price Action and expect to reach short-term targets.
Beginning of entry zone (0.2660)
Ending of entry zone (0.2045)
Entry signal:
Signal to enter the market occurs when the price comes to " Buy zone " then forms one of the reversal patterns, whether " Bullish Engulfing ", " Hammer " or " Valley " in other words, NO entry signal when the price comes to the zone BUT after any of reversal patterns is formed in the zone. To learn more about " Entry signal " and the special version of our " Price Action " strategy FOLLOW our lessons :
Take Profits:
TP1= @ 0.3340
TP2= @ 0.4015
TP3= @ 0.4535
TP4= @ 0.5260
TP5= @ 0.6105
TP6= @ 0.7920
TP7= @ 0.9265
TP8= @ 1.1550
TP9= @ 1.4475
TP10= @ 1.7435
TP11= @ 2.2170
TP12= @ 2.6930
TP13= @ 3.3680
TP14= @ 4.2300
TP15= Free

Digital Security will be an upcoming market the coming yearsDigital Security will be an upcoming market the coming years for it's connection with IOT and Data industries, which are also emerging.

There is a trading opportunity to buy in IOTAUSDMidterm forecast:
While the price is above the support 0.2045, beginning of uptrend is expected.
We make sure when the resistance at 0.4015 breaks.
If the support at 0.2045 is broken, the short-term forecast -beginning of uptrend- will be invalid.
Technical analysis:
While the RSI uptrend #1 is not broken, bullish wave in price would continue.
Price is above WEMA21, if price drops more, this line can act as dynamic support against more losses.
Relative strength index ( RSI ) is 57.
Trading suggestion:
. There is a possibility of temporary retracement to suggested support zone (0.2660 to 0.2045). if so, traders can set orders based on Price Action and expect to reach short-term targets.
Beginning of entry zone (0.2660)
Ending of entry zone (0.2045)
Entry signal:
Signal to enter the market occurs when the price comes to " Buy zone " then forms one of the reversal patterns, whether " Bullish Engulfing ", " Hammer " or " Valley " in other words,
NO entry signal when the price comes to the zone BUT after any of the reversal patterns is formed in the zone.
To learn more about " Entry signal " and the special version of our " Price Action " strategy FOLLOW our lessons:
Take Profits:
TP1= @ 0.3340
TP2= @ 0.4015
TP3= @ 0.4535
TP4= @ 0.5260
TP5= @ 0.6105
TP6= @ 0.7920
TP7= @ 0.9265
TP8= @ 1.1550
TP9= @ 1.4475
TP10= @ 1.7435
TP11= @ 2.2170
TP12= @ 2.6930
TP13= @ 3.3680
TP14= @ 4.2300
TP15= Free

ITC Btc coming - looks bullish to me.I am not going deep into the charting here since my lack of skills with the tools will not do my idea justice.
Have a look, TA it better if you want, just an idea.

There is a trading opportunity to buy in IOTAUSDMidterm forecast:
While the price is above the support 0.2045, beginning of uptrend is expected.
We make sure when the resistance at 0.4015 breaks.
If the support at 0.2045 is broken, the short-term forecast -beginning of uptrend- will be invalid.
Technical analysis:
While the RSI uptrend #1 is not broken, bullish wave in price would continue.
Price is below WEMA21, if price rises more, this line can act as dynamic resistance against more gains.
Relative strength index (RSI) is 45.
Trading suggestion:
. There is a possibility of temporary retracement to suggested support zone (0.2660 to 0.2045). if so, traders can set orders based on Price Action and expect to reach short-term targets.
Beginning of entry zone (0.2660)
Ending of entry zone (0.2045)
Entry signal:
Signal to enter the market occurs when the price comes to " Buy zone " then forms one of the reversal patterns, whether " Bullish Engulfing ", " Hammer " or " Valley " in other words,
NO entry signal when the price comes to the zone BUT after any of the reversal patterns is formed in the zone.
To learn more about " Entry signal " and the special version of our " Price Action " strategy FOLLOW our lessons:
Take Profits:
TP1= @ 0.3340
TP2= @ 0.4015
TP3= @ 0.4535
TP4= @ 0.5260
TP5= @ 0.6105
TP6= @ 0.7920
TP7= @ 0.9265
TP8= @ 1.1550
TP9= @ 1.4475
TP10= @ 1.7435
TP11= @ 2.2170
TP12= @ 2.6930
TP13= @ 3.3680
TP14= @ 4.2300
TP15= Free

IOTBTC LongLots of rejection on support
pinbar, hammer and inside bar price action
looks like we got a local bottom and will test higher - first tp is at 0,0000934 - sl below local lows at approx. 0,0000687

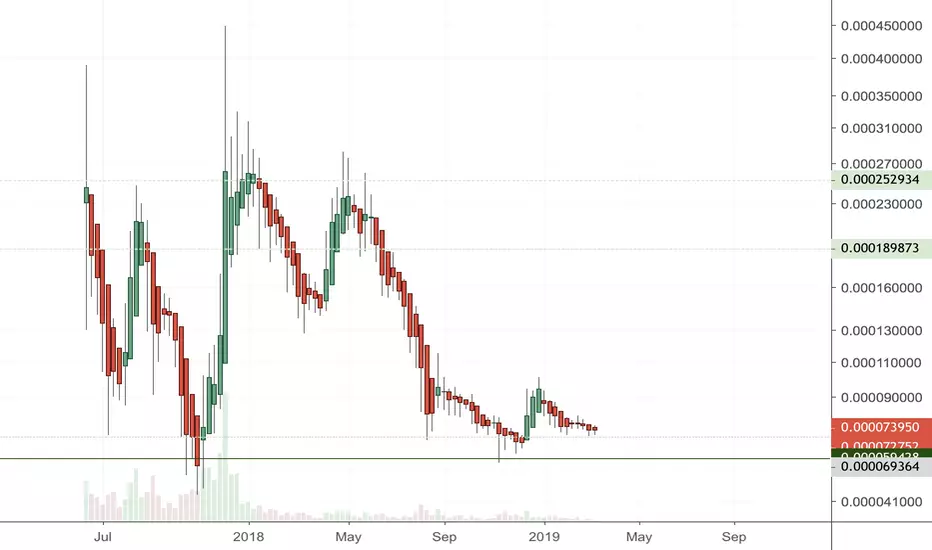
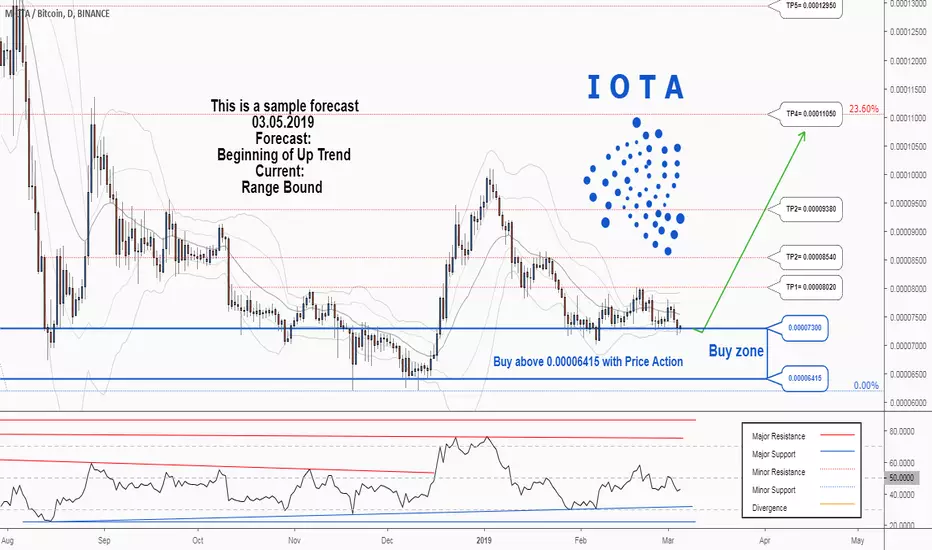
A trading opportunity to buy in IOTABTCTechnical analysis:
. IOTA/BITCOIN is in a range bound and the beginning of uptrend is expected.
. The price is below the 21-Day WEMA which acts as a dynamic resistance.
. The RSI is at 43.
Trading suggestion:
. There is a possibility of temporary retracement to suggested support zone (0.00007300 to 0.00006415). if so, traders can set orders based on Price Action and expect to reach short-term targets.
Beginning of entry zone (0.00007300)
Ending of entry zone (0.00006415)
Entry signal:
Signal to enter the market occurs when the price comes to " Buy zone " then forms one of the reversal patterns, whether " Bullish Engulfing ", " Hammer " or " Valley " in other words,
NO entry signal when the price comes to the zone BUT after any of the reversal patterns is formed in the zone.
To learn more about " Entry signal " and the special version of our " Price Action " strategy FOLLOW our lessons:
Take Profits:
TP1= @ 0.00008020
TP2= @ 0.00008540
TP3= @ 0.00009380
TP4= @ 0.00011050
TP5= @ 0.00012950
TP6= @ 0.00014060
TP7= @ 0.00016480
TP8= @ 0.00018910
TP9= @ 0.00026760
TP10= @ 0.00031200
TP11= Free
IOTA ($IOTA) - up to 460% PPT! Long term trade.$IOTA is showing bullish divergence on daily chart.
Price reached buy zone and had been moving there for a while.
$IOTA is one of the top project in crypto space with great idea and community support.
Green - buy. Red - sell.
I do not recommend using this chart for margin trading.
It's not a financial advice.
Trade carefully and good luck!

IOTBTC - +70% tradeWe need to fill the gap left by the weekly bearish candle on 6th August 2018.
Target should be the weekly block at around 0.000125.
