IOTA

IOTA long$IOTX is bouncing off the support level at the ascending trendline. Bullish movement to resistance level at 0,1178$ is likely to happen.

LTC - levels to watch on the way up...Possible long after confirmation of current resistive formation forming on Daily (thin yellow line). Theoretical confirmation circled.

IOTA: Guess who’s back 🎤„Guess who’s back,
Back again,
IOTA’s back,
Tell a friend.”
After its short trip above the support at $0.9810, IOTA is back in the green zone between $0.8968 and $0.7442, imitating Eminem in his song “Without Me” by proclaiming:
“Now this looks like a job for me,
So everybody, just follow me,
‘Cause we need a little controversy,
‘Cause the green zone feels so empty without me.”
We expect IOTA to continue its way though the green zone until its lower end at $0.7442. Just below this edge, IOTA should complete wave c in orange as well as the subordinate wave (ii) in blue and shoot up afterwards. However, there remains a 45% chance that IOTA will not manage to turn around shortly below the green zone. In this case, it should fall deeper still below $0.5736.

IOTA - Trending the boxHello trading friends,
This is a small view of IOTA.
IOTA is into the interesting zone - possibly coming time a price change into Long if BTC stays stable and increasing trend.
Further shows the out-of-box trend possibility for new scalp trading.
It's important that IOTA should hold the 0,69 with a time frame and confirmation to stay in the positive zone.
Further a breakout above the 1 USD + means a new price action, and out of the box.
Have a great day.
This is not a trading call and manages at all-time risk.
If you did like this content, leave a like and follow - thank you

IOTX longIOTA has found the support level around Fibonacci 0.5 level. After the bounce off the level, the continuation of bullish movement to 0,17$ is likely to happen.

IOTA - Potential Bullish Reversal!IOTA is approaching a strong support so we will be looking for buy setups.
on DAILY: IOTA is forming a symmetrical triangle in brown but the upper trendline is not valid yet, so we are waiting for a new swing high to form around it to consider it our trigger swing. (projection in purple)
Trigger => Waiting for that swing to form and then buy after a momentum candle close above it (gray zone)
Meanwhile, until the buy is activated, IOTA would be overall bearish can still trade lower till the green support zone where we will be looking for new buy setups to form.
Good luck!
All Strategies Are Good; If Managed Properly!
~Rich

IOTA - Breakout of resistance IOTA breaks out of resistance with price making higher lows after a strong short-term accumulation (Accumulation1). I will wait for the price to retest resistance and bounce off from previous resistance becoming support before I go long. I will place my profit target at Accumulation2 where there seems to be strong selling pressure.

IOTAUSD ❕ hit resistance and slowed down.IOTA hit resistance and slowed down.
I expect a correction, possibly a move to support.
Have a nice trade!
Your Solldy

IOTA: Under Water 🤿IOTA has jumped off the cliff at $0.9810 and dived into the green thicket of sea weed between $0.8968 and $0.7442. Here, it has been swimming along for a while now, watching the wildlife of the underwater world. We expect IOTA to go a bit deeper still and to finish wave c in orange just below the green thicket. Then, the dive should be over and IOTA should resurface above $0.9810. From there, long-term rise is possible again.
As they are still uncharted, though, IOTA could find something interesting in the depths below the green sea weed thicket and dive below $0.5736 to examine it. The results could then even lead to a continuation of the dive further down. This alternative scenario is rated with a probability of 45%, after all.

iota signalin iota we have 4h pivot and we can got to sell trade
open:1.57$
tp:1.11$
tp:1.065$
tp:1.019$
sl:1.23$

IotaA make or break moment for this idea.
I am still bullish at the moment, but that is being put to the test as we speak.
Are you bullish or bearish?

IOTA - the market remains ruthlessThe entire crypto-asset market is bleeding. We were looking for a bullish break-out to the upside with one condition to be met. The crypto market would have to remain bullish. Unfortunately, we have seen the opposite due to interest rate hikes, the banning of crypto in Russia and a potential new pandemic escalation leading to a strong sell-off. Not only in the crypto market, but across different asset types we are experiencing strong declines while tech is one of the hardest hit sectors.
From a technical perspective, we were rejected from the 200D MA. MACD is diverging again and facing the downside which is a bad sign. RSI shows us a hidden bullish divergence which is on the first sight good, but we have a lot more room to go down as oversold regions are much lower than at level 40. I assume a strong support at the 0.6 - 0.8 level and we could bounce quite nicely here. Also depends on how much longer the general market will remain bearish.
Time to BUIDL and forget about returns for a while.
Good luck with your trades! Do not consider this as financial advice.

Here's how LTC will reach 1k (and you won't be ready)Firstly pay attention to long-term RSI values, where signs of a hidden bullish divergence emerge.
Secondary consider the blue scenario playing out (yellow) the same way as it did in the past.
The more bearish the crowd they said.
Fear and greed index currently at levels of EXTREME FEAR.

IOTA must maintain the level of support.IOTA is in a very important place, we have to hold the $ 1 price because it is a very important support and to stay in the current triangle zone. Observe the behavior of BTC and whether the price IOTAstarts to accumulate to the new rise.

Looks like make-or-break for IOTA right now!Looks like make-or-break for IOTA right now!
IOTA near to break the price support beginning at Corona crash 2020.
If it breaks future with higher prices maybe far away.
Of corse fakeouts can play out as well... but a bounce now is what I want to see.
What do you think? 😎
Drop me a nice comment if you'd like me to analyze any other cryptocurrency.
*not financial advice
do your own research before investing

IOTA: Don’t Get Too Comfy!☝️After its steep descent from the orange-colored zone, IOTA has been relaxing a bit and puttering around between $1.1 and $1.2. However, it shouldn’t get too comfy because we expect the price to fall below $0.9810 soon. There, it should get caught by the green area between $0.8968 and $0.7442, finish wave c in orange and bounce off again.
Still, there is also a 30% chance that IOTA could shy away from touching the $0.9810 mark and rather decides to take off earlier. If it manages to reach the resistance at $2.0842, further rise will become more likely.


7 Year old Bullish triangleWe just bounced off serious support, both within the LTCUSD and LTCBTC trading pairs. LTCBTC marked recently a historical low in relation to Bitcoin, hence we are witnessing increased volatility and significant growth in relation to USD.
Considering the size of this triangular formation where support is clear targets in the area of previous top (c.413 USD) seem to be merely the beginning of the explosive growth which we will possibly witness within the coming weeks. T1 for this long term chart would be the psychological 1k, following further Fibo resistance levels.
Never forget money management, risk/reward ratios, or stop-losses!

IOTAUSDTIOTA Have a good Condition and Supporting in the Zone , So im expecting Price moving to 1.28$ but in this way we have strong resistance too in 1.20 $ if this Area Break 1.28$ is more possible !
NOT FIANNCIAL ADVICE
GOOD LUCK

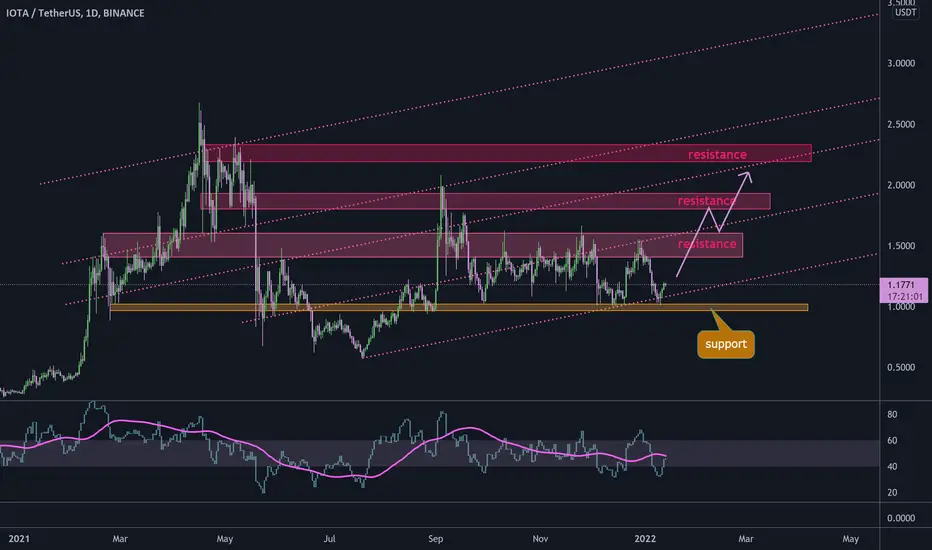
IOTA hold above support#IOTA/USDT
$IOTA hold above ascending support that is the same with support zone around $1.
now it will increase to touch first resistance zone between $1.4 and $1.6 that had sideway moves and touched it for long time.
break out from this resistance zone will head it up to nest resistance levels and trend lines.
LTCEUR - LongCurrently in a bullish triangle, confirming upside breakout from daily since mid-November start of a downtrend. Target is somewhere near the $190 mark if support holds. Once we close daily below $125 this idea is invalidated. Good luck trading!

IOTAUSDT ❕ keep falling The price breaks through the support. The global trend is downward. Below the level there is a free clean area up to support. I am waiting for the fall after fixing under the level. Target - 0.9614
