IOTA to 2.38?IOTA broke up this triangle 📐 and I think there is chance for run to 2.38 and even higher. Just bought at 1.63.
ENTRY : below local high @ 1.663
SL : local low @ 1.47
TARGET : height of the triangle projected from midpoint of the local range (LOCAL HIGH - SL) @ 2.38
RRR : 4.6
INVALIDATION : when SL level hit
Please like👍, comment🗣️, follow me✒️, enjoy📺!
⚠️Disclaimer: I'm not financial advisor. This is not a financial advice. Do your own due dilingence.
IOTA

$IOTA, Aiming for a new leg up above ~3800 sats$IOTA
On a very similar structure to what you can find in many other assets i.e REN
Aiming for a new leg up above ~3800 sats as continuation as its showing a HH/HL structure and now showing increasing volume again..
UCTS bullish across HTFs
Wait for it
#IOTA

IOTA - beautiful Cup & Handle pattern on the monthly chartA clean chart on the possibility of a Cup & Handle pattern, that could easily catapult Iota to > 6 USD from a technical perspective. A bullish wedge is supporting an upcoming bullish move while volume is dominated strongly by bulls on the Binance chart. I am aware that on some exchanges, Iota hit a much higher ATH, but this could be insignificant on the larger picture.
This is not financial advice. Happy trading!

IOTA/USDT SELL SIGNALhere is selling pressure accross the crypto market, which can send most coins along with the BTC down by 10% or more %.


🆓MIOTA (IOTA) Sep-15 #IOTA $IOTAIOTA is on the rise again and in the next few days it could surge to the 1.8 and 2.5$ zones. But if it loses 1.4$ zone then it will fall back to 1.2$ or even 0.9$ zone
📈BUY
🔴Buy : 1.47-1.53$
🔴Buy : 1.37-1.43$. SL if B
🔴Buy : 1.76-1.84$ if A. SL if B
📉SELL
🔴Sell : 1.76-1.84$. SL if A
🔴Sell : 2.44-2.56$. SL if A
♻️BACK-UP
🔵Sell : 1.37-1.43$ if B. SL if A
🔵Buy : 1.17-1.23$. SL if B
🔵Buy : 0.88-0.92$. SL if B
❓Details
📈Red Arrow : Main Direction as BUY and SELL section
📉Blue Arrow : Back-Up Direction as BACK-UP section
🟩Green zone : Support zone as BUY section
🟥Red zone : Resistance zone as SELL section
🅰️A : The Close price of 1-day candlestick is Above the zone
🅱️B : The Close price of 1-day candlestick is Below the zone

IOTAUSDT (4h Chart) - Trend Breakout!IOTAUSDT (4h Chart) Technical analysis
IOTA/USDT (4h Chart) Currently trading at $1.59
Buy level :Abow $1.57
Stop loss: Below $1.42
TP1: $1.77
TP2: $1.92
TP3: $2.12
Max Leverage 3x
Always keep Stop loss
Follow Our Tradingview Account for More Technical Analysis Updates, | Like, Share and Comment Your thoughts.


IOTA (MIOTA) - September 15Hello?
Welcome, traders.
By "following", you can always get new information quickly.
Please also click "Like".
Have a nice day.
-------------------------------------
(IOTAUSD 1W Chart)
If the price is maintained above the 0.57391761-0.70752520 range, we expect the uptrend to continue.
In particular, if the price is maintained above the 1.20630784-1.70386253 range, it is expected to create a new wave.
(1D chart)
We need to find support near the critical 1.40242016 point and see if we can continue the uptrend.
If it goes down, you should check to see if it finds support at the 1.07896204-1.20630784 zone.
If it falls in the range of 1.07896204-1.20630784, it may fall below the 0.79672550 point, so Stop Loss is required to preserve profit and loss.
If it moves above the 2.01140741 point and breaks out of the downtrend line, the uptrend is expected to accelerate.
It is important to be able to break through the resistance section formed in the 2.33397396-2.48227711 section strongly upward.
-------------------------------------
(IOTABTC 1W chart)
If the price maintains above the 2993 Satoshi point, it is expected to break out of the consolidation zone and turn into an uptrend.
However, in order to create a new wave, the price must rise above the 6200 Satoshi point to maintain the price.
(1D chart)
If support is found in the 3231 Satoshi-3524 Satoshi section, the uptrend is expected to continue.
If it goes down, we should see if it finds support at the 2993 Satoshi point.
If it falls from the 2993 Satoshi point, a short-term Stop Loss is required.
If it falls in the 1768 Satoshi-2061 Satoshi range, it may enter the mid- to long-term investment area, so careful trading is required.
------------------------------------------
We recommend that you trade with your average unit price.
This is because, if the price is below your average unit price, whether the price trend is in an upward trend or a downward trend, there is a high possibility that you will not be able to get a big profit due to the psychological burden.
The center of all trading starts with the average unit price at which you start trading.
If you ignore this, you may be trading in the wrong direction.
Therefore, it is important to find a way to lower the average unit price and adjust the proportion of the investment, ultimately allowing the funds corresponding to the profits to regenerate themselves.
------------------------------------------------------------ -------------------------------------------
** All indicators are lagging indicators.
Therefore, it is important to be aware that the indicator moves accordingly with the movement of price and volume.
However, for the sake of convenience, we are talking in reverse for the interpretation of the indicator.
** The MRHAB-O and MRHAB-B indicators used in the chart are indicators of our channel that have not yet been released.
(Because it is not public, you can use this chart without any restrictions by sharing this chart and copying and pasting the indicators.)
** The wRSI_SR indicator is an indicator created by adding settings and options to the existing Stochastic RSI indicator.
Therefore, the interpretation is the same as the traditional Stochastic RSI indicator. (K, D line -> R, S line)
** The OBV indicator was re-created by applying a formula to the DepthHouse Trading indicator, an indicator disclosed by oh92. (Thanks for this.)
** Support or resistance is based on the closing price of the 1D chart.
** All descriptions are for reference only and do not guarantee a profit or loss in investment.
(Short-term Stop Loss can be said to be a point where profit and loss can be preserved or additional entry can be made through split trading. It is a short-term investment perspective.)

IOTAUSD - falling wedgeBullish falling wedge on IOTA.
Resistance: 200MA-daily-line at 1.31USD
Just an idea.

IOTA/USDTMy notes for tracking my x3 leveraged iota long position.
First entry filled orders (%50 in total)
@1.6370 %15
@1.1620 %18
@1.6050 %17
Average : 1.6195
Expected second entry average: 1.1600
SL: 1.5219
TP: 1.8854
nfa

IOTA/USD Breaks Above $1IOTA / USD ANALYSIS
The IOTA price is trading bullishly and a breakout above the channel may trigger a rapid increase.
The daily chart reveals that IOTA/USD has now resumed the bullish continuation as the buyers gain control of the market. The 4.67% surge in volatility has leveled up the trading price at around the $0.96 resistance level. The MIOTA price is seen trading above the 9-day and 21-day moving averages.
Can MIOTA Price Keep the Uptrend?
According to the daily chart, the IOTA price has been increasing since July 21 and traders may see more climbs if the coin crosses above the upper boundary of the channel as the bulls are taking control of the market. On the downside, the 21-day moving average at $0.80 could provide support for a possible bearish retracement.
However, if the MIOTA price crosses below the moving averages, the coin may test the $0.72, $0.62, and $0.52 supports. As revealed on the Relative Strength Index (14), the signal line is crossing above 60-level and the current buying pressure is clearly revealed above this level. At the moment, we can say the MIOTA market is following a bullish scenario and the resistance levels are located at $1.20, $1.30, and $1.40.
IOTA/USD Market
Key Levels:
Resistance levels: $1.20, $1.30, $1.40
Support levels: $0.72, $0.62, $0.52
-For more chart analysis on the crypto market follow, and if you agree with this, like and share.

IOTAUSDT trend Resistance Line Breakout!IOTAUSDT (DAY CHART) Technical Analysis Update
Trend Resistance line Breakout
IOTA/USDT currently trading at $1.75
Buy-level: Above 1.75
Stop loss: Below $1.62
Target 1: $1.86
Target 2: $1.95
Target 3: $2.05
target 4: $2.25
Max Leverage: 3X
ALWAYS KEEP STOP LOSS...

IOTA is Ready!Cup and Handle Pattern almost finished for this coin.
They are currently building a distributed ledger technology for Europe. This could go parabolic in the upcoming months
I hope you found the idea interesting :)

IOTA Buy a break.IOTA - Intraday - We look to Buy a break of 2.112 (stop at 2.038)
We are trading at overbought extremes.
This provides an excellent risk/reward opportunity to fade the current bullish move.
A break of bespoke resistance at 2.100, and the move higher is already underway.
Our profit targets will be 2.334 and 2.389
Resistance: 2.100 / 2.200 / 2.300
Support: 2.000 / 1.900 / 1.800

IOTA - Trend-Following Setup!Hello everyone, if you like the idea, do not forget to support with a like and follow.
IOTA is overall bullish trading above the blue trendline, so as price approaches it, we will be looking for buy setups
Before we buy, we want the buyers to prove that they are taking over again.
You don't want to buy a bearish market right?
on M30: IOTA is forming a trendline in red but it is not valid yet, so we are waiting for a new swing high to form around it to consider it our trigger swing. (projection in purple)
Trigger => Waiting for that swing to form and then buy after a momentum candle close above it (gray zone)
Meanwhile, until the buy is activated, IOTA would be overall bearish can still trade lower.
Good luck!
All Strategies Are Good; If Managed Properly!
~Rich

IOTA formed bullish Gartley for upto 30% moveHi dear friends, hope you are well and welcome to the new trade setup of IOTA.
Previously we had a nice trade of IOTA:
Now on a 2 hourly time frame chart, IOTA has formed bullish Gartley.


IOTA TREND LINES PREDICTION...This is my prediction of IOTA. Everything is bullish, The price is still over the moving averages. That's enough to be sure.

IOTA / TetherUS Trending Up under High VolumeIOTA / TetherUS Trending Up under High Volume - IOTA is a cryptocurrency with its own blockchain. IOTA is a cryptocurrency, with a purpose for IoT (Internet of Things). It's build upon DAG (Directed acyclic graph), called Tangle. The Tangle ledger is able to settle transactions, with zero fees.

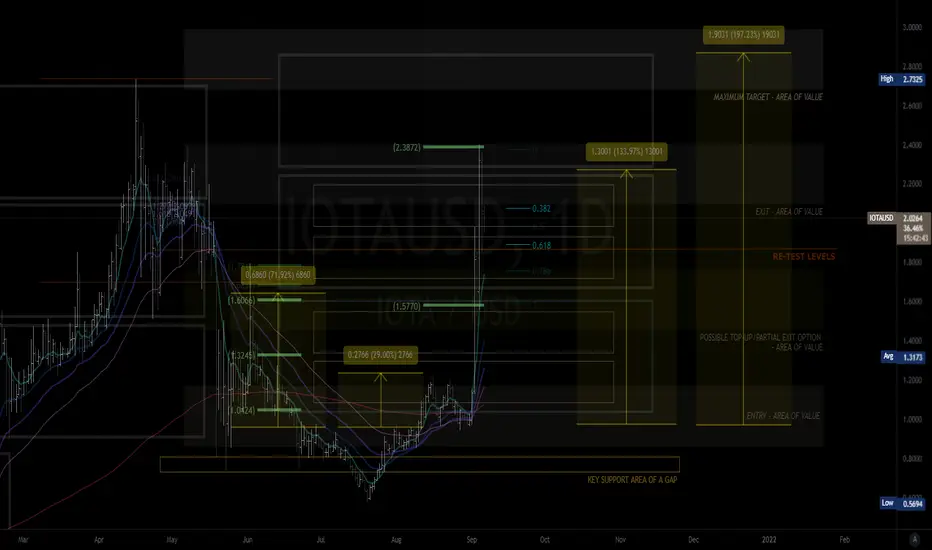
MY MINIMALIST CHART ANALYSIS 9.6.21
My Minimalist Analysis
CONGRATULATIONS! PARTIAL EXIT GUYS! BEEN A LONG WAY UP SINCE ENTRY. LOL!
Indicated are key levels of support and resistance using small and large range boxes TO ENTER A SWING TRADE (Short - Long).
Watch out for patterns, EMA, and your Fibs.
Further Analysis on price action is required on a 1HR-4HR chart when entering or closing a trade, depending on your risk appetite and trading style.
Disclaimer: The findings/predictions of the following analysis are the sole opinions of the publisher of this idea and should not be taken as investment advice.
If you like my published ideas and for more daily analysis, you can support my work by pressing the like and follow buttons on Trading View and Etoro Platforms.
Thank You for your appreciation and support.. www.tradingview.com
etoro.tw
IOTA pushing UPIOTA is currently witnessing profit-booking and it may drop to the first support at the 38.2% Fibonacci retracement level.
A strong rebound off this level will suggest that traders are buying on minor dips.
The bulls will then make one more attempt to push the price above $2.00 If they succeed, the pair could pick up momentum and rally toward $2.32 and then $2.63

IOTA Buy Valid BreakoutSignals:
Red -> Green
Yellow: Resistance above 2.0
DISCLAIMER
This is only a personal opinion and does NOT serve as investing NOR trading advice.
Please make your own decisions and be responsible for your own investing and trading Activities.
