BO, waiting retest to enter.The chart doesn't lie. BO of an important level of resistance, waiting to be retested and validating a secure entry as a support lvl. road to 1.7ish
IOTA

IOTA vs 4 years downtrend channelAs of writing, $8 million short positions are still open. Combine that with all the progress IF and the community are delivering, plus the latent realization of severe limitations in blockchain based DLTs (Cardano Smart Contract most recently) there is a good chance IOTA is switching into a steep uptrend channel after 4 years of misery.

$1.50 is the Signal?Matic could make big move once the $1.50 resistance is broken, which can happen very soon (after 3 weeks consolidating - very bullish). My longer term target is around $4. Holding Matic is definitely a low risk play with decent upside imo.

IOTA/USD:UPTREND|WAITING FOR NEW BULLISH IMPULSE|LONG🔔Welcome back Traders, Investors, and Community!
Check the Links on BIO and If you LIKE this analysis, Please support our Idea by hitting the LIKE 👍 button
Traders, if you like this idea or have your own opinion about it, please write your own in the comment box . We will be glad for this.
Feel free to request any pair/instrument analysis or ask any questions in the comment section below.
Have a Good Day Trading !

IOTA amazing profits after my call (results)IOTA / USDT
Iam sharing with you some of my results
all targets done today against USDT pair since sending this signal
Profits are running with 103.5% gains
See original signal below 👇

IOTABTC Technical Analysis
⏳ Spot
💎 IOTABTC after the breakout of the resistance will go for a retest and then again will go up. It may go to the Pullback zone before it goes up.
🏁 Short & Medium Term
💵 Invest Only 5% of your Portfolio
🎳 Entry at market or 0.00002135
☕️ TP1 0.00002420
🍺 TP2 0.00002470
🍻 TP3 0.00002525
🍾 TP4 0.00002590
🍷 TP5 0.00002990
🍸 TP6 ___________
🍹 TP7 ___________
🎁 TP8 ___________
🚫 SL 0.00001955
Good Luck 🎲
Check the Links in Description and If you LIKE this analysis, Please support our page and Ideas by hitting the LIKE 👍 button. ❤️ Your Support is really appreciated! ❤️
Traders, if you have your own opinion about it, please write your own in the comment box. We will be glad for this.
Feel free to request any pair/instrument analysis or ask any questions in the comment section below.
We will have more FREE forecasts in TradingView soon
Have a Profitable Day

IOTA|USDT🥳Hey hey my friends👋
IOTA is breaking out of a cup and handle long consolidation phase dont miss it
IOTABTC Wyckoff Accumulation Schematic - 2021-08-31 $IOTA Wyckoff accumulation schematic for IOTABTC
Bullish case
0.618 retracement is a high probability entry
Confluence with the trading range
NTA, DYOR

#BTCUSD - bearish outlookMid term / swing traders look for retracements. When everyone is mid-term bullish - it's probably a good signal to short, or at least to get out of the asset, especially after last weekly candle exposing weakening bullish sentiment.
The pitch-fork works usually until it doesn't. More crucial in this chart is rather the 200 weekly moving average, which presents statistically best long/asset entry according to value in relation to the last two hundred weeks of price action. If you're here for the money with long term trading outlook, it doesn't really matter how high will asset go, but rather where is the perfect entry from risk management perspective. When price is at top or near ATH (all time high) the financial trading risk is at it's peak. Everyone knows that without saying, nearly everyone ignores it without any logical explanation.
Technical indicators work on historical data... which not always can bring positive trading outcome.
From long term perspective it is irrelevant to disagree with fundamental properties of this asset, broadening understanding of technology explosively affects demand. The bigger the new crowd however, the more unpredictable is panic selling and so is the father of all bubbles - the FEAR OF MISSING OUT.
Be careful, be mindful, be successful by being patient.
Good luck trading,
Adam.

BTCUSD - not always bullish, but bullish foreverMid term / swing traders look for retracements. When everyone is mid-term bullish - it's probably a good signal to short, or at least to get out of the asset, especially after last weekly candle exposing weakening bullish sentiment.
The pitch-fork works usually until it doesn't. More crucial in this chart is rather the 200 weekly moving average, which presents statistically best long/asset entry according to value in relation to the last two hundred weeks of price action. If you're here for the money with long term trading outlook, it doesn't really matter how high will asset go, but rather where is the perfect entry from risk management perspective. When price is at top or near ATH (all time high) the financial trading risk is at it's peak. Everyone knows that without saying, nearly everyone ignores it without any logical explanation.
Technical indicators work on historical data... which not always can bring positive trading outcome.
From long term perspective it is irrelevant to disagree with fundamental properties of this asset, broadening understanding of technology explosively affects demand. The bigger the new crowd however, the more unpredictable is panic selling and so is the father of all bubbles - the FEAR OF MISSING OUT.
Be careful, be mindful, be successful by being patient.
Good luck trading,
Adam.

Descending triangle in a bullish trendPrice likely to drop further to as low as around $0.65. If we keep travelling sideways this is very bullish. As we're still very much in a bullish market trend, we should positively bounce out of the triangle and based on the 45 degree gann fan re test $2 sometime in Q2.

IOTA's Great Bullish Movement!Hi every One
IOTA / TETHERUS
IOTA/USDT is an ascending Triangle! This Means The Price has a Great chance to start a Good Bullish Movement soon! we just need to wait for a Break out to happen! note that the Price can Increase as much as the measured price movement (AB=CD)
summery:
-IOTA/USDT is in an ascending Triangle
-after the Break out The Price can Increase as much as the Measured Price movement (AB=CD)
💎Traders, if you liked this idea or have your opinion on it, write in the comments, We will be glad.
Thank you for seeing idea .
Have a nice day and Good luck

IOTAUSDT, a long term visionHello my friends, A multi timeframe analysis of IOTA and a long term vision for investment. The price broke a major resistance base band and now pullback. So you can consider it and the price actions in the circles to buy it. Good luck
If you like the idea, do not forget to support with a like and follow me for next analysis :)
Write your comment and opinion below for me

#BTCUSD - bearish outlookWe've been there before...
I believe 200 weekly MA has a serious role to play, please don't tell me it will never get tested.
I'm here for the money - not for tech.

#BTCUSD - bearish outlookWe've been there before...
I believe 200 weekly MA has a serious role to play and if you're unexperienced enough, please don't tell me it will never get tested.
Time will tell - I give assume we will see if this assumption is correct within next 52 weeks.
I'm out of bitcoin... since 50k.
I'm here for the money - not for tech.

Here we go again IOTA - IOTA/BTC 1wLong term extrapolation.
- Resistance/support zones: white areas
- Wave 3 target: 1.618 or 2.618 fib extension
- Elliott's parallel channel in blue.
Also, the price is on ichimoku kumo cloud support.

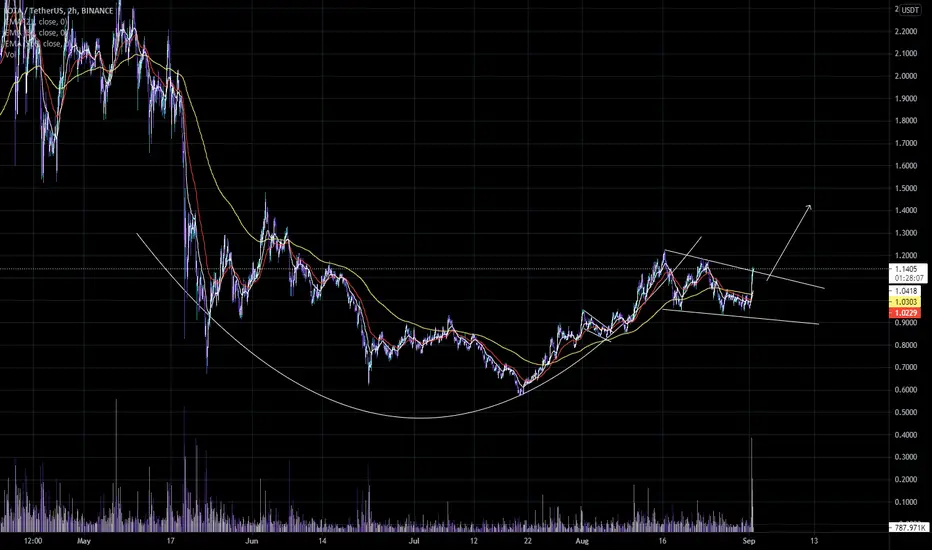
🆓MIOTA (IOTA) Aug-24 #IOTA $IOTAThe buying pressure at $1.1 has helped IOTA break out of the accumulation around this zone for the past few days and it is ready to move up to the $1.4, $1.6 and $1.9 zone in September. But if it loses the $1.1 zone, it will fall to the area of 0.9$
📈BUY
🔴Buy : 1.07-1.13$. SL if B
📉SELL
🔴Sell : 1.37-1.43$. SL if A
🔴Sell : 1.56-1.64$. SL if A
🔴Sell : 1.86-1.94$. SL if A
♻️BACK-UP
🔵Sell : 1.07-1.13$ if B. SL if A
🔵Buy : 0.88-0.92$. SL if B
❓Details
🕯Timeframe : 1 Day
📈Red Arrow : Main Direction as BUY and SELL section
📉Blue Arrow : Back-Up Direction as BACK-UP section
🟩Green zone : Support zone as BUY section
🟥Red zone : Resistance zone as SELL section
🅰️A : The Close price of candlestick is Above the zone
🅱️B : The Close price of candlestick is Below the zone

IOTA test the resistance as the support!IOTAUSDT break the trend line that was strong resistance and test it as a support, and I think it's a good opportunity to buy IOTA on the support.


Iota - USDT Every day starting with charting!1hr View
It has had a few good runs so have used it to day to mark out my support, resistance and trend lines.
Every day starting with charting!
Purple rectangle - 1 day
Yellow - 4hr
Green - 1 hr
IOTA kicked away from descending wedge and went bullish - Parallell Channel represents this.
Needs to break resistance at 1.05 - you could look to trade the channel and take it to 1.10
The next interesting session will be bouncing between 1.05 (if becomes support) and 1.10
If 1.10 becomes support 1.20 is the next point of resistance.
Feel free to pass on any feedback on my analysis.

IOTA - a little chance for another 400% price increase The IOTA price is coming up again and currently being traded at around 1.10USD/MIOTA. Many were calling for the start of a new bear market due to the recent price drop. However, even the drop to 0.57 USD is quite insignificant when looking at the larger picture. At the current new bottom at 0.57 USD IOTA still traded at a 1000% higher price than one and a half years ago.
Looking at technicals such as MACD and assuming we have the new bottom in, a bull flag could play out leading to a much higher price if we break-out to the upside in the coming months. Volume on the weekly is much more in the favor of the bulls. +400% seems surprisingly optimistic, but one should never underestimate momentum and many bears have been proven wrong in the recent past.
Therefore, let's put a bullish prediction on the table: 6 USD in a bit less than one year
This is not financial advice. Happy trading!
