IOTAUSDT been too greedy in a bear marketBeen overbought during Eth crash? welp
SL: 1.9136
TP: 2.2589
Simple as usual
IOTA

IOTA - The sleeping giantIOTA has a very healthy performance compared to other cryptocurrencies. Although the exponential growth is still missing here, the coin is developing slowly and steadily upwards. IOTA has a stable trend channel that withstands even major corrections in the crypto market.
Apart from the technical analysis, the IOTA project has a promising fundamental basis due to the many partnerships with large companies.
Of all the cryptocurrencies, IOTA is one of my favourite coins. Definitely long!


IOTA possible breakout imminent.IOTA hasn’t seen some crazy gains like most other alts did in this bull run. If a breakout happens, this could be a good entry point.
Good luck, and stay safe!
Not financial advice.


IOTA/USDT Binance (Trends/Levels)Looking at the trend and finding key support levels. I'm always bullish on IOTA. I'm thinking it surges for its next move to a key level at approx. 2.40 . DYOR . Not financial advice. If you have any thoughts please comment.

IOTA/USDT Binance (1hr) Updated IOTA smashing through key levels. Looking to break the 2.00 level and continue on to its next key level. Looking real good and bouncing. See you on the moon. Follow me for more chart TA ideas. Remember to DYOR. Not financial advice.
See you next time !

IOTAUSDT UPDATE!!!!Hi Traders,
IOTA is also looking good, tested the bottom of the formation and also looks like it was the last of the liquidity gathered on that last move down. Its already tested the top zone once but it could come back into it for prices to then break up through the formation.
As always if you enjoy the content don't forget to click the like button and make a comment on your opinion.
Thanks
MS
⬇️⬇️⬇️⬇️⬇️⬇️⬇️⬇️⬇️⬇️⬇️⬇️⬇️⬇️⬇️⬇️⬇️⬇️⬇️⬇️⬇️⬇️⬇️⬇️⬇️⬇️⬇️⬇️⬇️⬇️⬇️⬇️⬇️⬇️⬇️⬇️⬇️⬇️⬇️⬇️⬇️⬇️⬇️⬇️⬇️⬇️⬇️⬇️⬇️⬇️⬇️⬇️⬇️⬇️⬇️⬇️⬇️⬇️⬇️⬇️⬇️⬇️⬇️⬇️⬇️⬇️⬇️⬇️⬇️

IOTA/USDT Binance (2hrs) Observing levels on 2hrs frame. Looking very bullish ! My first of many charts. Follow me through my process ! Thank You

IOTAWednesday, 12 May 2021
16:16 PM (WIB)
IOTA is getting near to the support lines. I will purchase IOTA soon the price reach the support lines, with triple stop loss for long term investment.
Best regards,
RyodaBrainless
"Live to Ride and Ride to Live"

IotaUsdt_DEntry: 1.65 - 1.8
Resistance : 2.5
Target : 4
Time analysis shows it 'll reach 4 $ about 15 June.
No financial advice.

Last chance to board #IOTA $IOTA #MIOTA$IOTA #IOTA #MIOTA - Is at the last point of supply, before the inevitable happens, and new millionaires are made.
This is Wyckoff Theory. It's how large money moves a market to their will.
Don't fight large money, just ride their waves.
The next major wave from here is vertically up.
PS—preliminary support, where substantial buying begins to provide pronounced support after a prolonged down-move. Volume increases and price spread widens, signaling that the down-move may be approaching its end.
SC—selling climax, the point at which widening spread and selling pressure usually climaxes and heavy or panicky selling by the public is being absorbed by larger professional interests at or near a bottom. Often price will close well off the low in a SC, reflecting the buying by these large interests.
AR—automatic rally, which occurs because intense selling pressure has greatly diminished. A wave of buying easily pushes prices up; this is further fueled by short covering. The high of this rally will help define the upper boundary of an accumulation TR.
ST—secondary test, in which price revisits the area of the SC to test the supply/demand balance at these levels. If a bottom is to be confirmed, volume and price spread should be significantly diminished as the market approaches support in the area of the SC. It is common to have multiple STs after a SC.
Note: Springs or shakeouts usually occur late within a TR and allow the stock’s dominant players to make a definitive test of available supply before a markup campaign unfolds. A “spring” takes price below the low of the TR and then reverses to close within the TR; this action allows large interests to mislead the public about the future trend direction and to acquire additional shares at bargain prices. A terminal shakeout at the end of an accumulation TR is like a spring on steroids. Shakeouts may also occur once a price advance has started, with rapid downward movement intended to induce retail traders and investors in long positions to sell their shares to large operators. However, springs and terminal shakeouts are not required elements: Accumulation Schematic 1 depicts a spring, while Accumulation Schematic 2 shows a TR without a spring.
Test—Large operators always test the market for supply throughout a TR (e.g., STs and springs) and at key points during a price advance. If considerable supply emerges on a test, the market is often not ready to be marked up. A spring is often followed by one or more tests; a successful test (indicating that further price increases will follow) typically makes a higher low on lesser volume.
SOS—sign of strength, a price advance on increasing spread and relatively higher volume. Often a SOS takes place after a spring, validating the analyst’s interpretation of that prior action.
LPS—last point of support, the low point of a reaction or pullback after a SOS. Backing up to an LPS means a pullback to support that was formerly resistance, on diminished spread and volume. On some charts, there may be more than one LPS, despite the ostensibly singular precision of this term.
BU—“back-up”. This term is short-hand for a colorful metaphor coined by Robert Evans, one of the leading teachers of the Wyckoff method from the 1930s to the 1960s. Evans analogized the SOS to a “jump across the creek” of price resistance, and the “back up to the creek” represented both short-term profit-taking and a test for additional supply around the area of resistance. A back-up is a common structural element preceding a more substantial price mark-up, and can take on a variety of forms, including a simple pullback or a new TR at a higher level.

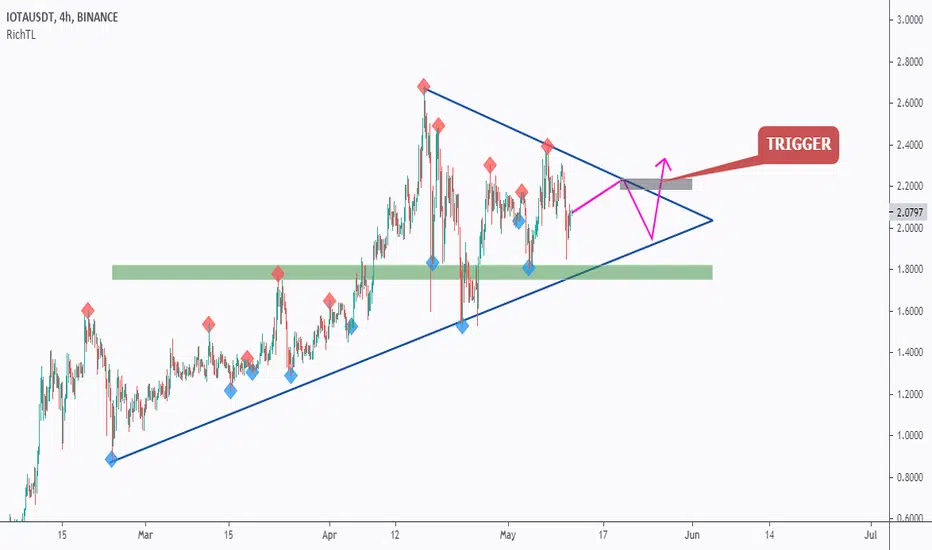
IOTA - Trend-Following Setup!Hello everyone, if you like the idea, do not forget to support with a like and follow.
I found IOTA chart interesting! ( H4 timeframe )
IOTA is overall bullish trading above the lower blue trendline.
However, now it is stuck inside a range in the shape of a symmetrical triangle. And every new candle is making the range even narrower.
Well as per the textbook, a symmetrical triangle is a bilateral pattern, which means it can be broken on either side.
I am looking to add IOTA to my portfolio, but before we buy, we want the buyers to prove that they are taking over.
As per my trading plan, I will be waiting for a new swing to form around the upper blue trendline, (projection in purple) to consider it valid then enter on its break upward. (gray zone)
And of course, as price approaches the lower blue trendline and green zone, we will also be looking for buy setups on lower timeframes. (short-term)
Good luck!
All Strategies Are Good; If Managed Properly!
~Rich
IOTA/BTCWhat a longer term call, but 1 target this time.
IOTA forms a beautiful Ascanding triangle above resistance after breaking and retesting it.
Monthly and weekly are looking good and the pattern has stayed nice during the BTC dump yesterday

IOTATuesday, 11 May 2021
15:05 PM (WIB)
IOTA has completed all structure in downtrend mode. It has fallen to 1. Fibonacci and rose to 0.236. Now the price at 0.786 and it seem will move higher from now.
Best regards,
RyodaBrainless
"Live to Ride and Ride to Live"

IOTA: You already know the rest of the storyIOTA has been accumulating for a while. We're approaching to the end of the symmetric triangle, which tells that price will follow previous movement again.
Its better to confirm triangle breakout and then open long position, target price is around 0.000052.


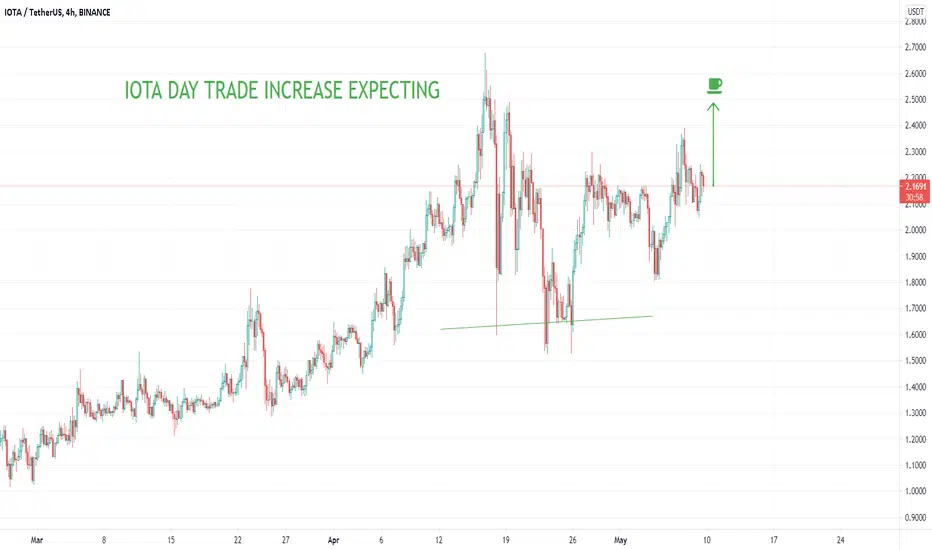
IOTA NEXT DAY TRADE INCREASE COIN / DAY TRADE INCREASE TRENDHello trading friends,
Iota looks to have a next increase trend depending on day trade °if bitcoin becomes stable, IOTA can be one of the best coins that can increase depending on-trend show.
Soon more about it.
IOTAUSDTHello to you all. Mars Signals team wishes you high profits at all times.
If we cross the resistance line, we will enter into a deal for the above purposes
But if green support is lost, which is unlikely, we can predict a decline
Warning: This is just a suggestion to you and we do not guarantee profits.
Wish you luck!

IOTA bullish ideaIOTA stands on MA and Ichimoku and continuing his bullish movement. I consider 3 targets with orange short-lines.

IOTA (MIOTA) - May 8Hello?
Dear traders, nice to meet you.
By "following" you can always get new information quickly.
Please also click "Like".
Have a good day.
-------------------------------------
(IOTAUSD 1W chart)
We have to see if we can ascend above the important point of 2.49603989.
(1D chart)
It remains to be seen if it can climb along the uptrend line and rise above the 2.49603989 point.
If it falls, it remains to be seen if it gains support in the 1.71207698-1.91239677 range.
If it falls at 1.55251884, a Stop Loss is required to preserve profit and loss.
However, careful trading is necessary as it can gain support and climb in the 1.12689452-1.29319710 range.
On the CCI-RC indicator, it remains to be seen whether the CCI line can rise above the EMA line.
If the CCI line falls below 100 points, volatility may occur, so careful trading is necessary.
-------------------------------------
(IOTABTC 1W chart)
We have to see if we can get support at the 3725 Satoshi point, which is an important point.
(1D chart)
3555 Satoshi-4221 You should watch for any movement that deviates from the Satoshi section.
In particular, it remains to be seen if it can gain support and ascend at the 3725 Satoshi point.
If it falls, we need to see if it can rise along the uptrend line.
2667 Satoshi-2889 If it falls in the Satoshi section, Stop Loss is required to preserve profit and loss.
--------------------------------------
It is advisable to trade at your average unit price.
This is because if the price flows below your average unit price, which was on an uptrend or downtrend, there is a high possibility that you will not be able to earn a large profit due to the psychological burden.
The center of every trade starts with the average unit price you start trading.
If you ignore this, you may be trading in the wrong direction.
Therefore, it is important to find a way to lower the average unit price and adjust the proportion of the investment, so that the money that ultimately corresponds to the profit can regenerate the profit.
-------------------------------------------------- -------------------------------------------
** All indicators are lagging indicators.
So, it's important to be aware that the indicator moves accordingly with the movement of price and volume.
Just for the sake of convenience, we are talking upside down for interpretation of the indicators.
** The wRSI_SR indicator is an indicator created by adding settings and options from the existing Stochastic RSI indicator.
Therefore, the interpretation is the same as the conventional stochastic RSI indicator. (K, D line -> R, S line)
** The OBV indicator was re-created by applying a formula to the DepthHouse Trading indicator, an indicator that oh92 disclosed. (Thank you for this.)
** Check support, resistance, and abbreviation points.
** Support or resistance is based on the closing price of the 1D chart.
** All explanations are for reference only and do not guarantee profit or loss on investment.
Explanation of abbreviations displayed on the chart
R: A point or section of resistance that requires a response to preserve profits
S-L: Stop Loss point or section
S: A point or segment that can be bought for profit generation as a support point or segment
(Short-term Stop Loss can be said to be a point where profits and losses can be preserved or additionally entered through installment transactions. It is a short-term investment perspective.)
GAP refers to the difference in prices that occurred when the stock market, CME, and BAKKT exchanges were closed because they do not trade 24 hours a day.
G1: Closing price when closed
G2: Cigar at the time of opening
(Example) Gap (G1-G2)

IOTA downtrend breakoutIota broke the downtrend and did the retest (downtrend breakout confirmation).
Target: U$3 (+31,5%)
