IOTATuesday, 27 April 2021
10:59 AM (WIB)
What is IOTA?
IOTA is the first distributed ledger built for the “Internet of Everything” - a network for exchanging value and data between humans and machines.
IOTA’s Tangle is an open, feeless and scalable distributed ledger, designed to support frictionless data and value transfer.
Next Generation Data and Value Exchange. New Economies and Possibilities.
No blocks. No Miners. When you send an IOTA transaction you validate two other transactions. This allows IOTA to overcome the cost and scalability limitations of blockchain.
The IOTA network is built to for the Internet of Things, with tamper-proof data, feeless micro transactions and low resource requirements.
IOTA is posed to play a central role in the next industrial revolution, enabling economic relationships between machines and bridging the human and machine economies.
The Tangle is IOTA's network. It immutably records the exchange of data and value. It ensures that the information is trustworthy and cannot be tampered with nor destroyed.
www.iota.org
Best regards,
RyodaBrainless
"Live to Ride and Ride to Live"
IOTA

IOTAUSDT Trendline breakoutIOTAUSDT (1H CHART) Technical Analysis Update
Trend line breakout
IOTA/USDT currently trading at $1.98
Buy-level: $1.92- $2.00
Stop loss: Below $1.80
Target 1: $2.15
Target 2: $2.28
Target 3: $2.45
Target 4: $2.60
Max Leverage: 2X
ALWAYS KEEP STOP LOSS...
Follow Our Tradingview Account for More Technical Analysis Updates, | Like, Share and Comment Your thoughts.

IOTA is a shark with a $6.5 targetshark harmonic pattern:
AB=0.38 XA
BC=1.6 AB
tp1=0.88 XA=$1.5
tp2=1.6 BC=$2
tp3=1.13 XA=$2.5
tp4=2.24 BC=$6.5
BTC/IOTA long-term resistance has become supportBTC/IOTA
Technical: Unfortunately, the pennant from the previous analysis broke to the downside while the entire crypto market fell sharply. When comparing Iota to Bitcoin, we have experienced a much stronger growth on Iota's side recently. We are bouncing off strongly from the support at 3500 Sat, which has been the resistance for almost 2 years now. Currently, the price is at 3700 Sat and moving upwards again. Bullish divergence could drive the price much higher while being support by 20-day EMA. Touching the new resistance at 4300 should be likely, if not breaking through in the coming weeks on the way to the next strong resistance at around 5400 Sat.
Total BTC Dominance is currently at around 50.5%. It could bounce here probably leading to another test of the new support at 3500 Sat.
Fundamental: The progress of the Iota Ecosystem is astounding. Chrysalis part 2, NFTs and Smart Contracts will enable endless use-cases combined with a zero-fee environment. The energy consumption of Iota is by far less than what it takes to transact Bitcoin - around 5 million transactions one could do for the same energy it consumes for a Bitcoin transaction right now (1 Iota transaction uses 0.112Wh). The confirmed TX after the Chrysalis update can reach 1000+ TPS. Furthermore, since the supply of tokens does not increase as it does for most other coins which have miners, we could soon reach a stage in which price keeps going up, regardless of the correlation with Bitcoin. The demand will increase exponentially, once we see Iota being used to send data & pay in the m2m economy.
This is no trading advice.
Good luck!

IOTAUSD BUY/HOLD #BLESSEDPIPS After a strong sell to start the week, the cryptos now look like they are ready for the next bull run.
IOTAUSD is one of the best pairs a see with a long term consolidation period that it is ready to break out of.
BUY/HOLD from this entry.
#BLESSEDPIPS

MIOTA Took Support At $1.55, Now Heading Towards $2.50IOTA price traded at $1.70 with a loss of 15.48% in the last 24-hour and 28.69% in the weekly time-frame. Furthermore, IOTA price bounced from the support of $1.55. In contrast, the market capitalization stands at $4.81 billion. Technically, investors can perceive a negative crossover in the EMA for a short while, and the price is below the 55-EMA. RSI index showcases an upward slope. Moreover, the price movement can be towards the resistance of $2.50 in future trading sessions.
Resistance: $2.50
Support: $1.55

IOTA - pennant formation leading to 3.2 USD?Technical: Iota is forming a pennant clearly visible on the 4-hour chart. This indicates in most cases a continuation move which could lead us to 3.2 USD. It may seem irrational, but taking into consideration what happened during the last weeks I think it is possible. MA-120 and MA-250 are providing great support. I would only reject this hypothesis, if we break through the MA-250 and close below.
Fundamental: The progress of the Iota Ecosystem is astounding. Chrysalis part 2, NFTs and Smart Contracts will enable endless use-cases combined with a zero-fee environment. Since the supply of tokens does not increase as it does for most other coins which have miners, we could soon reach a stage in which price keeps going up, regardless of the correlation with Bitcoin . The demand will increase exponentially, once we see Iota being used to send data & pay in the m2m economy.
This is no trading advice.
Good luck!

IOTA 1.6000 Support HoldingWhat a crash on Sunday! IOTA crashed by 40% in an hour on Sunday night. Here are the main scenrio that could happen next for IOTA

IOTAUSDT Hello to you all. Mars Signals team wishes you high profits at all times.
The price in a bullish triangle penetrates into the triangle immediately after falling and if it breaks upwards, there is a possibility of a price increase.
Warning: This is just a suggestion to you and we do not guarantee profits.
Wish you luck!

IOTA - Easy longPrice recently broke above the diagonal resistance and is showing a clear trend (higher highs, higher lows).
This should be an easy long to 2.45 - 2.55

IOTA (MIOTA) - April 19Hello?
Dear traders, nice to meet you.
By "following" you can always get new information quickly.
Please also click "Like".
Have a good day.
----------------------------------
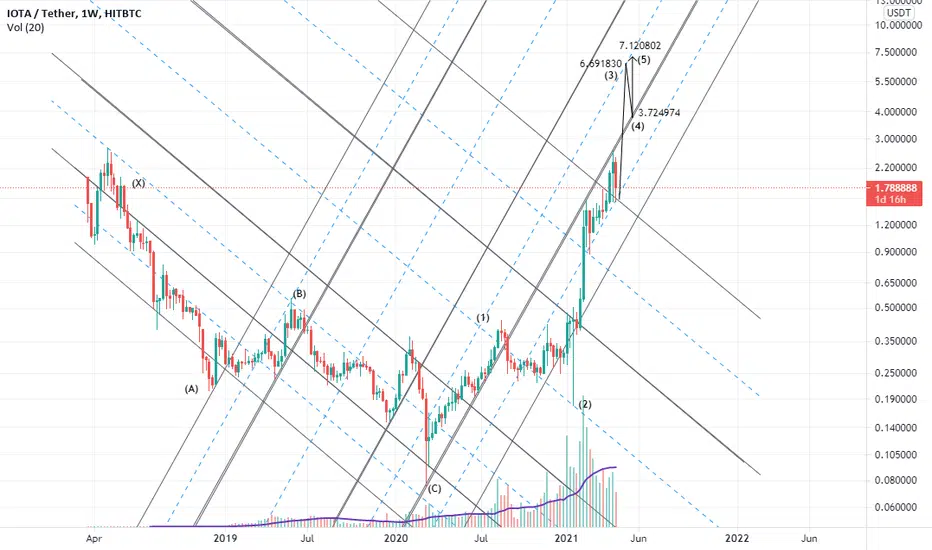
(IOTAUSD 1W chart)
(1D chart)
You should watch for any movement that deviates from the 2.18657391-2.41735783 section.
If you go down at 2.03351702, you need a short stop loss.
However, it may rise along the uptrend line, so careful trading is necessary.
It remains to be seen if the uptrend can continue, breaking above the critical point of 2.49603989.
The next volatility period is around April 23rd.
-----------------------------------
(IOTABTC 1D chart)
We must see if we can rise above the 4221 Satoshi point and gain support.
If it falls, it remains to be seen if it can gain support at the 3555 Satoshi spot and move up along the uptrend line.
-------------------------------------------------- -------------------------------------------
** All indicators are lagging indicators.
So, it's important to be aware that the indicator moves accordingly with the movement of price and volume.
Just for convenience, we are talking upside down for interpretation of the indicators.
** The wRSI_SR indicator is an indicator created by adding settings and options from the existing Stochastic RSI indicator.
Therefore, the interpretation is the same as the conventional stochastic RSI indicator. (K, D line -> R, S line)
** The OBV indicator was re-created by applying a formula to the DepthHouse Trading indicator, an indicator that oh92 disclosed. (Thank you for this.)
** Check support, resistance, and abbreviation points.
** Support or resistance is based on the closing price of the 1D chart.
** All explanations are for reference only and do not guarantee profit or loss on investment.
Explanation of abbreviations displayed on the chart
R: A point or section of resistance that requires a response to preserve profits
S-L: Stop Loss point or section
S: A point or segment that can be bought for profit generation as a support point or segment
(Short-term Stop Loss can be said to be a point where profits and losses can be preserved or additionally entered through installment transactions. It is a short-term investment perspective.)
GAP refers to the difference in prices that occurred when the stock market, CME, and BAKKT exchanges were closed because they do not trade 24 hours a day.
G1: Closing price when closed
G2: Cigar at the time of opening
(Example) Gap (G1-G2)

Bullish 4hr Divergence on IOTAIOTA have their biggest ever upgrade (Chrysalis) starting on the 21st and completing on the 28th. Expecting the bullish trend to continue.

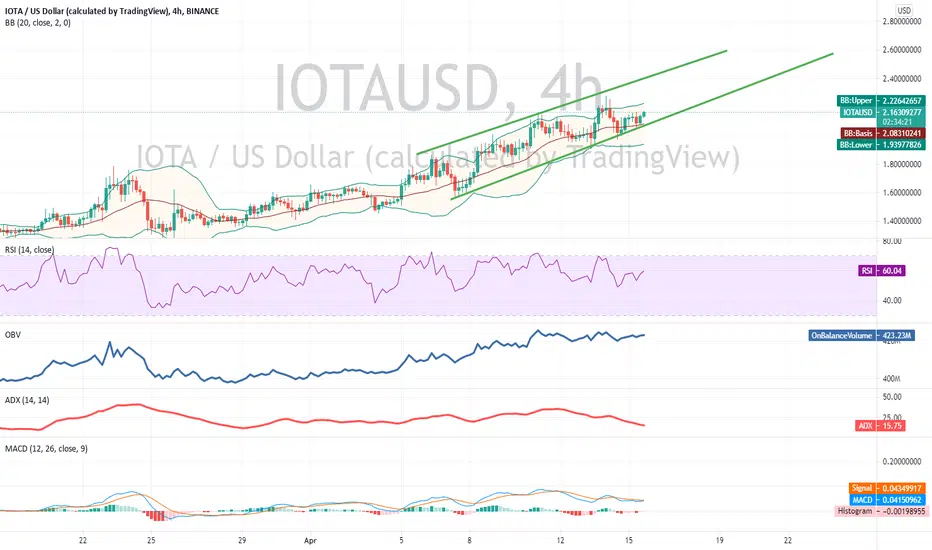
IOTA - buyers are strong below 2 USD, do not panic sell hereTechnical:
Our target at 2.18 USD has been reached and price overextended to 2.7 USD. Right now we are witnessing a huge sell-off (-40% at peak), mainly triggered by a chain reaction of margin longs being liquidated. At the moment we are finding support at the prior resistance line around 1.9 USD. BB Mid is at 1.88 enhancing this level. From here on I am placing buy-orders down to 1.60 to potentially leverage a few more spikes to the lower support line. Personally, I would not panic sell here as a second and potentially third drop should not be that strong. These are buy levels.
Fundamental:
The progress of the Iota Ecosystem is astounding. Chrysalis part 2, NFTs and Smart Contracts will enable endless use-cases combined with a zero-fee environment. Since the supply of tokens does not increase as it does for most other coins which have miners, we could soon reach a stage in which price keeps going up, regardless of the correlation with Bitcoin . The demand will increase exponentially, once we see Iota being used to send data & pay in the m2m economy.
This is no trading advice.
Good luck!

IOTA USDJust going to hold my trade-long here as long as the parabol supports us and if we rocket on the first one I am going to look the 2nd one for later to buy back.

IOTA at important long-term resistance#IOTA - Look on this weekly $IOTA Chart - we are reaching an important long term resistance now. As soon as we reach a very important long-term resistance, the price drops. We need a takeover of this level at $2.81 to start heading to the ATH.

IOTA TRADE SETUP / IOTAUSDT1- CONSIDER STOP LOSS
2 - this idea does not mention TIME, ONLY the price movement is analyzed
3- this is only a technical analysis not a prediction
4- its easy to be wise after the EVENT
5- happy trading

MIOTA Breaks Above $1.50 After Chrysalis UpgradeIOTA Price traded at $2.12 with a loss of 0.34% in the last 24-hour and 25.07% up in the weekly time-frame. Furthermore, IOTA bounced from the support of $1.50. In contrast, the market capitalization stands at $5 billion. Technically, investors can perceive a positive crossover in the EMA, and the price is sustaining above all the EMA. RSI index showcases an upward slope. Moreover, the price movement can be towards the resistance of $2.50 in future trading sessions.
Resistance: $2.50
Support: $1.85


👀🧐If one or 2 candle close above resistance ,after poolback on it u can buy it,i think with the news of update it have a good move ,lets see what happen🍻

IOTAUSDT [FUTURES] [30M] BREAKOUT OF MINI TREND 🔥🔥IOTAUSDT BREAKOUT OF MINI TREND 🔥🔥
NOW IOTA IS BREAKING OUT OF TRENDELINE LOOKING FOR UNTILL PULLDOWN HITTING OUTSIDE OLD TRENDLINE ZONE THAT IS LOKKING FOR BUY POSITION
Looking more forcast every week on my youtube find on my profile
GOODLUCK
TON TRADER
🔥🔥🔥🔥🔥🔥🙏🙏🙏🙏🙏🙏

IOTA 140 $ LONG TERMIs IOTA 140 dollar price target crazy to call ?
No , just by reading the chart it's easy what it did at the bottom; a 10 x and it will be more epic when it will be forming the U-form and do back a 10 x.
Do you think I am crazy or just realistic view ?
I would like to read your comments and to hear from you.
Peace
