IOTA The Next Alt to Push??IOTA is coming very close to satisfying a lot of our requirements for an entry.
Although, on the daily our steamroller indicator telling us she wants to cool off slightly before another potential move up.
Very close to a break of this kumo cloud and the 50 where she'll have room for at least 10% IMO.
Not a tonne of daily volume coming in, but very similar to a number of other alts that saw sudden explosions of volume and volatile moves.
Overall, i'm expecting some moves up in the coming days after this potential cool-off.
IOTA


Target in the long-term Resistance line.Hello, traders.
IOT/USD is above a short term uptrend line since march, and after the price broked an important resistance level the chart begging to present a bullish structure. But we are reaching the long-term resistance line which, will be a very significant resistance for IOTA.
The target is the resistance line, so it's not time to buy this asset.
Please push like button and follow us on tradingview.

IOTA - Possible scenarioNever expect guaranteed result's - it's always speculation.
1. Risk management,
2. Strategy,
3. Execution.

IOTA living of BTC's weaknessBTC.D free fall and bounce of the ichi cloud helping IOTA live longer, but it is running on fumes. Racking up multiple bearish divergences on the 4H and Daily and testing multiple resistance while volume dropping. Retesting the bear flag that it broke out of in June. Another chance to unload if you got caught in this.

IOTA: Uptrend and How to Join ItThe price bounced from SMA200, and it was a possible buy signal based on the reversal. Now that long positions give profit. What's next?
It is possible to add more volume and open a new long position if the price breaks 0.2600 resistance.
It will be a good bullish signal as the market confirms the uptrend by a new swing high.
In order to get an additional signal that the price is going to move upward, it will be a good idea to wait for a retest of the broken resistance. If the price can stay about this level, which will act as new support, we will be able to buy using the reversal signal. This bullish signal will be more reliable than just the breakout.
Stop orders for all long positions should be placed below the local swing low and SMAs. The main profit target for buyers should be 0.3500 resistance. Risk per trade must be no more than 3-5% from the capital.
P.S. as I don't use like-bots and other solutions that show great "interest" to my posts, I will be grateful if you support my work by your LIKEs and comment. Of course, if you can do it. The feedback from REAL people is priceless!
Disclaimer!
This post does not provide financial advice. It is for educational purposes only! You can use the information from the post to make your own trading plan for the market. But you must do your own research and use it as the priority. Trading is risky, and it is not suitable for everyone. Only you can be responsible for your trading.

IOTA-USDT using TSSL Follows the Settings
BUY LEVEL 0.1
GAIN 1.2
BUY_RANGE 0.6
SELL_RANGE 0.6
EMA1 8
EMA2 16

IOTA/BTC, breakout, 50-250% potential moveMy first target is the yellow MA (100 WMA). I AM NOT A FINANCIAL ADVISER, DO YOUR OWN RESEARCH!

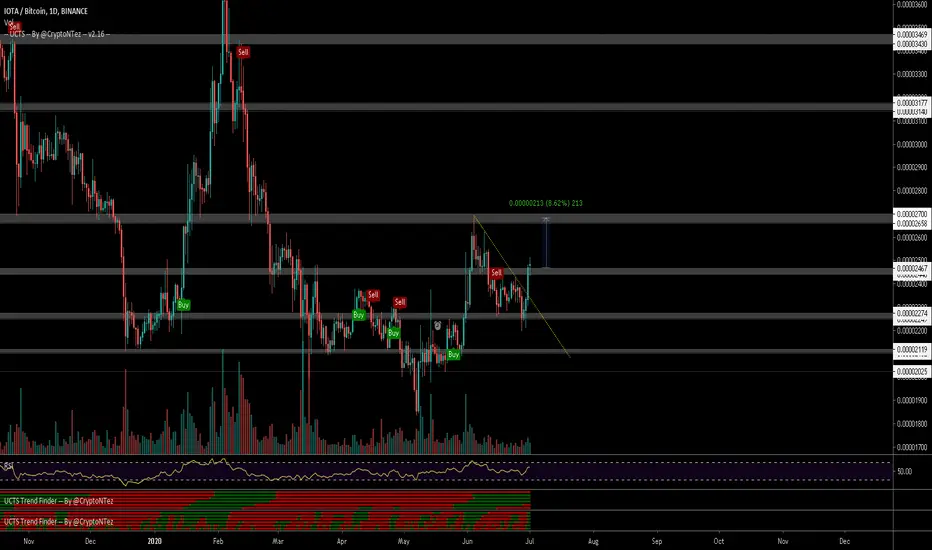
$IOTA, Pushing above ~2400 sats level w/ UCTS Buy signal $IOTA
Pushing above ~2400 sats level w/ UCTS Buy signal flashing on the daily (Doji..)
12H timeframe trying to flip this level into support & also showing a buy...
Volume is not THAT atractive yet but could be a posibility riding toward ~2700 (8%+)
#IOTA
IOTA still under exponential decay, perfect short entryThat sorry coin is dying slowly, it dropped below its longterm support, climbed over it to drop below it again and was rejected on the retest. In technical terms this is a perfect short entry. And while other Alts achieved higher highs in this mini Alts season, IOTA only mustered a lower high. This week it is flirting with the ichi cloud most probably to be rejected.
To all IOTA scammers and cultists, the more you attack me ad hominen, the more i put up ideas on this shitcoin, exposing you.

IOTA in trouble Dropped out of the ascending blue channel was supported by the Ichimoku cloud, retested blue channel. RSI falling wedge points further downside.

Iota price prediction Did I told you guys, didn’t I?
You can see how the candles are following my trend line..there are huge potentials to happen a crash near the .10 area and maybe less.
The weekly chart is appearing promising for shorting iota ,but do not underestimate the power of bulls
Keep trading with caution
Happy trading
Write your comments bellow either you agree or not
Thank you very much

Fibonacci correction in the region of 55 to 65%Fibonacci correction in the region of 55 to 65%
Declining MACD, uptrend
Ascending MACD, downward price, moving average moving 50
Upward RSI, downward price, moving average moving 50

IOTA, breakdown from bear flagRetest and rejection at confluence of resistances with bearish divergence. Last change to unload before it goes to zero.


Last move down from the top looks like an impulse on IOTAWe are probably in the C wave of an ABC correction to the upside.


IOTA Looks PromisingIf this pivot low can hold as support, we should see bullish price action. Watching with eagerness.

Regular Bullish Divergence on weekly. Invest 1%, SL @5% loss.Regular divergence is the classic sense of divergence that occurs when the price action makes higher highs or lower lows while the oscillating indicator does not. This indicates a weakness in the price action and anearly warning that the trend could be coming to an end. In other words, regular divergence indicates that a probable trend reversal could occur through it does not indicated when this will occur. For this reason chartists often turn to trend lines, chart patterns and candlestick patterns to time the entry into the trade.
Regular divergence can be either positive (bullish) or negative (bearish).
Positive Divergence is bullish and occurs in a down trend when the price action prints lower lows that are not confirmed by the oscillating indicator. This indicates a weakness in the down trend as selling is less urgent or buyers are emerging. When the oscillator fails to confirm the lower lows on the price action, it can either makes higher lows, which is more significant, or it can make double or triple bottoms. The latter occurs more often on oscillators, such as RSI and Stochastics that are range bound and less often on oscillators such as MACD and CCI that are not range bound.
Negative Divergence is bearish occurs in an uptrend when the price action makes higher highs that are not confirmed by the oscillating indicator. This indicates a weakness in the uptrend as buying is less intense and selling or profit taking is increasing. As with positive divergence, the oscillator can fail to confirm the higher highs on the price action by either making lower highs, which is more significant, or by making double or triple tops. As with positive divergence, double and triple tops are more prevalent on range bound oscillators.
As you can see Dash from time to time gathers explosive characteristics.
As per fundamentals - top privacy coin with a very small supply.
Invest 100 ETH & if successful you've got at :
T1 - 160.0 ETH
T2 - 207.00 ETH
T3 - 267.00 ETH
Possible allowed loss on this trade = 5% of invested capital.

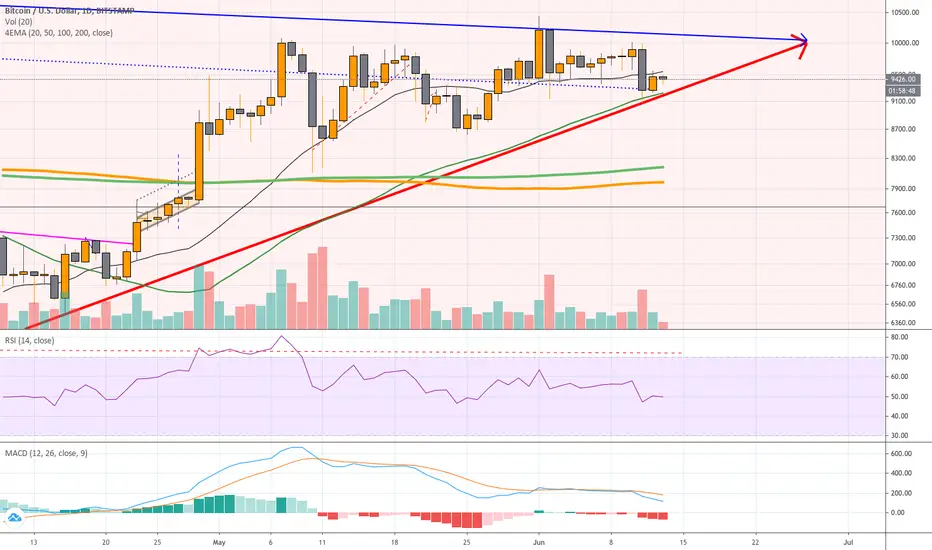
No reason to be bearishBullish trend line since March 17 is still intact. Let's allow our runners RUN.

IOTAUSD: If you want to moon, trendline to HOLDIt is important for longterm that the possible recovery angle stays identical for healthy growth. Play the support, for and against. :)

By end ofJune we'll know what's coming.Current range is tight.
Future : If broken below the thick red - we're bearish. If above continuous blue - we're bullish.
Present : We're above significant moving averages - bullish.