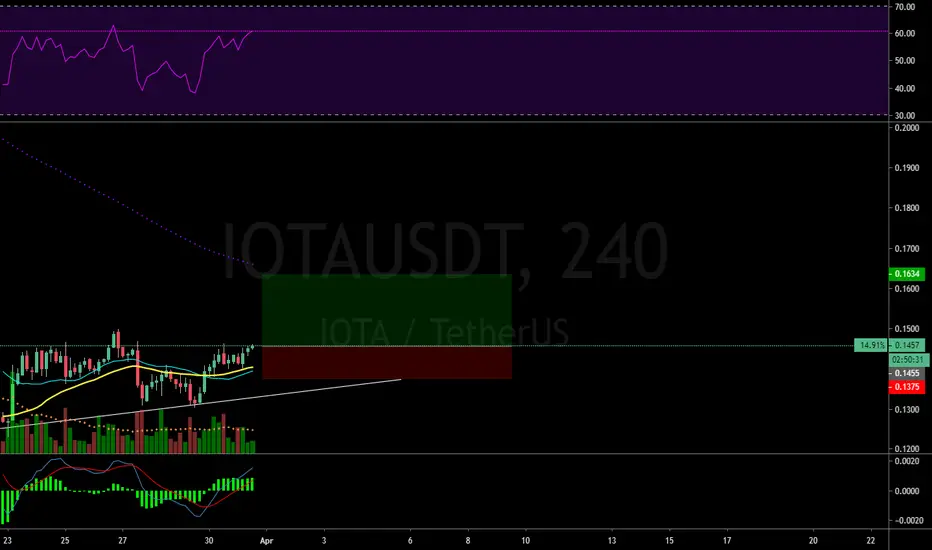
Iota is setting up for a runTest of SMA 200 is very possible. Stoploss is below SMA 20.
Trade is active. Good luck
IOTA
IOTA/USD - you shouldn't buy under a moving average.you shouldn't buy under a moving average.
buy at this level
waiting for movement from Bitcoin and the other ALTs.


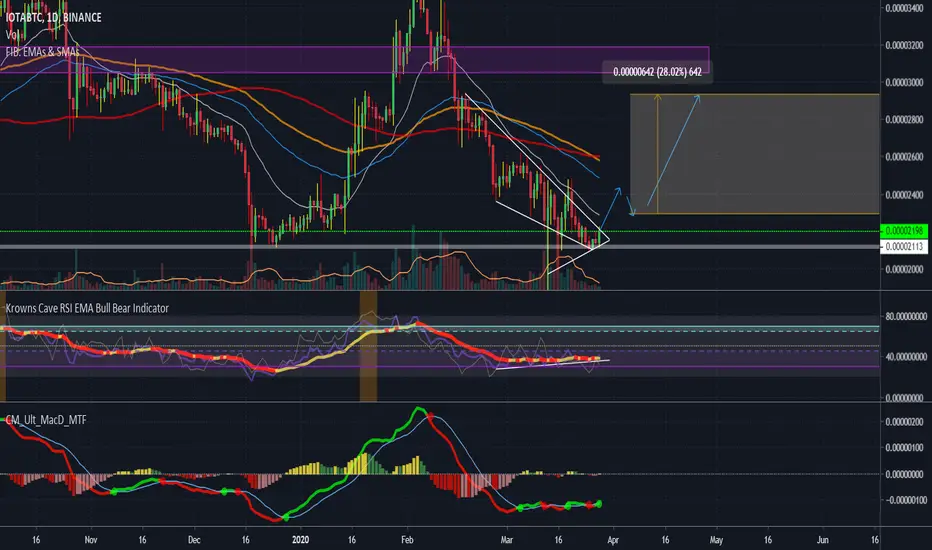
IOTA/BTC short term downtrend line brokenHello traders,
Here is a simple and quicly analyses for IOTA/BTC witch seems to be broken the short term resistance line after reversion on important support level.
PLease push like button and follow us on trading view.

Looking for a few more days of accumulation; Bullish attitude I am no expert; But when world markets are acting the way they are i think we have a lot to look forward to when it comes to FREE AND FEE LESS transactions and the IOT economy is being built with IOTA like concepts. Feeling bullish in a bearish suit.

Iota Can Hit The Support Again Before The Next Move UpOn December 3rd 2019 I posted an article and on that post I revealed that the priceline of Iota had formed a big bullish butterfly pattern on weekly char. At that time the price action was just entered in the potential reversal zone of that pattern. And as per Fibonacci sequence of bullish butterfly it was expected that the priceline will take the bullish divergence from the PRZ level atleast up to the Fibonacci projection of A to D leg from 0.382 to 0.786 Fib projection level. And finally in very next month January 2020 the price action took a powerful bullish divergence and produced more than 119% bullish rally and moved down again. This time the Iota has even broken down the potential reversal zone of this bullish butterfly.
Falling wedge and volume profile based move:
We can also observe that on weekly chart the priceline of Iota is moving in a falling wedge and after this recent drop the price action has hit the support of this falling wedge. Even though the bollinger bands was above the support and there was a little bit distance between the lower bands of bollinger bands and the support of the falling wedge but the bearish trend was very strong therefore the the candlesticks has hit even beyond the support of this wedge and retraced back into the bollinger bands. If we place the volume profile on the complete price action moving within this wedge then we can see that the trader’s interest is very low below $0.115 and above $0.42. And the volume profile’s point of control is at $0.28. Therefore there are strong chances that whenever the priceline will be moved down than the area where the traders has low interest of trading then it will move up again at least up to the point of control of the volume profile. This is very positive sign traders don’t have interest upto the support.
Bullish Crab pattern a bullish reversal signal:
Now if we switch to the smaller time period and that is 2 day chart then we can see at the support of falling wedge the priceline of Iota has formed a complete a bullish crab pattern. The priceline has hit the just a spike in the potential reversal zone of this pattern and turned bullish. As per Fibonacci sequence the Crab pattern the price action was suppose to hit at least 0.382 to 0.786 Fib projection of A to D leg. And the candlesticks has already hit this zone. But I am expecting that the priceline will again give us another chance to catch it from the potential reversal zone and it will again turn bullish and start a proper bullish rally that can lead the priceline to hit the resistance of the falling wedge that has been formed on weekly chart.
The potential reversal zone starts from $0.09 goes up to $0.119 but because we have a strong support of falling wedge therefore we can have another spike up to 9 cents or little bit more. But it will be very much difficult for the price action to break down the support and move up to the maximum extent of this potential reversal zone.
100 simple moving average support:
And now if we switch to the more smaller time period chart and that is 4 hour chart then it can be clearly observed that the priceline is moving around the 100 simple moving average at this time. We also examine that the candlesticks are moving above this simple moving average and 100 SMA is holding the price action. Therefore I am expecting if the Iota will break down this 100 simple moving average support then it can again enter in the potential reversal zone or buying zone of the Crab pattern that has been formed on 2 days chart.
Conclusion:
On midterm the priceline can move down to reach that support again and after hitting the support Iota can turn very strong bullish to make another attempt to breakout the resistance on long term.
And If it will be able to breakout from resistance then more powerful bullish rally can be started.
Note: This idea is education purpose only and not intended to be investment advise, please seek a duly licensed professional and do you own research before any investment.


Has IOTA bottomed?Potential rebound. Why?
- Closed above support
- MACD crossover
- RSI divergence
- Triangle & desc. wedge pattern
Wouldn't enter a long unless some MA's cross but has potential if:
- Close above 21 day ema
- Volume increases
- RSI closes above 50

Take it for what it is Going Long Just a few Overlays with current markets my -8% buy orders got filled . #IOTA has a bright future still going long and DCA till the stage is set.

IOTA LONG | TARGET DLY 0.38 FIBO LEVELThis is a Price Action Analysis.
As you can see Iota react to the Buy Area (Key Level - Previously Resistance become a Support)
STOP LOSS 12.20
TAKE PROFIT AREA - DAILY FIBO LEVEL 0.38.
Risk Reward Ratio can be 4 times bigger.
Tap a LIKE if you think is a useful idea and comment below!
Please do your own research, and follow your trading plan with a properly Money Management.

Iota / Eth Buying comes1D chart looks Good
Successfully breakout
Buying range 0.00100 to 0.00105
Sell when you Satisfy
Good luck comment below what you think and share your ideas Thanks


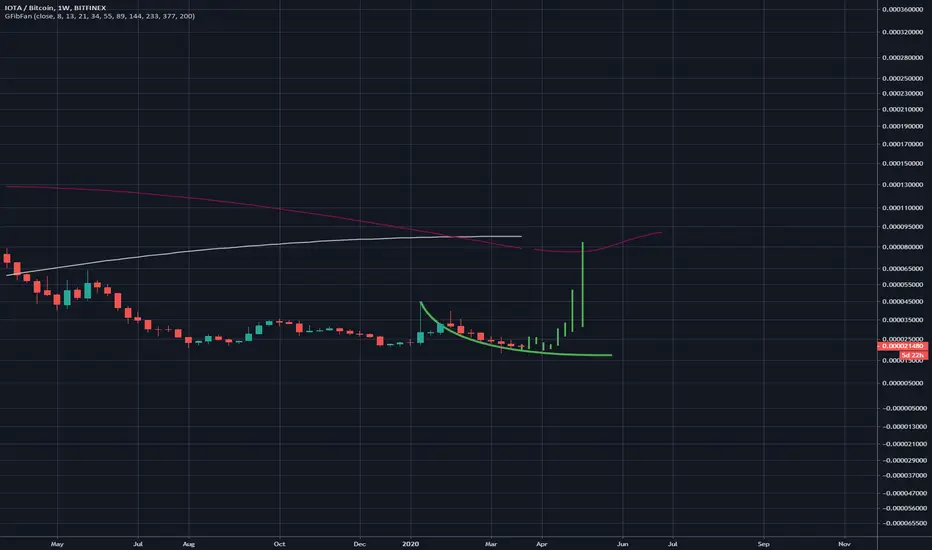
IOTA descending scallopIOTA has formed a descending scallop this is a bullish reversal pattern, weekly chart. Random fractal for PT at grey MA line, could go much higher although..
IOTA (IOTAUSDT) short.All description on the chart.
Please, don't forget to like and follow.
Thank you.

IOTA/USD - The triangle has not yet been fully worked out.The triangle has not yet been fully worked out.
the breakdown and the test was, and now I'm waiting for the next movement...
I'll put 1% of the deposit into the deal.
Friends, thanks for your likes and comments!
Good luck with trading!

IOTABTC | Skyrocket is ready for a tripAt 2H timeframe we see a low risk and high potential entry for IOTABTC position.
There is a channels breakout intersection with a very strong bullish signals according to RSI bands and Stoch Relative strength oversold status. Volatility increases while momentum grows which indicates the beginning of a sharp uptrend.
In case it happens we will have a completed Inverse Head and Shoulders pattern on a macro downtrend which will act like a trend shit pivot point
Premium signals is already in the channel

IOTA/BTC trading updateHello trader,
This is an update of our analyses on IOTA/BTC, we see the green box as a buying area, now the price just reverted on important support level and is showing us a bullish momentum, our objective is the next important Resistance.
Please, push like button and follow us on tradingview.


Bullish until 6'th of JuneAt present there's two important lines on Bitcoin vs Us Dollar chart - both long term. There is no point a looking at 1H, 4H if you don't consider trend direction. IF this support line holds - we are building really explosive bullish pennant. Few months ago I said a lot of people will sell to early. I am actually surprised seeing Alessio Rastani (respect) saying on YouTube that he's out. Well - we all have different approach. I have 2 simple rules above all others rules I have. 1. Don't trust anyone, 2. Never sell below profit. You might find it primitive - but with appropriate position sizing and more importantly PATIENCE in trading Bitcoin - until now it always worked out for me. We are now touching THE LINE - all of the theories are based on it - All the Nike charts you ever seen are based on it. I think it's too strong to fail. If we go 1k below current levels - we will be able to say we started a LONG bear market with Bitcoin... and I'm out looking to long SPX. Trade safe guys and don't listen to me- I'm VERY MUCH OVER-EXPOSED to BTC atm.
