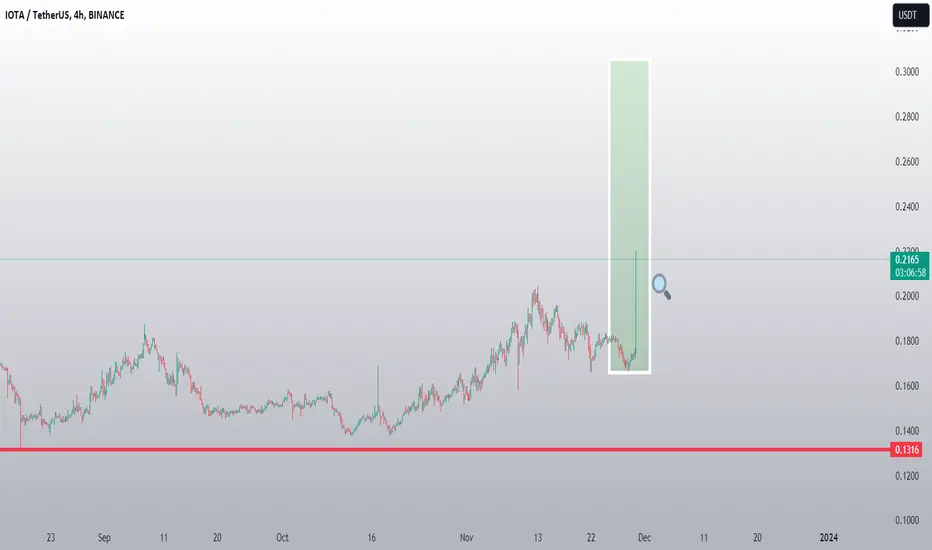
IOTA/USDT Keep an eye, If breakout is success, Back to upward!💎 IOTA has recently displayed significant market dynamics. Currently, IOTA remains in a sideways trend after reclaiming the demand area.
💎 There are two potential scenarios: either IOTA breaks out of the bullish flag pattern without retesting the demand area, or it undergoes a retesting phase before breaking the pattern.
💎 In the event of a successful breakout, we could witness a significant upward movement, probability leading to a retest of our target strong resistance area.
💎 However, if IOTA retraces back to the demand area at $0.23 - $0.22 and breaks below it, the price may resume its downward movement. The next key level of support would be tested, and if it fails to hold, the price could decline further. In such a scenario, IOTA might revisit the strong support area for potential stabilization.
IOTA

IOTA/USD Cycle Analysis IOTA/USD Cycle Analysi s
✨I've divided the periods on Iota into 8 parts.
It's clearer with the colours.
We seem to be experiencing a repeat of the same.
✨The first downtrend on Iota lasts 812 days.
The peak we're seeing now is 910 days past the peak.
1> bottom 🎈
3> TOP
6> Basis Line
7> Purple Curve
8>Last section 🧨
🎃 In the first place, I now expect the decline to be completed and move to $ 0.33 levels.


IOTA/USDTFWB:IOTA is currently forming a wedge pattern. After a confirmed breakout of the pattern, a good entry could be taken. Remember to always use stop-loss. Everything is on the chart

#IOTA/USDT#IOTA
The price moves in a triangle from the beginning of December 2023
We are about to break the triangle strongly
We will break down Moving Average 100
The price now is 0.2800
The first target is 0.2953
The second goal is 0.3161
The third goal is 0.3336

iota looking bullish seems like iotausdt has already bottomed out and preparing for solid recovery in coming weeks
approaching towards multi year descending trend line and expecting breakout too incase of successful breakout expecting massive recovery in coming weeks
successful breakout can lead massive bullish rally towards 0.50$

#IOTAIn the H4 period, it is moving in a medium-term ascending channel, which is moving in a short-term descending channel with the formation of two lower ceilings. If the red box area does not break, the correction can continue until the specified areas. The current structure is corrective in the lower time frame and this upward corrective movement can be a pullback to the broken structure.

IOTA/USDT Keep on Eye, Ready for continue upward movement ???💎 IOTA has been making notable strides in the cryptocurrency market. Recently, it experienced a rebound from a key demand zone, which previously served as a supply area.
💎 If this rebound is sustained, IOTA could potentially continue its upward trajectory, aiming to test and potentially break through a critical resistance trendline. Successfully breaching this resistance, probability could pave the way for IOTA to reach stronger resistance levels, aligning with our target area.
💎 However, should IOTA struggle to break this pattern, there's a possibility of a retreat back to the demand zone for a reevaluation of momentum.
💎 A critical juncture arises if IOTA revisits this demand zone and fails to uphold its value above it, breaking through the demand floor. Such an occurrence would signal a shift to a bearish trend, potentially leading to a downward movement toward a support zone.
💎 In an extended bearish scenario, IOTA might even reach deeper support levels, emphasizing the importance of monitoring its ability to sustain above key demand zones.

IOTA IS LOADING UP BEFORE THE BREAK TOWARDS 0.60$-ALL SYSTEMS GOWe've discovered IOTA loading up for a massive move once it breaks the descending TrendLine that goes back to APRIL 2021.
IMAGINE breaking this after nearly 3 YEARS OLD, this is going to be explosive considering the status of the Crypto Market and the undervalued IOTA token.
Prepare your bags, this project is about to explode soon!!!
Target: 0.58$

IOTAUSDT.1DBased on the provided market data, IOTA is currently trading at $0.3059 against USDT. The Relative Strength Index (RSI) for 4 hours, 1 day, and 7 days are 67.15, 60.87, and 68.26 respectively. These values suggest that the currency is approaching overbought territory, indicating a possible slowdown or reversal in the near future.
The Moving Average Convergence Divergence (MACD) for 4 hours, 1 day, and 7 days are 0.0026, 0.01, and 0.0252 respectively. This suggests a bullish trend. The Bollinger Bands (BB) for 4 hours, 1 day, and 7 days are 0.3052, 0.3062, and 0.3155 respectively, indicating a relatively stable price movement.
The support levels for 4 hours, 1 day, and 7 days are 0.2862/0.2689/0.2511, 0.2442/0.2033/0.1431, and 0.1989/0.1668/0.1325 respectively. These are the price levels at which the currency has historically been unable to fall below, indicating a potential price floor.
The resistance levels for 4 hours, 1 day, and 7 days are 0.3162/0.3696/0.3820, 0.3694/0.4730/0.5662, and 0.3649/0.5662/0.9256 respectively. These are the price levels the currency has struggled to surpass, indicating potential price ceilings.
In conclusion, the technical analysis indicates a bullish trend for IOTA in the short term. However, the high RSI values suggest that a price correction might be on the horizon. Investors should keep an eye on the support and resistance levels, as well as the RSI and MACD indicators, for potential buy or sell signals. As always, it's crucial to consider other factors like news and market sentiment, and not rely solely on technical analysis.

IOTAUSDReview
I suggest looking at this coin from a long-term perspective, because this is one of those assets that you can take into your portfolio.
Throughout the bear market, buyers were able to hold onto 2 year support. Since June 2023, the price has increased by 175%, which gives us excellent prospects for big growth during the altseason.
It’s not worth buying a coin right now, because it’s very likely that we can see another good drop in alts. In the near future, we also expect that the coin will move in the channel, which began to form back in 2018.
Why is it worth taking a closer look at this particular coin?
IOTA became the first registered distributed ledger technology (DLT) fund under the auspices of the Abu Dhabi Global Market (ADGM) in the UAE. The move highlighted IOTA as a leader in digital finance in the Middle East and North Africa (MENA) region.
Also you can ask for only 1 altcoins analysis and i will try to do my best to cover as much as i can✍️

IOTA - 4H#IOTA has wrapped up its pullback and correction phase, primed to kick off the next bullish leg.
The two powerful bullish runs signal strong buyer momentum – the uptrend looks set to roll on! 🚀

#IOTA/USDT#IOTA
The price has been moving in a bear flag since July 2023
The downtrend has been broken
The moving average100 was also broken above
We also have oversold conditions on the MACD
Current price 0.2850
A rebound to 0.2270 is expected
Target 0.3640
Which represents 150% of the current price
You should pay attention to the retracement areas as shown on the analysis

iotaiota technical analysis basically on elliott waves principles and priceaction strategy
iota can be grow fast
wait and watch

IOTA weekly chart analysis - very important🚨🚨IOTA weekly chart analysis dear Crypto Nation😎
FIB 78.6% plays a big role for IOTAs price action
💠End of recovery in April 2021
💠Possible bottom after recent downmove
Very important🚨🚨
The POCs of the downmove from ATH and during the recovery were the same at $0.29
Look where price is now👀‼️
bullish scenario🐂🟢
price breaks POC & later trendline resistance at $0.90
bearish scenario🐻🔴
prive loses bottom at $0.135
Comments💭, Likes♥️ & Follow🔗 appreciated🤗
Disclaimer:
Not financial advice
Do your own research before investing
The content shared is for educational purposes only and is my personal opinion

WHAT AFTER THE VOLUME INCREASE IOTAThank you for reading this update.
Depending on our study we see that IOTA has a good chance of volume increase.
This updates depending on day trade, And the market should confirm with time the right market way.
Since the last increase its important to see IOTA having a new confirmation.
If there is new trend ww follow with new update.
#Nottradingadvice
Bitxer's IOTX/USDT: Scalp Smart, Trade Safe! 📈🛡️ IOTX/USDT for potential trading opportunities. Utilizing a graph pattern for both scalping and long-term strategies is a prudent approach. Waiting for a breakout from the supply zone could indicate a favorable entry point for a long position. Similarly, if it heads towards the supply zone, exercising patience might be wiser than risking losses. Bitxer is here to provide guidance and insights. Always prioritize your risk management strategy for successful trading! 📊💡🚀

IOTAUSDT Trend Line Breakout! IOTAUSDT Technical Analysis Update
Buy zone : Below $0.190
Stop loss : $0.170
Take Profit 1 : $0.205
Take Profit 2 : $0.250
Take Profit 3 : $0.370
Always Keep Stop Loss

IOTA Long -->See the big pictureReaching the area of support and weakness of sellers!
.
.
.
I think everything is ok...
Thanks to my teacher /> Deagle Trader

IOTA --- Will it's 3rd cycle be cursedCurrently enjoying a nice pop!
But where does an old asset like #IOTA go this cycle
IOTA may be doing well just getting above a $1
Some older coins I'm actually bullish on like
#LTC and #XRP as I believe these two will be included in some of crypto index devised by wall st
But coins out of that top 20/30 may that have been around since 2017 may languish
Too much competition for attention

IOTA/USDT - IOTA: Trend_Reversal◳◱ An intriguing development has unfolded on the FWB:IOTA / CRYPTOCAP:USDT chart as we've identified a compelling Trend Reversal. This shift in price dynamics indicates a noteworthy potential trend change. It's crucial for us to pay attention to the next resistance levels located at 0.1677 | 0.1837 | 0.2145 and the significant support levels found at 0.1369 | 0.1221 | 0.0913. Taking these factors into consideration, it may be prudent to contemplate entering a buy position at the current price of 0.159, allowing us to take advantage of the projected trend continuation.
Let's keep a watchful eye on this exciting opportunity and stay proactive in our trading strategies.
◰◲ General info :
▣ Name: IOTA
▣ Rank: 89
▣ Exchanges: Binance, Kucoin, Bybit, Huobipro, Gateio, Bittrex
▣ Category/Sector: Services - IoT
▣ Overview: IOTA is transaction settlement and data transfer layer for the Internet of Things (IoT). It's distributed ledger, the Tangle, is based on a data structure referred to as a Directed Acyclic Graph (DAG). In the Tangle there are no blocks or miners, and every transaction on the Iota network must validate two previous transactions through a small proof-of-work (PoW). Thus the more transactions occur, the faster the network can process new transactions, theoretically allowing the network to become more efficient as it scales.
◰◲ Technical Metrics :
▣ Mrkt Price: 0.159 ₮
▣ 24HVol: 1,827,655.453 ₮
▣ 24H Chng: 3.448%
▣ 7-Days Chng: 12.59%
▣ 1-Month Chng: 6.28%
▣ 3-Months Chng: -9.42%
◲◰ Pivot Points - Levels :
◥ Resistance: 0.1677 | 0.1837 | 0.2145
◢ Support: 0.1369 | 0.1221 | 0.0913
◱◳ Indicators recommendation :
▣ Oscillators: SELL
▣ Moving Averages: STRONG_BUY
◰◲ Technical Indicators Summary : BUY
◲◰ Sharpe Ratios :
▣ Last 30D: -23.01
▣ Last 90D: -21.22
▣ Last 1-Y: -18.39
▣ Last 3-Y: -18.23
◲◰ Volatility :
▣ Last 30D: 0.36
▣ Last 90D: 0.41
▣ Last 1-Y: 0.57
▣ Last 3-Y: 0.94
◳◰ Market Sentiment Index :
▣ News sentiment score is N/A
▣ Twitter sentiment score is 0.70 - Bullish
▣ Reddit sentiment score is N/A
▣ In-depth IOTAUSDT technical analysis on Tradingview TA page
▣ What do you think of this analysis? Share your insights and let's discuss in the comments below. Your like, follow and support would be greatly appreciated!
◲ Disclaimer
Please note that the information and publications provided are for informational purposes only and should not be construed as financial, investment, trading, or any other type of advice or recommendation. We encourage you to conduct your own research and consult with a qualified professional before making any financial decisions. The use of the information provided is solely at your own risk.
▣ Welcome to the home of charting big: TradingView
Benefit from a ton of financial analysis features, instruments and data. Have a look around, and if you do choose to go with an upgraded plan, you'll get up to $30.
Discover it here - affiliate link -

🚀 **IOTA/USDT - Long Position!** 📈🚀 **IOTA/USDT - Long Position!** 📈
Here's your step-by-step guide to this exciting trading opportunity:
🎯 **Entry Points**:
- Step 1: Secure your entry at 0.1412.
- Step 2: If the trend is in your favor, consider entering at 0.1445.
- Step 3: Further opportunities at 0.1469.
- Step 4: The ultimate target is 0.1522 - the sky's the limit! 🚀
🛡️ **Safety First**: To ensure your financial safety, set a stop loss at 0.1371. This acts as a safety net in case the market takes an unexpected turn.
🚁 **Prepare for Liftoff**: Now, it's time to go long on IOTA/USDT. As you progress through the entry points and your position starts to gain momentum, keep your sights on those targets. With patience and strategy, we're ready to soar together into the world of profit. 🌠🚁
Happy trading, and may your journey be a prosperous one! 📊💰

IOTAUSD Strong sell on 1day MA100 rejection.IOTAUSD got rejected on the 1day MA100 today.
This made the latest Lower High inside the 10 month Falling Wedge, which keeps the trend bearish.
Sell now and target 0.13500 (Support A).
The 1day RSI got rejected on its own Falling Resistance.
Follow us, like the idea and leave a comment below!!
