#IOTA/USDT#IOTA
The price is moving within a descending channel on the 1-hour frame, adhering well to it, and is on its way to breaking it strongly upwards and retesting it.
We are seeing a bounce from the lower boundary of the descending channel, which is support at 0.2125.
We have a downtrend on the RSI indicator that is about to break and retest, supporting the upward trend.
We are looking for stability above the 100 moving average.
Entry price: 0.2135
First target: 0.2261
Second target: 0.2364
Third target: 0.2483
Iotabtclong

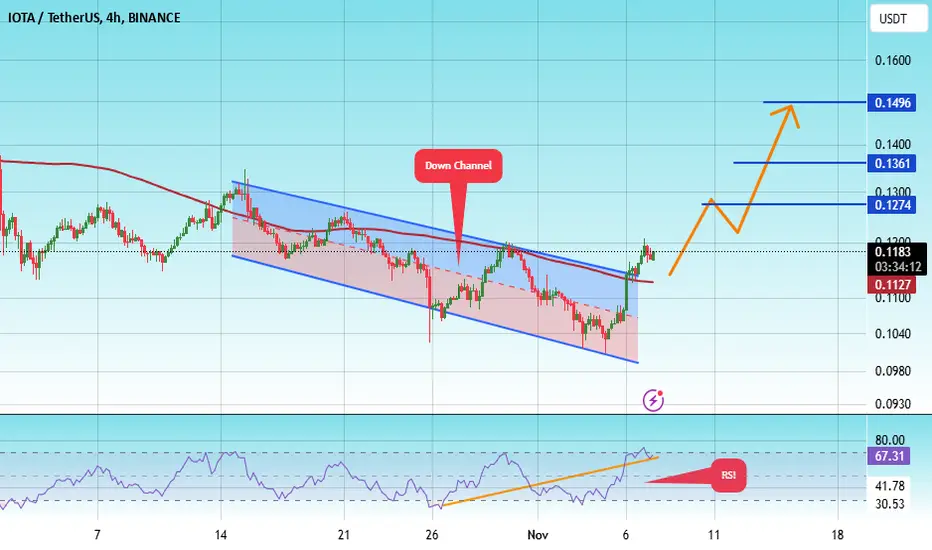
#IOTA/USDT /Ready to go up#IOTA
The price is moving in a descending channel on the 4-hour frame and sticking to it well
We have a bounce from the lower limit of the descending channel, this support is at 0.1011
We have an upward trend, the RSI indicator is about to break, which supports the rise
We have a trend to stabilize above the moving average 100
Entry price 0.1182
First target 0.1274
Second target 0.1360
Third target 0.1496
💡Don't miss the great buy opportunity in IOTABTCTrading suggestion:
". There is a possibility of temporary retracement to the suggested support line (0.0000307).
. if so, traders can set orders based on Price Action and expect to reach short-term targets."
Technical analysis:
. IOTABTC is in a range bound, and the beginning of an uptrend is expected.
. The price is above the 21-Day WEMA, which acts as a dynamic support.
. The RSI is at 46.
Take Profits:
TP1= @ 0.0000330
TP2= @ 0.0000348
TP3= @ 0.0000369
TP4= @ 0.0000383
TP5= @ 0.0000420
SL= Break below S2
❤️ If you find this helpful and want more FREE forecasts in TradingView
. . . . . Please show your support back,
. . . . . . . . Hit the 👍 LIKE button,
. . . . . . . . . . Drop some feedback below in the comment!
❤️ Your support is very much 🙏 appreciated!❤️
💎 Want us to help you become a better Forex / Crypto trader?
Now, It's your turn!
Be sure to leave a comment; let us know how you see this opportunity and forecast.
Trade well, ❤️
ForecastCity English Support Team ❤️


IOTA/BTC Broadening descending wedgeLots of IOTA news coming this month with Chrysalis around the corner


IOTA might break above the ichimoku cloud on the weeklyLots of development in IOTA, big updates rolling out over the next months.


IOTA / BITCOIN (IOTABTC) DailyDates in the future with the greatest probability for a price high or price low.
The Djinn Predictive Indicators are simple mathematical equations. Once an equation is given to Siri the algorithm provides the future price swing date. Djinn Indicators work on all charts, for any asset category and in all time frames. Occasionally a Djinn Predictive Indicator will miss its prediction date by one candlestick. If multiple Djinn prediction dates are missed and are plowed through by same color Henikin Ashi candles the asset is being "reset". The "reset" is complete when Henikin Ashi candles are back in sync with Djinn price high or low prediction dates.
One way the Djinn Indicator is used to enter and exit trades:
For best results trade in the direction of the trend.
The Linear Regression channel is used to determine trend direction. The Linear Regression is set at 2 -2 30.
When a green Henikin Ashi candle intersects with the linear regression upper deviation line (green line) and both indicators intersect with a Djinn prediction date a sell is triggered.
When a red Henikin Ashi candle intersects with the linear regression lower deviation line (red line) and both indicators intersect with a Djinn prediction date a buy is triggered.
This trading strategy works on daily, weekly and Monthly Djinn Predictive charts.
This is not trading advice. Trade at your own risk.

IOTA / BITCOIN (IOTABTC) WeeklyDates in the future with the greatest probability for a price high or price low.
The Djinn Predictive Indicators are simple mathematical equations. Once an equation is given to Siri the algorithm provides the future price swing date. Djinn Indicators work on all charts, for any asset category and in all time frames. Occasionally a Djinn Predictive Indicator will miss its prediction date by one candlestick. If multiple Djinn prediction dates are missed and are plowed through by same color Henikin Ashi candles the asset is being "reset". The "reset" is complete when Henikin Ashi candles are back in sync with Djinn price high or low prediction dates.
One way the Djinn Indicator is used to enter and exit trades:
For best results trade in the direction of the trend.
The Linear Regression channel is used to determine trend direction. The Linear Regression is set at 2 -2 30.
When a green Henikin Ashi candle intersects with the linear regression upper deviation line (green line) and both indicators intersect with a Djinn prediction date a sell is triggered.
When a red Henikin Ashi candle intersects with the linear regression lower deviation line (red line) and both indicators intersect with a Djinn prediction date a buy is triggered.
This trading strategy works on daily, weekly and Monthly Djinn Predictive charts.
This is not trading advice. Trade at your own risk.

IOTA/BTC BULLISH!
IOTA Had bull break of a fallen wedge pattern which is a good sign but need to hold area
at 3146-3047 sats and hold trend-line support potential target for next wave up to 3507-3746 sats for this coin expect a little pullback for now to retest the support trend-line

IOTABTCExit the descending channel
Guys, if you like the idea please put like button, this will be the best thanks.
Thank you for your support, I appreciate it.

IOTABTC formed bullish BAT | Upto 44% bullish movePriceline of World's 23th ranked cryptocurrency out of more than 2300 cryptocurrencies IOTA (MIOTA) with Bitcoin pair has formed bullish BAT pattern and entered in potential reversal zone.
This PRZ area should be used as stop loss in case of complete candle stick closes below this zone.
Lets have a look on the move of price action to see how perfect this pattern is driven:
After initial leg (X to A) the A to B leg is retraced between 0.382 to 0.50 Fibonacci and then B to C leg is projected between 0.382 to 0.886 of A to B Fibonacci projection area and last leg (C to D) is retraced between 0.786 to 0.886 Fibonacci and now the price action is moving in potential reversal zone of this bullish BAT and now we can expect bullish divergence at any time which will lead the priceline between 0.382 to 0.786 Fibonacci projection of A to D leg , but if after this bullish divergence the candles sticks will be closed above the 0.786 Fibonacci projection area of A to D leg then it can also lead to the long term bullish move.
As per Fibonacci sequence method we can set our targets as below:
Buy between: 0.00002408 to 0.00002264 sats
Sell between: 0.00002752 to 0.00003265 sats
So mid term trade has potential to give upto 44% bullish move.
Regards,
Atif Akbar (moon333)
The harmonic moves analysis involves hours of hard work and determination however the success of harmonic trading in fiat and cryptocurrencies is around 80% therefore it is always important that you follow any stop loss strategy while trading harmonic patterns I have also shared a stop loss idea in this article, the information in this article is for educational purpose only this is not an investment advice, I have tried my best to catch the harmonic moves as per predefined classical harmonic BAT pattern if you find any flaw or you have any suggestion feel free to share with me in comments section.


IOTA/BTC TA Update (Big Bounce at key support?)IOTA/BTC
IOTA price has now reached the 0.618 Fib support and an area of confluence plus descending trend-line support.
There is a high probable chance of bounce will happen in this area especially when RSI is approaching oversold condition.
We could expect some price action to happen within a week.

IOTA/BTC longIOTA/BTC LONG after the reaction from the blue zone
ENTRY:
1. entry zone 3083 - 2983 sat.
2. entry zone 2734 - 2634 sat.
TARGET:
1. 3487 sat.
2. 4456 sat.
3. 4804 sat.
4. 5351 sat.
GL

IOTA - Possible 30% + Gains With BTC PairIOTA looking set to reclaim losses from mid-late May. Like most altcoins recently it been tough but it looks like the tide is going to turn soon.
Keep in mind a tight stop loss and news that makes Bitcoin Pump.
Ideally, we are waiting for Bitcoin Dominance to return to lower levels which would indicate a safer entry into altcoins.

IOTA/BTC - massive pump incomingIOTA/BTC weekly looks set to make a massive pump.
Target: 0.00012800
Blue triangle indicates the current range.
Green box is buy.
Red box is sell.
Blue line indicates major resistance.
Yellow line indicates t/p.
This is a log chart.

Important levels to watch for IOTA HodlersBITFINEX:IOTUSD
Iota has been on a longterm downtrend just as the rest of the altcoins and suffered severe losses in Value.
It managed to bounce a little after the current drop, to $0.57.
The maximum bounce on this current run we see about $0.64 where it will be hitting the 0.5 fib retracement.
That would be a good area to sell/short iota.
Targets are the two redline support levels at $0.39 and $0.26 which are the longterm buy areas for IOTA.
