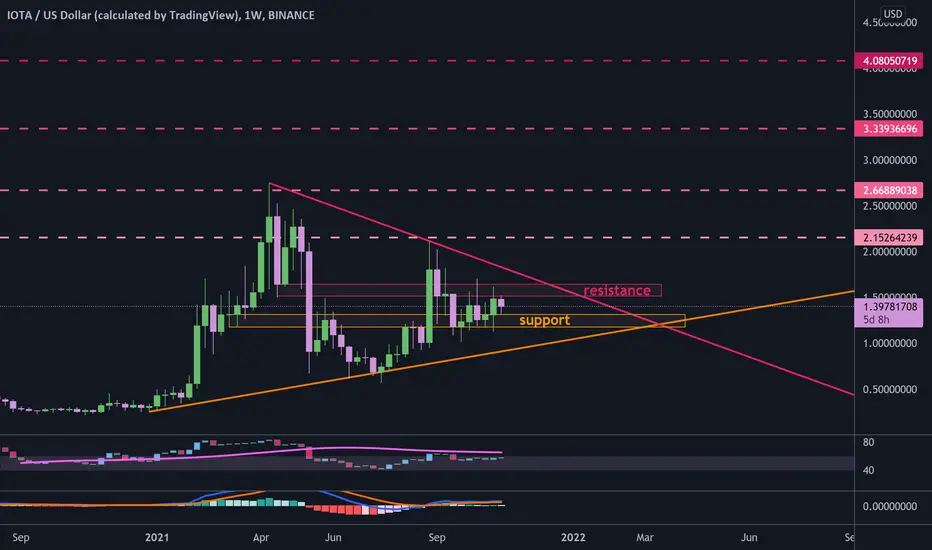
IOTA triangle then cup & handle to $4#IOTAUSD
$IOTA is trading inside a triangle in weekly time frame, if price break down from support zone then the long erm ascending support will hold it.
and if price success to break out from resistance zone and upper line of triangle, target can be around $2.6.
also there is a cup and handle pattern in monthly time frame that can lead price to touch $4.
Iotausd


Double 'cup and handle' formation on IOTAWith optimistic glasses on, you can view a double 'cup and handle' configuration for IOTA that could get us towards 3$.

IOTAUSDT | Long/BuyThe chart show us that correction ABC wave 2 is over and then continues to make impulsive wave 3 which is the longest wave. But if the chart going down to bellow 1.2047 that mean the wave 2 still continues. use 1.2045 level as stop loss.

IOTA MIOTA ready to fly 2.0 - IOTABTC IOTAUSDT IOTAUSDC IOTAUSDIOTA MIOTA Ready to fly 2.0 , must follow Daily Channel , keep SL if breakout daily channel

IOTA 1Diota is looking bullish. ema providing good support MACD bullish. iota can near breakout it can give good gains. NFA


IOTA/USD: UPTREND| PRICE IS GROWING FAST....Welcome back Traders, Investors, and Community!
Check the Links on BIO and If you LIKE this analysis, Please support our Idea by hitting the LIKE 👍 button
Traders, if you like this idea or have your own opinion about it, please write your own in the comment box . We will be glad for this.
Feel free to request any pair/instrument analysis or ask any questions in the comment section below.
Have a Good Day Trading !

iota iota iota iota iota iota iota iotaiota iota iota iotaiota iiota iota iota iota iota iota iota iota iota iota iota iota iota iota iota iota

IOTA - Trend-Following Buy Setup!Hello everyone, if you like the idea, do not forget to support with a like and follow.
IOTA is overall bullish so we will be looking for buy setups on lower timeframes.
on H4: IOTA is forming a trendline in red but it is not valid yet, so we are waiting for a new swing high to form around it to consider it our trigger swing. (projection in purple)
Trigger => Waiting for that swing to form and then buy after a momentum candle close above it (gray zone)
Meanwhile, until the buy is activated, IOTA would be overall bearish can still trade lower.
Good luck!
All Strategies Are Good; If Managed Properly!
~Rich

Will IOTAUSDT Find Support Soon?Hi Friends,
Will IOTA vs TetherUS pair find support at the nearest support zone 0.9600 area or drop further to 0.6200 area before reversal?
drop your comments let me know what you thinks
PPPDirhams.
Disclaimer: This is just my idea. Am not liable for the end results if adapted by anyone. Trade cautiously as there are chances that you will lose your investment..
BINANCE:IOTAUSDT

IOTA Short SetupIOTA has formed Head & Shoulder Patern on 4 Hours Chart . It could go as per my prediction after crossing the neckline.

iota/usdTesting/tracking elliot wave theory. Please do not trade off idea without S/L. Not financial advice.
I have been getting a lot of questions on "time" and I can't predict the future so I can't give you a time... Ain't nobody here charting with a crystal ball. Here is an example of Elliot wave price predictions. The timing that I want is within the white wave, but I can't predict the future lol nor can I call the top or bottom. I am using the general rules of elliot wave theory to try and give you an accurate price prediction. The red wave being the fastest wave, blue wave being the middle, the white wave is my prediction and the purple wave is also possible, lagging behind my prediction. With that being said, the wave count on any of these is possible. The purpose of elliot waves is to give you a general idea of price action so you can time your entry and exits. Any of these wave counts can go a bit higher or lower as no one have a crystal ball and this is just a general idea of price action movement.

IOTAUSD Wyckoff Accumulation Schematic $IOTAWyckoff accumulation schematic of IOTAUSD
Elliott wave projection
Bullish case
NFA, DYOR

IOTA LOOKING BULLISH! READY TO BROKE OUT AND FLY?IOTA has a strong resistance on daily timeframe from APRIL and a new resistance formed from SEP, however, smaller tfs on IOTA are turning bullish, looks like IOTA is getting ready to breakout of this month old resistance. The recent crash helped IOTA forming up the right shoulder.
- Inv H&S on 4hr timeframe.
- 200 EMA support is there just below the price candles on 4hr and daily tf, so less risky.
- Falling wedge on 4hr.
- Support is becoming stronger and resistance is getting weaker.

💡İOTABTC ANALYSIS💡Hello Friends
graph four-hour te viewed our bats Formation Boge ( Bullish Bat ) formation present
Volume momentum is coming from Processing Input too risky .risk manage my money is very important in this key process.
There are technical levels on the chart.
Tp1:0.00003200
Tp2:0.00003709
Tp3:0.00004185 trade
entry level :0.00002584 At the close of the 4-hour candle,
stoplos:0.00002014 I keep the level away from my own money management
. You can pull it close . IT IS NOT INVESTMENT ADVICE.
If you are using the analysis, do not forget to like and follow,
if there is something wrong with the formation, you can warn
Educational purposes
bat Formation Boge ( Bullish Bat )
Rules:
X / EU = 0.382 and 0.50 in
the EU / CD = 0.382 and between 0.886
BC / CD = 1,618 with between 2,618
XA / CD = 0.886

IOT/USD approaches potential resistance at 1.44
If you missed the original run from 1.20 and the break out at 1.33, then there might be an opportunity to get in if the price pulls back to current support estimates at 1.38, 1.33, and 1.27.
The current trend looks very strong to the upside; however, we all know there is always a pullback in an uptrend, which could be an opportunity to get in.

IOTA BREAKOUT - POINTS TO WATCH ATIOTA daily chart
Points you should watch at IOTA daily chart. IOTA is currently trying to breakout and i will long if it breaks 1.40 level.
Also an long on retest of 1.40 - 1.32 is very good if we get that retest!
Updates follow.

iota foe breakouts targets for iota are clearly showing if btc could breaks out above 60K iota will perform heavily

Why not buy IOTA for 100 % profitAs we see here the correction is at its end, if BTC lets, it will see 2.5 $ in next days. Buy for long by leverage 2 or 3 is full safe.

Cup and handle on the weeklyA cup and handle is a technical chart pattern that resembles a cup and handle where the cup is in the shape of a "u" and the handle has a slight downward drift. A cup and handle is considered a bullish signal extending an uptrend, and is used to spot opportunities to go long.

IOTA/USDTIOTA
The IOTA/USD price seems to be bullish rather than bearish, especially in the medium term.
CAN IT HOLD ANOTHER RESISTANCE?
