I oughta row, row, row IOTA here.... Break through... PLEASEMaybe the latest news will spurn some life into this floating boat and push us out of this boring little boat we are trending in. There is a small MACD confluence accompanied by a minor uptick in volume and a stochastic uptrend. Does that mean I can jump ship or ride her to paradise island. Look for a little pop... just a wee bit more confirmation and maybe she's heading on up to the EAST side. Probably to join a street gang.
Here's a quote from IOTA about nine hours ago.
#IOTAQuicktakes - Let's start the week with the latest #IOTA news? The IOTA #token officially on #BinanceSmartChain, the new #Pollen upgrade with #mana being used by #FPC #autopeering, the IOTA #CaWEndar and more. youtu.be
Iotausd

It's time for IotaHello guys
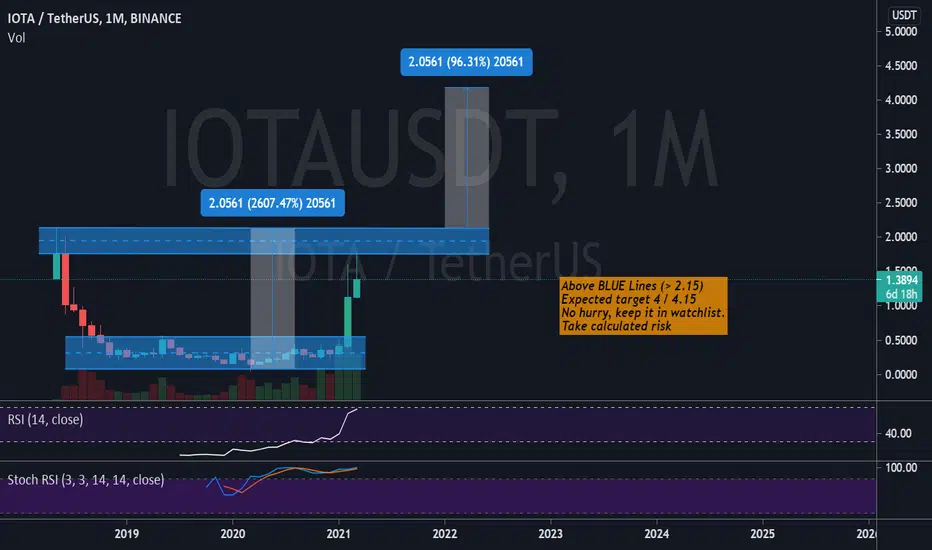
If you waiting for growth you have to wait for brakeout white line and confirmation then we have to big chance to pump IOTA. Let's see and be patient.
Good luck friends!
Address for donation:
LTC:
MRkwgSCQz44zqM7Bb1cYdhYQcHQYD8GoEi

IOTA: Ascending Triangles everywhere! – 1HAnother Ascending triangje, this time on the 1H. Target $1.75

IOTA: A new Dawn - I'm calling it!What do you think guys, am I too bullishin this idea? Anyhow soon (TM) we will see!
For outsiders, check out IOTA's biggest update so far: blog.iota.org

IOTA Next Moves (Long term)If we broke the red resistance area, most likely will see the 2017 bull run moves playing out

IOTA can be one of best altcoins during this bullrun. BIG PROFITIOTA is very very good project. This coin have solid foundations. This coin is on our golden list of altcoins and it will give use huge profit in this bullrun. Holders will be rewarded.
If you want to know our golden list of altcoins for this bullrun and play with us on short term signals feel free to join us on our website!


IOTA (MIOTA) - March 31Hello?
Dear traders, nice to meet you.
By "following" you can always get new information quickly.
Please also ask for the "Like" clock.
Have a nice day.
----------------------------------
We have to see if we can get support and climb at 1.49422213.
If it goes down, you need to make sure you get support at 1.38050147.
If you fall at the 1.38050147 point, you need a short stop loss.
However, it may rise along the uptrend line, so careful trading is necessary.
If it falls in the 1.03265428-1.14804624 interval, a Stop Loss is required to preserve profit and loss.
It is expected to reorient itself by ascending to the 1.84039802-1.95578998 section.
---------------------------------------
(IOTABTC 1D chart)
It remains to be seen if we can get support at the 2566 Satoshi point and follow the uptrend line to the 2667 Satoshi-2889 Satoshi section.
The 2566 Satoshi point is a point where you can enter to ascend above the 2667 Satoshi point.
If you fall at 2473 Satoshi, you need a short stop loss.
If it falls at 2222 Satoshi, Stop Loss is needed to preserve profit and loss.
If the 2667 Satoshi-2889 Satoshi section is supported, it is expected that there will be a move to ascend more than 3555 points.
-------------------------------------------------- -------------------------------------------
** All indicators are lagging indicators.
So, it's important to be aware that the indicator moves accordingly with the movement of price and volume.
Just for the sake of convenience, we are talking upside down for interpretation of the indicators.
** The wRSI_SR indicator is an indicator created by adding settings and options from the existing Stochastic RSI indicator.
Therefore, the interpretation is the same as the conventional stochastic RSI indicator. (K, D line -> R, S line)
** The OBV indicator was re-created by applying a formula to the DepthHouse Trading indicator, an indicator that oh92 disclosed. (Thank you for this.)
** Check support, resistance, and abbreviation points.
** Support or resistance is based on the closing price of the 1D chart.
** All explanations are for reference only and do not guarantee profit or loss on investment.
Explanation of abbreviations displayed on the chart
R: A point or section of resistance that requires a response to preserve profits
S-L: Stop Loss point or section
S: A point or segment that can be bought for profit generation as a support point or segment
(Short-term Stop Loss can be said to be a point where profits and losses can be preserved or additionally entered through installment transactions. It is a short-term investment perspective.)
GAP refers to the difference in prices that occurred when the stock market, CME, and BAKKT exchanges were closed because they do not trade 24 hours a day.
G1: Closing price when closed
G2: Cigar at the time of opening
(Example) Gap (G1-G2)

the forgotten IOTA BACK? = YES YES THE GREEN COFFEE TIME COMINGHello my trading friends,
I hope you have great time.
Depending on my study on IOTA, it looks we can get a time with some increase trends. thats why i called in title : the forgotten IOTA BACK?
Time will show us this.
Have safe trades,
Like and follow our channel for more nice free signals! Thank you..
Discipline are the key to success - Take profit - Learn from your mistakes and never give up!
The reason 1 that 90% of traders lose, not because they can't trade, but because they trade emotionally.
if this appeals to you then learn yourself first before starting with trading.
#Always do your own research don't follow us or someone else blindly

IOTA where to buy ?Good morning people 👍
𝙒𝙤𝙪𝙡𝙙 𝙮𝙤𝙪 𝙡𝙞𝙠𝙚 𝙩𝙤 𝙠𝙣𝙤𝙬 𝙖𝙩 𝙬𝙝𝙖𝙩 𝙥𝙤𝙞𝙣𝙩 𝙩𝙤 𝙗𝙪𝙮 $MIOTA ?🤑🤑
I teach you easily with a graph , the only thing you have to memorize are the 4 areas drawn with 🟢Green / 🟡Yellow / 🔴Red /⚫Black.
🟩Best entry : 0.91 USD
🟨A good entry : 1.15 USD
🟥Risky entry : 1.55 USD
⬛Danger zone : 0.75 USD
PD : Black zone is dangerous if the price crossdown this level, it could go down much more. $BTC $ETHEREUM $LTC $ADA $XRP $BNB $XLM
PD2 : "Risky Entry" means that it is a more dangerous entry compared to the other 2 colors. But it is a valid entry anyway.
PD3 : Leave me in the comments, what do you want to analyze next. (any crypto/stock/indices )
𝙄𝙛 𝙮𝙤𝙪 𝙡𝙞𝙠𝙚𝙙 𝙞𝙩 𝙤𝙧 𝙞𝙩 𝙝𝙖𝙨 𝙗𝙚𝙚𝙣 𝙝𝙚𝙡𝙥𝙛𝙪𝙡, 𝙮𝙤𝙪 𝙘𝙤𝙪𝙡𝙙 𝙨𝙝𝙖𝙧𝙚 𝙩𝙝𝙚 𝙥𝙤𝙨𝙩 / 𝙘𝙤𝙢𝙢𝙚𝙣𝙩 / 𝙡𝙞𝙠𝙚.
The post would have more visibility so that more people can see it.✅
Check my profile @vbirnoschi !!!

IOTA/USDT BUY SIGNALAnother opportunity by IOTA, this could be a strong wave up, considering potential bottom for the bitcoin.

IOTA: To all the morons out there: WE'RE TOTALLY FINE - HODLFakeout? no problem, hodl & try to load up more at 1.40
Ascending Triangle TA still intact. Also all the indicators are overblown on 30m -> bullish.


IOTA 4H , Breakout ? Iota seems to have broken the resistance, wait for Pullback to buy, I think buying Iota will be profitable , like and comment , GoodLuck...


What's standing between IOTA and $2? NOTHING!!I'm not a financial analyst or advisor though, so chart for yourself.

IOTA | ASCENDING TRIANGLE | 23rd March 2021 - 3rd April 2021Textbook ascending triangle pattern. Breakout confirmation after daily close above $1.58. Book profits around weekly resistance of $2.42


IOTA long downtrend on the verge of breaking upward.IOTA is reversing after years of downtrend, even though many old alt coins are pretty much higher then their lowest point (still long way till ATH), but IOTA just started to breakout.
*** Do your own research.
*** This is just my own analysis, not an investment advice.


