5G technology will bring IOTA to the moon by July 2021After the Pandemic, it is the rise of the world with 5G technology, which facilitates the internet of things and makes it practical. IOTA is the coin for the internet of things and if you know how it works, then you will realize how 5G can boost its price. IOTA will be among the top 10 coins by July 2021.
Iotausd

IOTA 900 days BREAKOUTIOTA broked the downtrend line (green line, 900 days).
Weekly candle closing above U$0.44 confirm the breakout.
TARGET: U$0,80

$IOTA Inverse Head and Shoulder Pattern$IOTA has formed a lovely bottoming pattern - Inverse Head and Shoulders
We also produced a nice close above $0.49
This chart is bullish. Next target is around $0.937
I'd be happy to buy spot on this breakout, some may decide to wait for a retest of $0.49. Either way we ae making our way to $0.937 and once that level is broken, $2.32 is next.

MIOTA - IOTA - Analysis IOTA is a distributed ledger with one big difference: it isn’t actually a blockchain. Instead, its proprietary technology is known as Tangle, a system of nodes that confirm transactions. The foundation behind this platform says this offers far greater speeds than conventional blockchains — and an ideal footprint for the ever-expanding Internet of Things ecosystem.
Because there’s no blockchain, there are no miners, and because there are no miners, there are no fees. Many established networks see costs balloon when congestion intensifies, but IOTA aims to provide limitless throughput at minimal expense.
In time, IOTA’s goal is to become the de facto platform for executing transactions between IoT devices. Given how estimates suggest there could be 20.4 billion such devices out there by 2024, this could end up being big business.
The team behind IOTA believe that the potential use cases don’t end here. They believe their distributed ledger could deliver digital identities to all, result in car insurance policies that are based on actual usage, pave the way for cutting-edge smart cities, deliver seamless global trade and prove the authenticity of products.
Originally known as Jinn, a crowdsale for the project was held in September 2014, and the network officially launched in 2016.
Who Are the Founders of IOTA?
IOTA has four co-founders, and their names are Sergey Ivancheglo, Serguei Popov, David Sønstebø and Dominik Schiener.
According to the IOTA Foundation, the initiative has rapidly grown since then — and team members are now based across more than 25 countries.
Sonstebo and Schiener are collectively co-chairmen of the board of directors, while Popov is a board member and the foundation’s director of research.
Ivancheglo resigned from the Berlin-based project back in June 2019 but continues as an unofficial advisor. At the time, he said in a statement: “I no longer believe that the IOTA Foundation is the best setting for me to realize what we set out to create back in 2014 and 2015. I have always done my best work in a less rigid environment. I am looking forward to continuing the work on both hardware and software development of IOTA independently.”
What Makes IOTA Unique?
Well, as we alluded to a little earlier, the fact that it’s effectively a blockchainless blockchain is rather unusual to say the least.
Tangle’s more technical name is the Directed Acyclic Graph — and as Sønstebø explained in a blog post back in 2015, this technology aims to retain blockchain’s ability to execute secure transactions. The only difference is that it does away with the notion of blocks.
He also wrote: “IOTA should not be considered an alternative coin (altcoin) to existing cryptocurrencies such as Bitcoin, rather it is an extension of the growing blockchain ecosystem. It’s meant to work in synergy with these other platforms to form cohesion and symbiotic relationships. IOTA is designed to provide one solution that no other crypto does: efficient, secure, lightweight, real-time micro-transactions without fees.”
New transactions are validated by approving two previous transactions from another node — and this is a novel approach because it means that the network’s size and speed will be directly related to how many people are using the platform.
And whereas some cryptocurrencies are run as a business, the IOTA Foundation says it is firmly not for profit — adding that it has the sole goal of making the network as prosperous as possible.
Finally, IOTA has distinguished itself from many other crypto rivals by establishing high-profile partnerships with the carmaker Volkswagen, and helping the city of Taipei to pursue smart projects.
IOTA Price $0.5412
Price Change
24h
$-0.01937
3.57%
24h Low / 24h High
$0.5299 /
$0.5942
Trading Volume
24h
$111,206,575.15
46.91%
Market Dominance 0.13%
Market Rank #38
IOTA Market Cap
Market Cap $1,506,092,741.10
2.73%
Fully Diluted Market Cap $1,506,092,741.10
2.73%
IOTA Price Yesterday
Yesterday's Low / High
$0.4978 /
$0.6134
Yesterday's Open / Close
$0.5140 /
$0.5596
Yesterday's Change
8.85%
Yesterday's Volume $205,129,351.18
IOTA Price History
7d Low / 7d High
$0.3947 /
$0.6134
30d Low / 30d High
$0.3291 /
$0.6134
90d Low / 90d High
$0.2448 /
$0.6134
52 Week Low / 52 Week High
$0.07962 /
$0.6134
All Time High
Dec 19, 2017 (3 years ago)
$5.69
90.48%
All Time Low
Mar 13, 2020 (a year ago)
$0.07962
580.55%
IOTA ROI
91499.08%
IOTA Supply
Circulating Supply 2,779,530,283 MIOTA
Total Supply 2,779,530,283 MIOTA
Max Supply 2,779,530,283 MIOTA
BINANCE:IOTAUSDT
BINANCE:IOTABTC
BINANCE:IOTAUSD
BINANCE:IOTABUSD
BINANCE:IOTAETH
BINANCE:IOTAUSDTPERP
BITFINEX:IOTUSD
HUOBI:IOTAUSDT
BITFINEX:IOTUSD
BITTREX:IOTABTC
BINANCE:IOTABNB
OKEX:IOTAUSDT
HITBTC:IOTAUSDT
BITFINEX:IOTEUR
BITTREX:IOTAUSD
BITFINEX:IOTBTC
HUOBI:IOTABTC
HUOBI:IOTAPERP
HITBTC:IOTAUSD
HITBTC:IOTABTC
OKEX:IOTAOKB
HITBTC:IOTAETH
OKEX:IOTAUSDTPERP
BITFINEX:IOTTRY
BITFINEX:IOTTHB
BINANCE:BTCUSDT BITFINEX:IOTGBP

$IOTA - The giant is waking up..We've reached weekly supply. We only touched this level once in the last 2.5years. I don't expect us to get straight through, it would be much healthier if we're to burn out here, and retrace for a healthy re-accumulation - before we head into a true euphoric run.
Long term, chasing 10x from the bottom of the retrace that is hopefully to come.
I've sold a nice mount and am looking for a rebuy.

IOTAUSDT - Inverted Head and Shoulder Pattern. Bulls Ahead! Welcome!
What's up traders! Thanks for Jumping back on my Analysis, 👨💻 Trader champ is here behind the charts, Hit the thumbs up 👍 and support the work
Follow the trade plans and notes. Sketch up your own trade setup and make sure you meet with the required confirmations first, before you make your move!
________________________________________________
Traders Disclaimer: Non of our analysis or trade setups which is shared here on trading view is a trading advice. As we keep on weekly updates with our predictions and expectations. We may take them as a trades only if trade setups meets the required criteria ( Confirmations ). We will never make a move or look back if trade setup invalidates with price action or future economical movements. Understanding the markets is the key behind all success stories. So never miscalculate under estimate anything which is out of your bounds. Take them at your own risk as trading is highly risky and you may loss your investments.
Mohamed Khalid Rafi ,
Senior Financial Analyst,
Profitlio Trading.

$0.90 By June or worst case back to $0.38We're out of the bear market, we're in an upward trend, I'm optimistic even if we re-trace down to the $0.35 cents area again i'll just buy more until it bounces to $0.90 which it will eventually, all in good time

#iotausdt #weeklyHi guys..its the latest analyze chart of IOTAUSDT in weekly time frame .if you are interested any crypto that you want analyze with me and any questions please do not hesitate and comment below the chart!
if u like it press like-comment and folow me.thx

IOTAUSDT at it again. Will it succeed this time?I've been harping about this setup for a while now and kept getting stalled. Patience is a virtue they say. :)
We really just need to take out that 0.49 level and there should be better probabilities we'll see that big move up.


IOTA/USDT Getting Prepared to Fly 🚀 🚀 🚀 💡 Trade Idea
📈 Buy Limit IOTA/USDT @ 0.3987
🎯 Target Profit 0.4431
🛑 Stop Loss 0.3839
❌ Do not risk more than 1 % of your account on each trade
🙂 Good Luck !
Description:
The price was trading within a corrective channel before succeeding to break it to the upside. A lower correction is seen to the daily support @ 0.3989 where we have the 61.8% Fibonacci retracement level. Our expectation now is a move upwards to the 0.0444 mark.
-------------------------------------------------------------------------------------
Please press “Like” if you appreciate the trading idea 👍
“Follow” for more trading ideas in the future 👀
“Comment” below to share your thoughts with us and other traders 👥
-------------------------------------------------------------------------------------
Risk Disclaimer: All trading ideas published by “collegeofpips” are for educational purposes only. These posts can help you to enhance your trading skills, but please do your own research before opening any trading position. ⚠️

IOTA - USDTPossible traingle on daily chart. Price holding above pivot. if triangle confirms objective is $.59


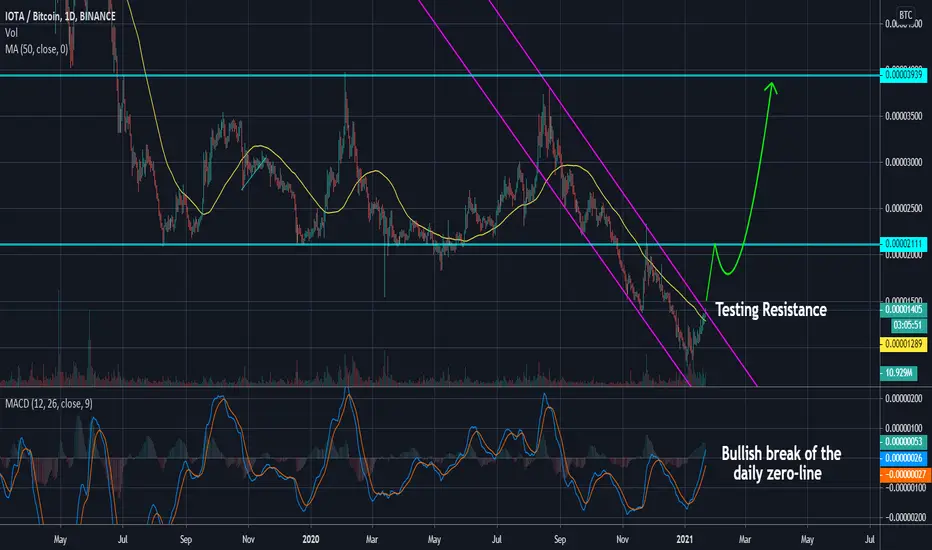
IOTA - Testing Resistance, 50%+ gains in the works!Take a quick look at the daily chart for IOTA/BTC. The price has been in a descending channel since August of 2020 and lost 79% of its value. But since then, the price action has shown a strong bullish reversal taking out the MA50 and is now testing resistance. If we can break out here, I could see the price jumping very quickly. The MACD has cleared the zero-line which is also bullish, especially on the daily time frame. Get ready!
IOTAUSDT - INVERSE HEAD AND SHOULDERS PATTERNANALYSIS 🔎
- IOTAUSDT is printing the inverse head and shoulders pattern on the weekly timeframe.
- This is a trend reversal pattern.
- It is a bullish pattern.
- RSI is printing a bullish divergence signal.
- Price brokeout above the the previous swing high and is testing the neckline resistance.
BUY ENTRY ⬆️
- Breakout above the neckline resistance.
SETUP INVALIDATION ❌
- Breakdown below the right shoulder's support level.

Here I go long on IOTA and IOTA will go upHere I go long on IOTA. The price is testing the major resistance, so now I go 5x long and the bullish breakout will start. And IOTA will go up. See you up there.

IOTAUSDT seeing some follow through buying. Next Level to watchBeen watching this setup unfold for a bit now.
Seeing some follow through after breaking that tough 0.43 level on a daily closing basis (would love to see the weekly close too).
Flip 0.49 and odds increase of a run to a measured move from this huge inverted H&S pattern.


IOTA IOTA formed a bullish triangle with the potential to break out the resistance line up
Best regards EXCAVO


IOTUSDT making a break for it... Breakout setup back in play. Waiting for a weekly close here but not beyond me to entering small and early if LTF price action shows a strong possibility.

IOTA 900 days BREAKOUT soon!IOTA has not broken a downtrend line (green line, 900 days) yet.
BTC has corrected and ALTS has fallen.
The best moment to entry is the breakout confirmation.
It's safer to entry if the daily candle closes above $0,45.
